MASTER’S THESIS
Enhancement of the Coagulation and Antimicrobial
Activities of M. oleifera Protein by Mutagenesis
Master’s Thesis
Delaram H. Afshari
Department of Environmental Microbiology
KTH ROYAL INSTITUTE OF TECHNOLOGY
Abstract
The small seed protein of the tropical plant Moringa oleifera is a natural coagulant with excellent coagulation as well as antimicrobial property. This protein is therefore a potential candidate for replacement of chemicals being currently used as coagulants in water treatment. The main purpose of this study is to make a recombinant MO2.1 protein with enhanced antimicrobial and coagulation activity. PCR-mutagenesis was applied to implement site-directed point mutations in the gene sequence of MO2.1 protein. The coagulation activity of the mutated recombinant MO2.1 was assayed using kaolin solution method and the antimicrobial susceptibility testing (AST) was screened using disk diffusion method. Two sets of mutations were conducted in this study. In the first mutation the changes were directed in the loop region and the first !-helix of the MO2.1 gene sequence. In the second mutation the changes were inducted in the loop region between the first and second helices and also in the beginning of the second helix. From each mutated protein 50% of the colonies were subcultured and screened for antimicrobial and coagulation test. Both mutagenesis libraries showed coagulation and antimicrobial activity. The results revealed that 76% of the screened colonies from mutation 1 and 95% of the screened colonies from mutation 2 had coagulation activity. The results from antimicrobial test showed that 54% and 57% of the screened colonies from mutation 1 were effective against gram negative Pseudomonas and gram positive Bacillus Subtilis respectively. 70% of the screened colonies from mutation 2 showed antimicrobial activity against Pseudomonas while 97% showed activity against B. subtilis. Based on these results mutation 2 has shown a stronger activity compared to mutation 1. One probability is that the region where changes for mutation 2 were applied in is a critical region for the MO2.1 protein activity.
In this study we have shown that it is possible to enhance the coagulation and antimicrobial activity of the MO2.1 protein by mutagenesis for use in water treatment. Keywords: Moringa Oleifera, water treatment, site-directed mutagenesis PCR,
Coagulation activity, antimicrobial susceptibility testing.
Table of Contents
1.! Introduction ... 5!
2.! Materials and Methods ... 7!
2.1.! Bioinformatics ... 8! 2.1.1.! Primers ... 9! 2.2.! Inoculation Procedure ... 12! 2.3.! Plasmid Isolation ... 12! 2.4.! Site-Directed Mutagenesis ... 12! 2.4.1.! MUT1-MO2.1 ... 13! 2.4.2.! MUT2-MO2.1 ... 13! 2.4.3.! Mutagenesis PCR ... 14! 2.5.! Blue/White Screening ... 16! 2.6.! Subculture of Colonies ... 17! 2.7.! Protein Isolation ... 17!
2.8.! Protein Concentration Using Bradford Assay ... 17!
2.9.! Protein Activity ... 18!
2.9.1.! Coagulation Activity Using Clay Solution ... 18!
2.9.2.! Antimicrobial Activity ... 19!
2.9.3.! Disc Diffusion Method ... 19!
3.! Results and Discussion ... 20!
3.1.! Bioinformatics ... 21!
3.2.! Mutagenesis PCR ... 22!
3.3.! Coagulation Activity ... 25!
3.3.1.! MUT1-MO2.1 ... 25!
3.4.! Antimicrobial activity ... 26!
3.4.1.! Disk Diffusion Method ... 26!
3.5.! MIC ... 31! 3.6.! Protein Concentration ... 32! 3.7.! Kinetics ... 35! 3.7.1.! MUT1-MO2.1: ... 35! 3.7.2.! MUT2-MO2.1 ... 37! 4.! Conclusions ... 38! 5.! Acknowledgement ... 38! 6.! References ... 39!
7.1.! Substrates Composition ... Error! Bookmark not defined.! 7.1.1.! TE Buffer (Lysis Buffer) ... Error! Bookmark not defined.! 7.2.! 500 ml LB for Kanamycin Agar Plates ... Error! Bookmark not defined.! 7.3.! 500 ml NB (Nutrient Broth) ... Error! Bookmark not defined.! 7.4.! NZY+ Broth for Mutagenesis Reaction: ... Error! Bookmark not defined.! 7.5.! Primers ... Error! Bookmark not defined.! 7.6.! PCR Mutagenesis 1 ... Error! Bookmark not defined.! 7.6.1.! Protein Concentration ... Error! Bookmark not defined.! 7.6.2.! Coagulation Activity ... Error! Bookmark not defined.! 7.6.3.! Antimicrobial Activity ... Error! Bookmark not defined.! 7.6.4.! Disk Diffusion ... Error! Bookmark not defined.! 7.7.! PCR Mutagenesis 2 ... Error! Bookmark not defined.! 7.7.1.! Protein Concentration ... Error! Bookmark not defined.! 7.7.2.! Coagulation Activity ... Error! Bookmark not defined.! 7.7.3.! Antimicrobial Activity ... Error! Bookmark not defined.! !
1. Introduction
The seed of the tropical plant Moringa oleifera contains a small protein with an excellent antimicrobial and coagulation activity. This protein named as MO2.1 is about 6.5 KDa in size and is constructed of 60 amino acids. The MO2.1 protein has been traditionally used in household for treatment of drinking water in some developing countries [1]. As it is the aim of this project the ideal is to enhance the both activities of the protein through mutagenesis thus making it a more efficient coagulant for use in water treatment. Further one known drawback with using MO2.1 in water treatment is that some organic matters of the protein will still be left in the water after the treatment. One possible way to solve this problem or at least reduce it would be to find regions in the gene sequence of the protein responsible for the activity and based on that, making shorter peptides containing only the active parts of the sequence for use in water treatment. In this way the amount of the organic matters left in water will be reduced. Although in the present work the size of the protein was not altered but the site-directed mutagenesis was performed to find out whether it is possible to enhance the coagulation and antimicrobial activity of the protein. And by screening the mutated colonies and study the results find out which part of the sequence is more likely to be responsible for the activity.
In today’s world at 21th century one of the most basic human rights should be their access to pure drinking water. However the expensive and multistep procedure of water treatment including coagulation, flocculation, sedimentation, filtration, disinfection, and storage makes it economically unfavorable or even impossible to acquire pure drinking water in some developing countries [2].
The coagulation and flocculation parts of the water treatment are critical steps, since the type of the coagulant, the costs of it, and the amount needed, have a direct influence on the successive steps in the treatment process. There are many different coagulants being used in water treatment. These coagulants can be categorized in three main groups of either organic polymers such as 1) polyacrylamide derivatives ((C3H5NO)n)1, and
polyethylene imine (PEI) (C2H5N)2; 2) inorganic coagulants e.g., aluminum sulfate
(Al2(SO4)3), ferric sulfate (Fe2(SO4)3 and polyaluminium chloride (Aln(OH)mCl3n-m)3; and
3) natural coagulants such as chitosan and microbial coagulants [3, 4].
Among these chemicals, the aluminum sulfate and ferric sulfate, labeled as alum and ferric respectively are currently the most common coagulants used in water treatment. However aluminum in drinking water has been pointed out as one of the possible causes for the neuro-degenerative diseases such as Alzheimer’s disease [5], further some of the synthetic polymers e.g., acrylamide have been reported to have both carcinogenic and neurotoxicity effects. Therefore the use of these types of coagulants is not desired in water treatment [4, 6, 7, 8].
It is also due to relatively high expense and inadequate access to these chemicals that researchers have been considering the urgent need of finding a suitable and harmless replacement for these coagulants, with rather low cost and high efficacy [3]. One potential solution is the replacement of these chemicals with natural coagulants such as
!!!!!!!!!!!!!!!!!!!!!!!!!!!!!!!!!!!!!!!!!!!!!!!!!!!!!!!!!!!!!
!"http://en.wikipedia.org/wiki/Polyacrylamide 2 http://www.chembase.com/cbid_9033.htm
plants and herbs [1]. There are some reasons that make natural coagulant better candidates in water treatment. For instance in contrast to chemicals, natural coagulant are biodegradable, they are cheaper in price and have not yet shown to have any severe side effects. One of these natural coagulants is the small seed protein MO2.1 which over the past two decades has come more into attention due to its nutritional and medicinal properties as well as its useful nature as a non-food product [6, 9]. Although as mentioned before one drawback with using the MO2.1 protein in water treatment is the dwelling of organic matters from MO.2.1 in the water but recently Chuka Okoli defended his PhD degree have presented in his doctoral thesis that using nanoparticles can be a solution for this problem. He shows in his work that using superparamagnetic iron oxide nanoparticles (SPION) coated with the protein MO2.1 can efficiently be used in treatment of turbid water (Okoli, 2012).
In this study the purified crude extracts of mutated M. oleifera seeds showed to have both antimicrobial and coagulation activity.
Generally coagulants function through charge neutralization of the particles in the water. As the particles in water causing turbidity are negatively charged and the coagulants have positive charge, they will interact with each other and form particle flocs which will settle down under gravity and consequently water with lower turbidity will be achieved. [3]. For the Moringa oleifera Coagulant Protein (MOCP) studies have shown that coagulant nature of this protein is associated with its overall positive charge which is due to the existence of water-soluble cationic amino acid residues in the peptide sequence [2]. In one study it has been suggested that the antimicrobial activity of MO2.1 may be related to a motif of the peptide compiled of two amphipathic !-helices separated by a hydrophobic loop where the occurrence of hydrophobic proline residues in the loop has been reported to play an important role in the improvement of the antimicrobial activity [10]. The mode of action for amphipathic !-helices is basically through two main mechanisms: 1) they can either permeate the transmembrane of the bacteria through transmembrane pore formation (barrel-stave model) where the !-helices interact with the lipid core of the membrane through their hydrophobic surface thus the hydrophilic region, points out and leads to the pore formation in the membrane. 2) The carpet-like mechanism in which the !-helices bind to the surface of the bacterial membrane and cover it like a carpet. This mechanism is initially based on the electrostatic interaction of the positively charged amino acids on the amphiphatic !-helices with the negatively charged phospholipids on the surface of the bacterial membrane. This interaction leads to rotation thus reorientation of the hydrophobic residues toward the hydrophobic core of the membrane hence destruction of the membrane [11].
Studies have shown that synthetic peptides designed based on different models such as (LLKK)3, KLKLLLLLKLK-NH2; or (HCCHHCHHCCn) (C=Charged; H=Hydrophobic),
shows good antimicrobial activity, why one of the sources for sequence alteration in this study was synthetic antimicrobial peptides [12, 13, 14].
Although different antimicrobial peptides (AMPs) have shown to have varying mode of action and are specific for different types of targets [15, 16] yet they have at least two mutual characteristics, one is the present of a net positive charge which leads to an electrostatic interaction between AMP and negatively charged phospholipids on the surface of the gram positive bacteria or with the lipopolysaccharides (LPS) on the outer
membrane of the gram negative bacteria. The other property is their capacity of presuming an amphiphilic structure which provides their interaction with the cellular membranes [10, 17].
In previous studies Broin et al. (2002), Suarez et al. (2003 & 2005) it has been reported that both recombinant and synthetic form of the MO2.1 have shown coagulation and antimicrobial activity [2, 10, 18]. The 3D structure of protein is a crucial element in deciding the proteins function. Formerly a 3D structure of MO2.1 based on 71% homology modeling of MO2.1 with Napin was suggested by Suarez et al. (2005). Recently a 3D structure for MO2.1 has been obtained by Okoli et al. (2012). This model is based on homology modeling of MO2.1 with Mabinlin II protein which shows 97% homology and therefore is the most accurate model available (Chuka Okoli).
Base on abovementioned information there are two main factors that are essential for the improvement of both coagulation and antimicrobial activities of MO2.1 protein; the frequency of positive charge residues in the peptide sequence and the hydrophobicity strength. Therefore an attempt to enhance these two activities was made through substitution of both positively charged and hydrophobic residues on specific sites in the sequence of MO2.1 using site-directed mutagenesis. In order to evaluate the recombinant products, the coagulation activity was checked using clay solution and the antimicrobial activity was tested by MIC (Minimum Inhibitory Concentration) and disk diffusion method. In following sections the methodology and results are being discussed.
2. Materials and Methods
In the first step bioinformatic tools were used to study the homology and sequence identity of MO2.1 through multiple alignments of this protein with other proteins available in PDBs, and thereby deciding for the changes to be applied in the sequence of MO2.1.
The MO2.1 gene from the Moringa oleifera seed DNA was purified and cloned into the pET200/D-TOPO cloning vector. The TOPO plasmid containing the MO2.1 gene was then transferred into the BL21 StarTM(DE3) competent E. coli cells (expression vector) and stored at -80 °C.4 Before freezing the antibiotic Kanamycin (100"g/"l) was added to
each sample to a final concentration of (50"g/"l).
The MO2.1-plasmids were first purified from E. coli cells using (QIAprep Spin Miniprep Kit and a Microcentrifuge) from QIAGEN5. Touch-down PCR followed by gel electrophoresis was performed to confirm that the TOPO plasmids contain the gene for MO2.1.After this verification the mutagenesis PCR from Agilent Technologies6 was applied to make recombinant MO2.1. A total of 5 primers were designed containing the
!!!!!!!!!!!!!!!!!!!!!!!!!!!!!!!!!!!!!!!!!!!!!!!!!!!!!!!!!!!!!
4 This part of the work was formerly performed by Dr. Pavankumar Asalapuram Ramachan. 5 http://www.qiagen.com/default.aspx
desired mutations. Two types of recombinant MO2.1 were designed; where the 3 first primers were employed to make the first recombinant MO2.1 in this paper referred to as MUT1-MO2.1. The other 2 primers were utilized for amplification of the second recombinant MO2.1 mentioned as MUT2-MO2.1.
As it has formerly been explained the antimicrobial and the coagulation activity of the MO2.1 protein depend on the positively charged and hydrophobic residues of the protein. Additionally, glutamine residues have shown to have an important role in improvement of coagulation activity of MO2.1 in association with the positively charged residues [10]. With this knowledge, in order to enhance both antimicrobial and coagulation activity of the MO2.1 protein the overall positive charge of the protein was amplified through substitution of more positively charged arginine (R) residues. Glutamine (Q) residues were substituted as they have been reported (Suarez et al.) to improve the coagulation activity of the peptide, specifically in addition with positively charged residues [10]. Finally the hydrophobic strength of the MO2.1 was enhanced through replacement of some amino acids with the hydrophobic proline (P) and leucine (L) residues. The amino acid leucine was chosen to be substituted into the !-helix as it is reported to improve the !-helical signature [21, 13] and also it enhances the hydrophobic strength of the peptide.
2.1. Bioinformatics
The Bioinformatic field is one of the most developing fields in today’s biotechnology’s world. A number of different online DNA and protein alignment tools and databases provided by biotechnical institutions such as Uniprot (Universal Protein Resource), NCBI (National Center for Biotechnology Information) and EBI (European Bioinformatic Institute) expands the opportunities for a more reliable and less labouring research. As for this study, in order to study the homology of the MO2.1 protein and studying its sequence identity with other proteins available in online protein databases bioinformatic tools such as Fasta, Blast, and Jalview was used.
The tertiary structure of a protein is a crucial element in determination and localization of the function of the protein [21]. However at the time this work was carried out no actual tertiary structure was yet available for MO2.1. Therefore in order to study the homology
of MO2.1 with other AMPs the MO2.1 protein sequence
(QGPGRQPDFQRCGQQLRNISPPQRCPSLRQAVQLTHQQQGQVGPQQVRQMYRV ASNIPST) was first aligned against PDBs (Protein Data Banks) available in Uniprot protein database using BLAST (Basic Local Alignment Search Tool). Based on the results from blast, the MO2.1 protein (Uniprot ID: 24303), was multiple aligned with Mabinlin-1, Napin, and 2s albumin.
2.1.1. Primers
In order to direct the mutagenesis PCR, a total of 5 mutagenic primers were designed manually in accord with the instructions in the Instruction Manual for mutagenesis PCR7. The primers were synthesised at Eurofins MWG Operons.8
Using multi site-direction mutagenesis made it possible to employ up to 3 primers in each reaction while each of the primers could contain up to 5 different mismatches. The Table 1 shows the map for all positions and numbers in both DNA and protein sequence where mismatches have been directed for both MUT1-MO2.1 and MUT2-MO2.1.
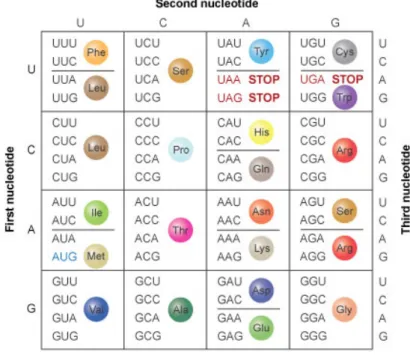
Figure 1. Map for amino acid codons9
An example will be taken here to offer more clarification of the mutation map in Table 1. For instance looking closely at Table 1!""#"$%&'('"')*'%+#,"*'%)#-%(#,)./ you will see that for the mutation number 1, in order to change the glycine (G) residue to proline (P) two nucleotides need to be changed in the DNA sequence of MO2.1.
As it is shown in Figure 2 and Table 1 the amino acid glycine is at the fourth position in the peptide sequence and the three-letter code corresponding to it is in the position between nucleotides 10-12 in the DNA sequence. Since different amino acids may have different sets of three-letter code coding for them, the map for amino acid codons (Figure 1) was used to choose those codons which are closer to the ones they are to be replaced with. In this way a fewer number of mismatches is required for the mutation to occur. For
!!!!!!!!!!!!!!!!!!!!!!!!!!!!!!!!!!!!!!!!!!!!!!!!!!!!!!!!!!!!!
7 http://www.chem.agilent.com/Library/usermanuals/Public/200513.pdf 8 http://www.eurofinsdna.com/home.html
this example the codon CCT coding for proline was chosen to replace the G by P, and there were only 2 mismatches needed to direct this mutation, since the third letter in the codon is already the same.
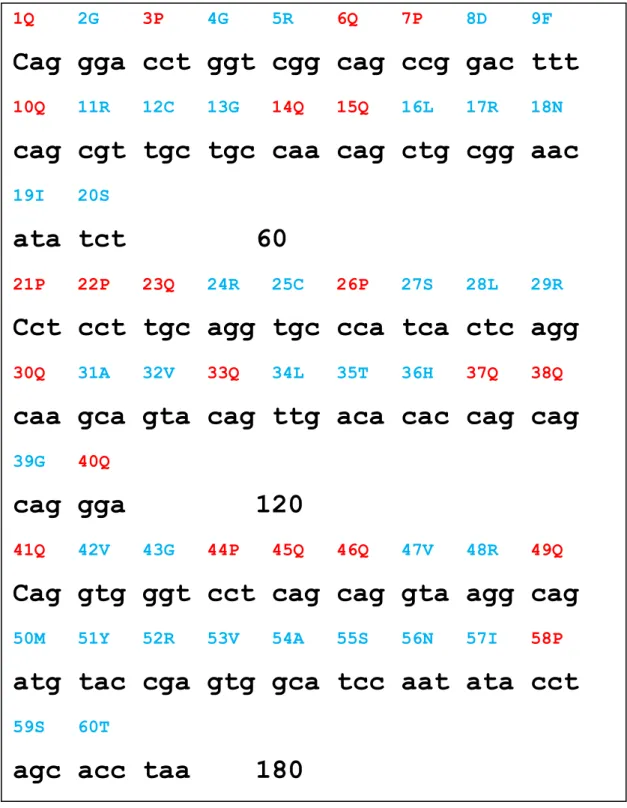
Figure 2. The protein and DNA sequence of MO2.1
1Q 2G 3P 4G 5R 6Q 7P 8D 9F
Cag gga cct ggt cgg cag ccg gac ttt
10Q 11R 12C 13G 14Q 15Q 16L 17R 18N
cag cgt tgc tgc caa cag ctg cgg aac
19I 20Sata tct 60
21P 22P 23Q 24R 25C 26P 27S 28L 29R
Cct cct tgc agg tgc cca tca ctc agg
30Q 31A 32V 33Q 34L 35T 36H 37Q 38Q
caa gca gta cag ttg aca cac cag cag
39G 40Q
cag gga 120
41Q 42V 43G 44P 45Q 46Q 47V 48R 49Q
Cag gtg ggt cct cag cag gta agg cag
50M 51Y 52R 53V 54A 55S 56N 57I 58P
atg tac cga gtg gca tcc aat ata cct
59S 60TTable 1. The mutation map for MUT1-MO2.1 and MUT2-MO2.1 Nr. of mutat ions aa position aa
change(from!to) Position of Nts Mutation
Nr of mismatches 1 4 G – P 10,11 GGT – CCT 2 Helix 2 8 D – L 22,23 GAC – CTC 2 3 12 C – L 34,35 TGC – CTC 2 4 13 C – L 37,38 TGC – CTC 2 Loop 5 17 R – P 50 CGG – CCG 1 6 18 N – P 52, 53 AAC – CCC 2 7 19 I – Q 55,56 ATA – CAA 2 8 20 S – Q 58, 59,60 TCT – CAA 3 Helix 9 26 P – R 77 CCG – CGG 1 10 27 S – R 79, 80 TCA – AGA 2 Total 19
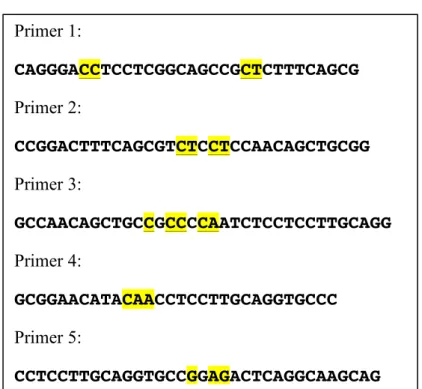
The following 5 primers were used for site-directed mutation of MUT1-MO2.1 and MUT2-MO2.1 (!""#"$%&'('"')*'%+#,"*'%)#-%(#,)./Error! Reference source not found.).
Figure 3. The sequence of 5 primers. The first 3 primers were used for production of MUT1-MO2.1 and the last two for site-directed mutagenesis of MUT2-MUT1-MO2.1.
Primer 1: CAGGGACCTCCTCGGCAGCCGCTCTTTCAGCG Primer 2: CCGGACTTTCAGCGTCTCCTCCAACAGCTGCGG Primer 3: GCCAACAGCTGCCGCCCCAATCTCCTCCTTGCAGG Primer 4: GCGGAACATACAACCTCCTTGCAGGTGCCC Primer 5: CCTCCTTGCAGGTGCCGGAGACTCAGGCAAGCAG
2.2. Inoculation Procedure
In order to make fresh culture of the E. coli cells containing TOPO-MO2.1, a volume of 200 "l of the cell culture was added to a total volume of 5 ml LB medium (Lysogeny Broth) ( See !""#"$%&'('"')*'%+#,"*'%)#-%(#,)./ Error! Reference source not found.) in a 15 mL falcon tube. The antibiotic Kanamycin (100 "g/"l) was added to a final volume of 50 ("g/ml). Since the TOPO plasmids contain the Kanamycin resistance gene the antibiotic Kanamycin is used to provide a safe growth for these TOPO containing E. coli cells by inhibiting any other bacterial growth. The medium was then incubated at 37 °C for <16 hours.
2.3. Plasmid Isolation
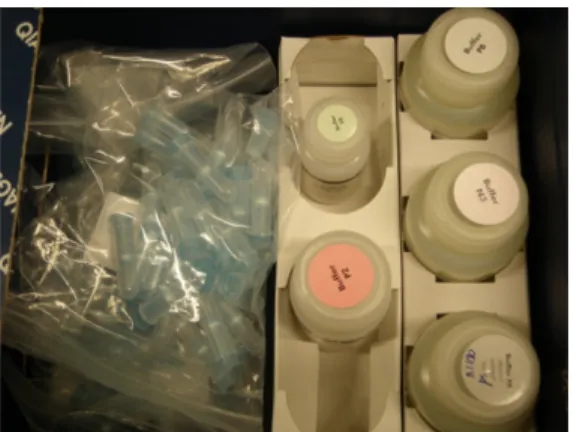
For this step the QIAprep Spin Miniprep Kit from QIAGEN Figure 4, was applied.10 The fresh culture from previous step was transferred in 2#1.5 ml eppendorf tubes and centrifuged at 7000 rpm for 5 minutes in a table microcentrifuge. The supernatant was discarded and the remaining pellet bacterial cells were suspended in 250 "l Buffer P1 (provided with the kit). 250 "l of the Buffer P2 was added and mixed thoroughly by inverting the tubes 4-6 times. Next 350 "l of Buffer N3 was added and mixed immediately and thoroughly by inverting the tubes 4-6 times. The tubes were then centrifuged at 13000 rpm for 10 minutes in a table microcentrifuge. The supernatant from this step was applied to the QIAprep spin column (provided with the kit) by pipetting and centrifuged for 60 seconds. The flow-through was discarded and the QIAprep spin column was washed with 0.5 ml of Buffer PB and centrifuged for 60 s. The flow-through from this step was discarded. The QIAprep spin column was then washed again this time with 0.75 ml Buffer PE and centrifuged for 60 s. The flow-though was discarded and the tubes were centrifuged for another 1 minutes to remove remaining wash buffer. For the DNA elution step the QIAprep spin columns were first placed in clean 1.5 ml eppendorf tubes. 50 "l Buffer EB was added to the center of each QIAprep spin column incubated for 1 minute at RT and centrifuged for 1 minute. The Flow-through containing the MO2.1 gene stored at -20 °C for future use [22].
2.4. Site-Directed Mutagenesis
Using site-directed mutagenesis (SDM) makes it possible to apply changes in form of insertion, deletion at desired sites in the DNA sequence. In addition multi site-directed mutagenesis expands the possibility to make more than one mismatch in one round of reaction [23].
!!!!!!!!!!!!!!!!!!!!!!!!!!!!!!!!!!!!!!!!!!!!!!!!!!!!!!!!!!!!!
Figure 4. QIAprep Spin Miniprep Kit from QIAGEN
2.4.1. MUT1-MO2.1
In the first recombinant MO2.1 the general primary structure (XXYY)n which has
previously been applied for synthetic antimicrobial peptides was chosen for alteration of the first !-helix in the MO2.1 peptide. The X in the formula represents the hydrophobic residues, Y represents the positive charged residues, and the n is the number of repeats which can be between 2 to 4. Antimicrobial peptides containing !-helix with this set of repeats have shown inhibitory effects against both gram positive bacteria and yeasts [13]. This pattern has shown to have the best activity when the number of repeats are n = 3 [13] however in this study in order to avoid conformational changes as much as possible the number of repeats was decided to be n = 2.
As it was reported by (Suarez et al.) the MO2.1 protein have shown an increased antimicrobial activity in the part of the sequence where two proline residues are next to each other in the loop between !-helix 1 and 2. With this presuppose that the addition of more hydrophobic residues may improve the bactericidal activity of the protein, more hydrophobic proline (P) and leucine (L) residues were added to the part of the sequence that showed best bactericidal activity according to the results obtained in previous studies by other groups [10].
2.4.2. MUT2-MO2.1
In the second set of mutations, the amino acid serine (S), right before the two proline residues which have previously been reported to have an impact on the antimicrobial activity of MO2.1 was replaced with a glutamine residue which improves the coagulation activity. This was done to investigate whether it would change the antimicrobial activity for better or worse. Next, the first two residues in the second !-helix (H2), was replaced with positively charged arginine (R). Although the proline residue in the beginning of the helix does not affect the conformation of the helix [21] but since it is known to be a poor helix former it was preferably replaced with an arginine. The amino acid serine (s) is also
among those residues which are poor in !-helix formation [21] hence was replaced with arginine. The latter amino acids were both replaced with arginine residue with the expectation of inducing a higher coagulation activity into the protein by having to positive charges next to each other.
2.4.3. Mutagenesis PCR
Site-directed mutagenesis PCR was used to apply mutations into the DNA sequence of MO2.1. The QuickChange Multi Site-Directed Mutagenesis Kit was supplied from Agilent Technologies and the structures were followed as explained in Instruction Manual11. As it has been reported by (Lei Zheng et al.), QuikChange site-directed mutagenesis is a very efficient method for PCR amplification. This method reduces the chances for dimerization and self-annealing of primers with the restriction that the primers should be within the size distribution of 25-45 bases in length and the melting temperature (Tm) $ 75 °C [19].
Materials needed:
! 14 ml BD Falcon polypropylene round-bottom tubes
! 5-Bromo-4-chloro-3-indolyl-ß-D-galactopyranoside (X-gal) ! Isopropyl-1-thio-ß-D-galactopyranoside (IPTG)
The Plasmid isolated was performed using the QIAprep Spin Miniprep Kit. The mutant strand synthesis reaction for thermal cycling was prepared as indicated in Table 2.
Table 2. The PCR mixture for mutant strand synthesis reaction
Reaction Component Templates >5 kb
10# QuikChange Multi reaction buffer 2.5 µl
double-distilled H20 13.75 µl to final volume of 25 µl
QuikSolution 0–0.75 µl (titrate for each template)
ds-DNA template 3 µl (100 ng)
mutagenic primers 3 µl (100 ng each primer for 1–3 primers
dNTP mix 1 µl
!!!!!!!!!!!!!!!!!!!!!!!!!!!!!!!!!!!!!!!!!!!!!!!!!!!!!!!!!!!!!
11 The list of materials provided with the kit is available in !""#"$%&'('"')*'%+#,"*'%)#-%(#,)./, !""#"$%
Reaction Component Templates >5 kb
QuikChange Multi enzyme blend 1 µl
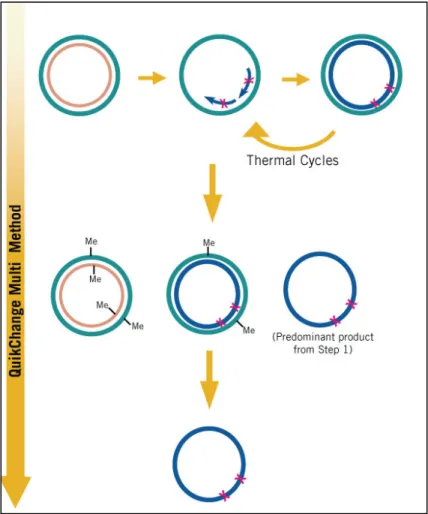
The procedure for site-directed mutagenesis PCR was carried out in 3 main steps illustrated in Figure 5. The following procedure was performed for production of both MUT1-MO2.1 and MUT2-MO2.1.
1) The synthesis of the mutant strand which was performed in 2 hours and consisted of three steps.
a. Denaturing ds-DNA template at 95 ºC. b. Annealing of the mutant primers at 55 ºC.
c. Extend of the mutant primers and ligation of the nicks with the QuickChange Multi enzyme blend at 72 ºC.
2) The template was then digested using the enzyme Dpn l. This enzyme digests the methylated and hemimethylated DNA.
3) The mutated DNA was transformed into XL10 Gold Ultracompetent cells.
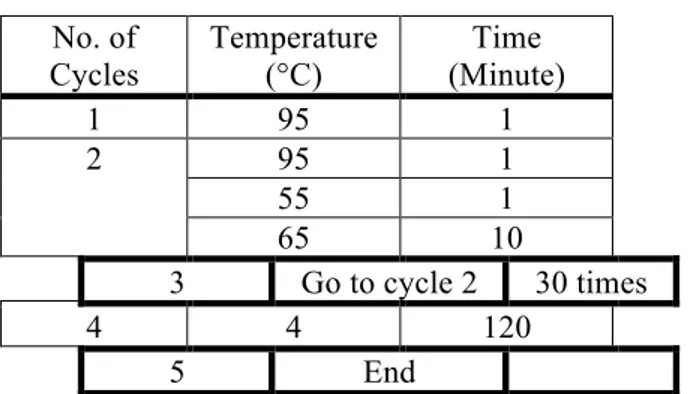
The thermal cycling was performed according to the program shown in Table 3!""#"$% &'('"')*'%+#,"*'%)#-%(#,)./.
Table 3. The thermal cycling for mutagenesis PCR No. of Cycles Temperature (°C) Time (Minute) 1 95 1 2 95 1 55 1 65 10 3 Go to cycle 2 30 times 4 4 120 5 End
As it is shown in Figure 5 the whole TOPO plasmid containing the gene for MO2.1 was amplified through mutagenesis PCR using only one side forward primers. After the reaction was completed the methylated templates were digested by the Dpn I enzyme. For this step 1 "l of Dpn I restriction enzyme (10 U/"l) was added to each PCR tube using small pointed pipet tip. Each reaction was then mixed gently and thoroughly by pipetting the solution up and down several times. The reactions were centrifuged for 1 minute and immediately incubated in 37°C for 1 hour to digest nonmutated ds-DNA. For Transformation of mutant DNA into XL10-Gold Ultracompetent Cells, the XL10-Gold Ultracompetent cells were taken out from -80 and thawed gently on ice. 45 "l of the ultracompetent cells were transferred into 2 ml eppendorf polypropylene round-bottom tubes. For each mutagenesis reaction, 2 "l of the %-ME mix was added to the 45 "l of cells. The content of the tube was swirled gently and incubated on ice for 10 minutes
while swirling gently every 2 minutes. 1.5 "l of the Dnp I-treated DNA from each mutagenesis reaction was transferred to each aliquot of the ultracompenet cells. The transformation reaction was swirled gently and incubated on ice for 30 minutes. The NZY+ broth was preheated in 42°C water bath for use in step 9. The reaction tubes were then heat-pulsed in a 42°C for 30 seconds and incubate on ice for 2 minutes. 0.5 ml of preheated NZY+ broth was added to each tube and incubated at 37°C for 1 h with shaking at 225-250 rpm. 3 different volumes (1, 10, 100 ("l)) of each transformation reaction, was placed on agar plate containing antibiotic Kanamycin. The transformation plates were incubated in 37°C for < 16 h.
Figure 5. The QuikChange Multi Site-Directed Mutagenesis method12
2.5. Blue/White Screening
Blue/white screening is a common method used for screening and confirmation of a successful cloning. The principle of this method is based on the fact that in TOPO plasmids the cloning site is located on the lacZ gene. This gene can be used as a reporter gene in a sense that if the target DNA (in this case recombinant MO2.1) is successfully inserted into this site where lacZ gene is located the expression of this gene is then
!!!!!!!!!!!!!!!!!!!!!!!!!!!!!!!!!!!!!!!!!!!!!!!!!!!!!!!!!!!!!
disrupted. As a result when the host cells containing clone-plasmid are spread on the agar plate containing the inducer isopropyl-%-D-thiogalactoside (IPTG) and the artificial substrate 5-bromo-4-chloro-3-indoxyl-%-D-galactopyranoside (X-gal) (used as a colorimetric substrate) there will only be white colonies appearing on the agar plate. However if the cloning has failed the lacZ gene will be expressed hence the %-galactosidase is produced which in presence of the IPTG will metabolize the X-gal to produce a blue colour. In latter case the bacteria colonies containing only the plasmid will appear in blue colour [25].
2.6. Subculture of Colonies
For further studies of MUT1-MO2.1 and MUT2-MO2.1 a total of 100 and 60 white colonies (50%) from each of the two mutant plates respectively were subcultured on Kanamycin LB agar plate (Figure 13). The colonies were chosen from the plate which had a volume of 10 "l of cloned cells loaded on. The plates were incubated at 37 °C for <20 hours and stored at 4 °C for future use.
2.7. Protein Isolation
A volume of 5 ml fresh overnight cultures made from each subcultured colony (see Inoculation Procedure). Each culture was then transferred into 2#1.5 ml eppendorf tubes and centrifuged at 7000 rpm for 5 minutes in a table microcentrifuge. The supernatant was discarded and the pellet was resuspended in 1ml lysis buffer 1#TE buffer (pH=8.4) (!""#"$% &'('"')*'% +#,"*'% )#-% (#,)./, Error! Reference source not found.), and 5 "l lysozyme (50 "g/"l). The cells were lysed by gently pipetting in and out, incubated in a heat bath at 100 °C for 3 minutes and kept at RT for 15 minutes. The samples were then centrifuged at 13000 rpm for 10 minutes and the supernatant containing crude extract of recombinant MO2.1 was collected and stored at 20 °C for future use.
2.8. Protein Concentration Using Bradford Assay
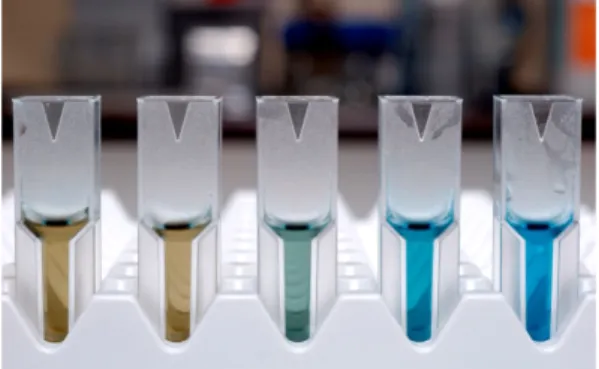
After isolation of the protein the conventional Bradford assay was used for quantification of protein content in each sample. The Bradford assay is a simple and accurate method for estimation of protein concentration in a sample with unknown protein concentration. The method is based on the binding of the dye Coomassie Brilliant Blue G-250 to the protein in the sample. The coomassie dye in cationic form in red and green colour (Figure 6) has an absorbance maximum at 470 - 650 nm respectively. The blue coloured anionic form of the dye (Figure 6) has a maximum absorbance at 595 nm which is when it bonds to the protein. Therefore an absorbance measurement at 595 nm reveals the quantity of the protein-bonded Coomassie Blue which is proportional to the amount of the protein in
the sample. The Bradford assay used in this study was acquired from Bio-Rad13. Bovine serum albumin (BSA) (1mg/ml) was used in the concentrations of 2, 4, 6, 8, and 10 ("l) as the standard (!""#"$%&'('"')*'%+#,"*'%)#-%(#,)./ Error! Reference source not found.). For each sample a volume of 5 "l of the protein sample Error! Reference source not found.) was transferred into a 1 ml polystyrene cuvette (10#4#45mm), 200 "l of Bradford reagent was added to each cuvette and the volume was adjusted to 1 ml by distilled water. The content of the cuvette was then mixed gently in order to homogenize the reaction mixture and kept at room temperature for 5 minutes. The absorbance was measured at 595 nm using UV-Visible spectrophotometer. The unknown concentration of each sample was then calculated using the formula:
Abs = [C] # M The M is the slope of the BSA standard curve [26].
Figure 6. Bradford assay, the colorimetric of Coomassie Brilliant Blue dye14
2.9. Protein Activity
2.9.1. Coagulation Activity Using Clay Solution
In order to measure the coagulation activity of the recombinant MO2.1 protein, turbid water was made artificially using kaolin. 1% kaolin solution was prepared though suspension of 5 gram Kaolin powder in 500 ml of tap water and stirred on a magnetic stirrer for 30 minutes up to 1hour (h) and kept at room temperature (RT) for 24h for complete hydration of kaolin particles in the water. The absorbance of the clay solution was then measured by a UV-visible spectrophotometer at 500nm (OD500)15 and if
necessary optimized to OD =1 - 1.2 through addition of more hydrated kaolin in case the OD was below the mentioned value or by keeping the solution untouched for a few hours to let the clay particles settle down and decanting the supernatant again in case the OD
!!!!!!!!!!!!!!!!!!!!!!!!!!!!!!!!!!!!!!!!!!!!!!!!!!!!!!!!!!!!!
13 http://labs.fhcrc.org/fero/Protocols/BioRad_Bradford.pdf 14 http://www.eiroforum.org/media/photo_galleries/embl/index.html 15 OD=Optical density measured at 500 nm.
was above the mentioned value. The supernatant was then poured into a new glass container by decanting and kept at RT for future consumption [27].
1% clay solution was used as turbid water to measure the coagulation activity. 990"l of the kaolin solution was pipette directly into the polystyrene cuvettes (10#4#45mm), and 10"l of each isolated recombinant MO2.1 protein sample was added separately to each cuvette to the final volume of 1 ml. A set of 10 samples were tested at each time. The OD- value for each sample was then measured by spectrophotometer once immediately after mixture of the protein with the clay solution and was mentioned as initial OD-value, once after 60 minutes and once after 90 minutes. The formula below was used to calculate the coagulation activity (%) for each sample between the times (0-60min) and (0-90min) [27, 28].
!"#$%&#'(")!!"#$%$#&!!!! !!"#$#%&!!"!!"#$% ! !"#$%!!"!!"#$% !"#$#%&!!"!!"#$% !!""
2.9.2. Antimicrobial Activity
In this study two methods were used for investigation of the antimicrobial activity of the recombinant protein. For MUT1-MO2.1, the coagulation activity was first measured on all 100 samples. In order to discover whether there is a connection between the two activities those samples which showed better coagulation activity (over 60%) were chosen for testing the antimicrobial activity using disk diffusion method. Further these results were confirmed by MIC (minimum inhibitory concentration) test in microtitre plates.
2.9.2.1. Minimum Inhibitory Concentration (MIC)
The minimum inhibitory concentration test was performed on the gram positive Bacillus Subtilis and the gram negative Pseudomonas. The test was done in 96-wells in 3 three volumes of 2, 5, and 10 "l of each protein sample. The assay for each protein sample was made in either duplications or triplications. The total test volume was 100 "l. The fresh overnight culture of each bacteria was diluted to OD600= 0.1 with NB (1:10). An
appropriate aliquot of the diluted bacterial culture was added to the wells and protein samples were transferred to each well to a final volume of 100 "l. The plate containing the samples was then incubated over the night in an absorbance plate reader (FLUOstar), under constant shaking at 37 °C. The optical density for each well was measured at 595nm (OD595) every 5 minutes for 12 hours. The results of the screening from each
volume were studied to determine the minimum inhibitory concentration of each recombinant protein [29].
2.9.3. Disc Diffusion Method
The disc diffusion method (Kirby-Bauer) was applied for the antimicrobial susceptibility testing. Disk diffusion is one of the most frequently used methods in microbiology laboratories due to its low cost and simplicity of performance. The effectiveness of this method in testing several different samples simultaneously is another reason for its popularity [30]. The disk diffusion method is based on the principle that when a filter paper disc is saturated with a substance and placed on an agar plate the substance will gradually diffuse into the agar. This method can be used for antimicrobial susceptibility testing in a sense that if the surface of the agar plate is spread with bacterial culture and the filter paper discs deposited on the surface of the agar are impregnated with antibiotics the diffusion area reveals in fact the strength of the antibiotic in inhibition of the bacterial growth [26]. The same principle was used in this study in order to determine the strength of different MO2.1 extracts in inhibition of bacterial growth for gram positive and gram negative bacteria.
Whatman filter paper was made in to small disks using a regular paper puncher. The disks were then autoclaved prior to use. Two types of bacteria one gram positive (G+) Bacillus Subtilis and one gram negative (G-) Pseudomonas aeruginosa was used in this experiment. Agar plates kept at room temperature 30 minutes before the application, 150 "l of each fresh bacterial culture was added to each NA agar plate and spread uniformly over the whole agar surface using glass Pasteur pipettes. The plates were stored at RT for about 1 hour before the disks were place on the agar plate using autoclaved pincetts. 6 disks were placed on each plate, and were saturated by a volume of 5"l MO2.1 isolated protein sample. The plated were incubated at 37°C for & 16h and the results were studied.
3. Results and Discussion
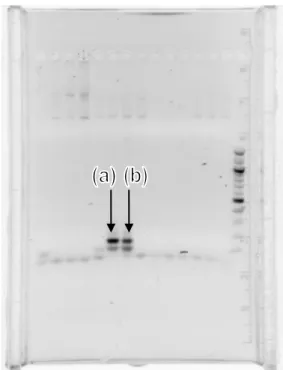
In order to confirm that the purified TOPO plasmids contain the gene for MO2.1, the gene was first amplified using touch-down PCR (Polymerase Chain Reaction) with forward/reverse primers specific for MO2.1 gene. The results were analysed using gel electrophoresis (Figure 7!""#"$%&'('"')*'%+#,"*'%)#-%(#,)./).
Figure 7. The arrows (a) and (b) point to the bands for MO2.1 PCR product.
3.1. Bioinformatics
In the results from Jalview shown in Figure 8 the conserved areas of the sequences are illustrated. Based on this alignment the MO2.1 protein showed the highest sequence identity of 46.77% with Mabinlin-1.
Figure 8. The Jalview over multiple alignment of MO2.1 with Mabinlin-1, Napin, and 2S_albumin; the conserve parts are illustrated.
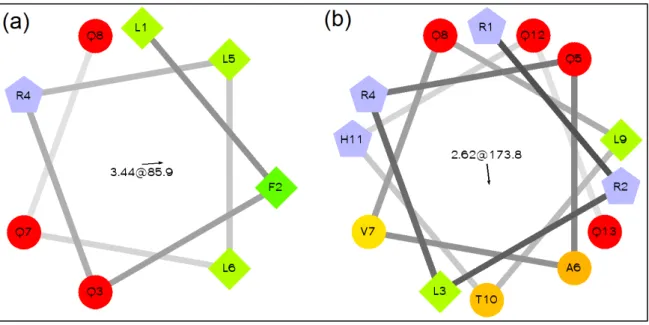
Figure 9, shows the amino acid distribution in a helical projection for the two first !-helices after the recombination.
Figure 9. Helical Wheel projection for the recombined !-helix 1(a) belongs to recombinant protein 1 and !-helix 2(b) belongs to recombinant protein 2.16
3.2. Mutagenesis PCR
Two sets of recombinant MO2.1 named as MUT1-MO2.1 and MUT2-MO2.1 have been made with the aim to improve both the coagulation and antimicrobial activity of the protein. The idea in this work was to perform each part of the experiment using simple, and low cost methods which will hopefully be applicable everywhere else.
The Site-Directed Mutagenesis (SDM) was the favoured choice for applying mutation in MO2.1 in this study. There are of course other possible choices such as random mutation for designing a recombinant protein, however in this study the site-directed mutagenesis was preferably chosen in order to apply the mutations on specific sites. In this way it is more likely to make mutations with predictable results. Further it is possible to avoid unwanted mutations in specific parts of the sequence, such as mutation of proline into the sequence of !-helices.
Four amino acid residues were totally chosen for substitution into the sequence of MO2.1. The hydrophobic proline (P) and leucine (L) residues were chosen for improvement of the bactericidal activity. The arginine (R) as a positively charged residue together with glutamine (Q), which have associatively shown to play a critical role in enhancement of the coagulation activity of MO2.1 [10].
Since the effect of proline residue in enhancing the bactericidal activity is already proofed, it was of more interest to add only proline residue as the hydrophobic residues. However the substitution of proline within the !-helices was avoided with respect to the
!!!!!!!!!!!!!!!!!!!!!!!!!!!!!!!!!!!!!!!!!!!!!!!!!!!!!!!!!!!!!
fact that proline is a very poor !-helix former [21]. Although proline can perfectly fit in the first turn of an !-helix but it may cause the formation of a significant bend anywhere else in an !-helix. This is because the side chain in proline is attached to the N atom in the main helical chain and forms a ring structure which causes steric hindrance in the !-helical conformation [21].
In other hand the appearance of proline in the loop area have been reported to improve the bactericidal activity of the protein [10]. Therefore in an attempt to intensify the hydrophobic strength within the loop area between !-helix 1 (H1) and 2 (H2), two more proline residues were substituted.
Glycine residue can have many different conformations in unfolded form of the protein which leads to the instability of the protein in its native form, while proline in other hand has much fewer conformations in unfolded structures due to its side chains fixation to the main chain through an extra covalent bond. Therefore replacement of glycine with proline may diminish the number of conformations hence increases the structure stability. However this mutation is only favourable if the change is applied in a position which does not affect the conformation of the folded structure and also does not affect the beneficial contacts with other side chains in neighbourhood [21].
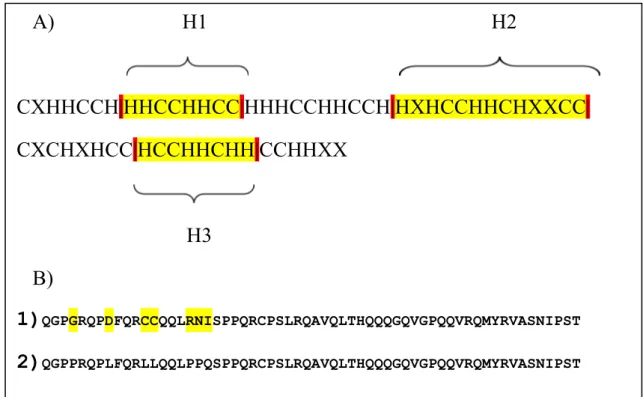
Figure 10. The recombinant MO2.1 sequence. A) The peptide sequence of MUT1-MO2.1 rewritten in form of Hydrophobic and charged amino acid residues. The letters in the picture stand for: C=charged amino acids, H= Hydrophobic amino acids, and X=uncharged, Polar, and non-polar amino acid residues. The yellow parts within the red lines define the 3 !-helices. B) The mutation pattern MUT1-MO2.1. The first line is the original peptide and the second line is the mutated MO2.1.
A)
H1 H2
CXHHCCH|HHCCHHCC|HHHCCHHCCH|HXHCCHHCHXXCC|
CXCHXHCC|HCCHHCHH|CCHHXX
H3
B)
1)
QGPGRQPDFQRCCQQLRNISPPQRCPSLRQAVQLTHQQQGQVGPQQVRQMYRVASNIPST2)
QGPPRQPLFQRLLQQLPPQSPPQRCPSLRQAVQLTHQQQGQVGPQQVRQMYRVASNIPSTLeucine was the choice for hydrophobic residue after proline since this residue have been commonly used in production of synthetic AMP in other studies, and have shown to have a good effect on the bactericidal activity in synthetic AMPs [12, 13]. Leucine is also among amino acids which favours the !-helix formation [21]. The Figure 10 and Figure 11 shows the changes applied in the protein sequence of MO2.1 after each mutation.
Figure 11. The recombinant MO2.1 sequence. A) The peptide sequence of MUT2-MO2.1 rewritten in form of Hydrophobic and charged amino acid residues. The letters in the picture stand for: C=charged amino acids, H= Hydrophobic amino acids, and X=uncharged, Polar, and non-polar amino acid residues. The yellow parts within the red lines define the 3 !-helices. B) The mutation pattern MUT2-MO2.1. The first line is the original peptide and the second line is the mutated MO2.1.
Figure 12 shows the blue/white screening for MUT1-MO2.1, the dots marked in blue shows the failed cloning while the rest of the colonies of about 200 appeared in white which represents those colonies that contained plasmid-MO2.1. In Figure 13 the subculturing of the mutated recombinant colonies is illustrated. These subcultures were then inoculated and used for the following steps of the experiment.
The results obtained from coagulation and antimicrobial activity test on the recombinant proteins revealed that MUT2-MO2.1 has a higher activity compared to MUT1-MO2.1. This is because the set of changes made in MUT2-MO2.1 favoured the protein activities. Another assumption is that the part of protein sequence altered in MUT2-MO2.1 has a higher impact on the proteins activity and can probably be used as a peptide comprising both activities.
A)
H1
H2
CXHXCCH|HHCCXXCC|HCXHCHHCCX|CCHCCHHCHXXCC|
CXCHXHCC|HCCHHCHH|CCHHXX
H3
B)
1)
QGPGRQPDFQRCCQQLRNISPPQRCPSLRQAVQLTHQQQGQVGPQQVRQMYRVASNIPST2)
QGPGRQPDFQRCCQQLRNIQPPQRCRRLRQAVQLTHQQQGQVGPQQVRQMYRVASNIPSTFigure 12. Blue/White screening for MUT1-MO2.1
Figure 13. Subcultured colonies
3.3. Coagulation Activity
3.3.1. MUT1-MO2.1
Figure 14!""#"$% &'('"')*'% +#,"*'% )#-% (#,)./ shows the coagulation activity for MUT1_MO2.1. Samples 1 (1.29 (mg/ml)), 2 (2.22 (mg/ml)), and 10 (1.88 (mg/ml)) show a very good coagulation activity. As it can be seen in the figure, the activity of sample 2 is close to one for the positive control (25) with a protein concentration of 3.85 (mg/ml), and higher than the positive (13) which has a concentration of 2.04(mg/ml). With respect to the fact that the protein sample 2 is a crude extract and the controls (25) & (13) are pure proteins, it can be declared that the recombinant protein in sample 2 is a stronger coagulant than the pure protein of MO2.1.
Worth mentioning that the MO2.1 protein has shown to have a better coagulation efficacy in an alkaline condition compared of that in an acidic environment [3]. In this study the recombinant protein samples were suspended in TE buffer with pH=8.4.
Figure 14. Coagulation activity for protein samples from MUT1-MO2.1
3.4. Antimicrobial activity
3.4.1. Disk Diffusion Method
Since the main idea in this study was to provide a simple procedure that is applicable for all; this method was to be preferred over other methods with the need of expensive automation. As mentioned before two types of bacteria, a gram positive,Bacillus Subtilis, and gram negativePseudomonas aeruginosa, were used to test the antimicrobial activity for the two types of the recombinant MO2.1 protein made in this study. The results revealed that both types of the recombinant MO2.1 proteins have antimicrobial activity against both gram positive and gram negative bacteria (Figure 15, Figure 16, Figure 17, Figure 18, and Figure 19). The inhibition concentration used in this study was 5 "l, as it is shown in Figure 15 a comparison between the positive control (pure MO2.1), and crude extract isolated from MUT1-MO2.1 shows that the inhibition zone for the positive is both more clear and larger than those for the recombinant proteins. This can be because the positive sample contains only pure MO2.1 protein, while the recombinant protein is in fact the crude extract containing other types of protein from the host cell as well. These
#$! %#$! &#$! '#$! (#$! )#$! *#$! +#$! ,#$! "#$! %##$! 0#12,314#)%1* 456-7%89: % ;"#-'6)%<1=>3'%
0#12,314#)%?*456-7%8@AB3:%
-#.*#/! -#."#/!proteins may interfere with the activity of recombinant MO2.1 and decline or even disrupt it.
A comparison of the antimicrobial strength between the MUT1-MO2.1 and MUT2-MO2.1 reveals that the changes made in MUT2-MUT2-MO2.1 had a better effect on the antimicrobial activity of the protein compared to those made in the MUT1-MO2.1. This might be due to the enhancement of the positive charge of the protein through addition of a double arginine residue in the beginning of the !-helix 2.
! Figure 15. Disk diffusion for MUT1-MO2.1 on Pseudomonas aeruginosa and Bacillus
Subtilis, a) and b) are the results against pseudomonas and c) shows the result against Bacillus. The colonies 58, and 60 are shown in a), colonies 80, 81, 82, and 83 are shown in
b), and colonies 95, and 96 are shown in c).
! Figure 16. Disk diffusion for MUT2-MO2.1 on Pseudomonas aeruginosa and Bacillus
Subtilis; a) and c) are the results against Bacillus and b) shows the result against pseudomonas. The colonies 27, 28, 29, 30, 31, and, 32 are shown in a), Colonies 51, 52, and,
53 are shown in b), and colonies 47, and 48 are illustrated in c). The positives and negatives are marked in the pictures.
The results from disk diffusion method for the both recombinant proteins, is illustrated in form of diagrams shown in Figure 17, Figure 18, and Figure 19. For simplicity and a better illusion two scales were defined as no respond or excellent corresponding to 0 and 10 respectively. The results revealed that totally 54% of the samples from MUT1-MO2.1
MUT2-MO2.1 was 70%. The antimicrobial activity of MUT1-MO2.1 against gram positive Bacillus was only 57% while 97% of samples from MUT2-MO2.1 showed activity against this G+ bacteria. With these results it can be confirmed that the MUT2-MO2.1 was a more successful recombination compared to MUT1-MUT2-MO2.1.
! Figure 17. The results from disk diffusion for MUT1-MO2.1; the scale in this figure is only for simpler estimation of the results. The number given is based on visual observation of the clarity zone and size of the clarity zone. “0” means no inhibition and 10 means large clarity zone (positive control).
Figure 18. The results from disk diffusion for MUT1-MO2.1; the scale in this figure is only for simpler estimation of the results. The number given is based on visual observation of the clarity zone and size of the clarity zone. “0” means no inhibition and 10 means large clarity zone (positive control).
3.4.1.1. Mutation 2
Figure 19. The results from disk diffusion for MUT2-MO2.1; the scale in this figure is only for simpler estimation of the results. The number given is based on visual observation of the clarity zone and size of the clarity zone. “0” means no inhibition and 10 means large clarity zone (positive control).
3.5. MIC
The minimum inhibitory concentration for MUT1-MO2.1 was measured against two types of bacteria. Figure 20 shows the results from MIC for MUT1-MO2.1 against G- Pseudomonas aeruginosa and Figure 21 illustrates the results against G+ bacillus Subtilis. The pure extract of the protein MO2.1 was used as the positive control, and for the negative control 10 "l of distilled water was added to 90 "l of the bacterial culture.
Figure 20. The results of MIC for MUT1-MO2.1 against gram negative Pseudomonas aeruginosa
Figure 21. The results of MIC for MUT1-MO2.1 against gram positive Bacillus Subtilis
As it is shown in the Figure 20 the addition of recombinant MO2.1 has inhibited the bacterial growth with almost the same strength as the positive control. However an obvious dispersion in the bacterial growth lines for the samples with MUT1-MO2.1 can be observed in comparison with the bacterial growth in both negative and positive
#0&&! #0'&! #0(&! #0)&! #0*&! #0+&! #0,&! #! %##! &##! '##! (##! )##! *##! CD%E%FGF% H6='%8=6):%
?)4=6*"#I613%H'+-%8@AJ3:%
1230!4567859!-:&;/! <5=0!4567859! <>?'! <>?)! <>?,! <>?%)! #0&&! #0(&! #0*&! #0,&! %0#&! %0&&! #! %##! &##! '##! (##! )##! *##! CD%E%FGF% H6='%8=6):%?)4=6*"#I613%H'+-%8@AJ3:%
1230!4567859!-:&;/! <5=0!4567859! @.>AB?'! @.>AB?)! @.>AB?,! @.>AB?%)!control. One possible explanation can be that the recombinant protein samples are the crude extracts containing other types of cell proteins in addition with the recombinant MO2.1 protein. These proteins may interfere with the bacterial growth, and disrupt it or they can also act as a nutrient and enhance the bacterial growth. It is worth mentioning that the MIC test for MUT1-MO2.1 against Pseudomonas should a better result compared to the result obtained from disk diffusion method.
3.6. Protein Concentration
The Table 4, Table 5, Table 6 and Table 7 show the concentrations of both MUT1-MO2.1 and MUT2-MUT1-MO2.1 protein samples. As it is seen in the tables the protein content varies quit a lot from one sample to another which may affect their respond to both the coagulation and antimicrobial tests. For the MUT1-MO2.1 the protein content was measured only for those colonies which showed coagulation activity. In addition in order to make a reliable comparison some colonies were randomly chosen among those either with no or lesser activity. For each sample the measurements were done in duplications to increase the reliability of the results. The value shown in the tables below are the mean value of the two measurements.
MUT1-MO2.1
Table 4. Protein concentrations for recombinant protein samples from MUT1-MO2.1 M = 0.0552
Sample [C] mg/ml Sample [C] mg/ml Sample [C] mg/ml
4 0.36 22 0.74 46 2.11 5 0.89 25 0.74 47 1.51 7 2.01 27 1.45 49 1.97 10 1.88 29 2.35 53 1.08 14 4.86 30 0.43 62 0.41 15 0.57 31 1.92 67 1.09 16 0.4 33 0.94 73 2.14 17 0.34 37 2.81 80 3.64 18 4.54 40 4.22 81 0.47 20 1.12 42 1.75
For instance the sample 2 shown in Table 4 has a high protein content (3.025 (mg/ml)) and also has shown to have a high coagulation activity (Figure 14). Therefore it is more likely that in this sample the protein content consists mostly of MUT1-MO2.1 protein. However this is not always the case, as for samples nr. 18 and 40 for instance, although the protein content (4.54 (mg/ml) and 4.22 (mg/ml) respectively) is even higher than sample 2 but the coagulation and bactericidal activity is not as high as in sample 2 (!""#"$% &'('"')*'%+#,"*'%)#-%(#,)./Error! Reference source not found.). This might be because in the latter cases the protein content consists mostly of crude lysates other than MUT1-MO2.1 protein. In another example the sample 10 for instance, the protein concentration is 1.875 (mg/ml) which is almost half as much as the protein content in samples 18 and 40, yet as it is shown in !""#"$%&'('"')*'%+#,"*'%)#-%(#,)./ it shows to have a quit high coagulation activity.
Although the crude extract termed as EL (positive control)17, shows to have the highest
protein content among all samples 14.65 (mg/ml), Table 5 yet it did not show as high activity as the pure MO2.1 protein used as positive control (results not shown).
Since previous studies have shown the strong effect of pure MO2.1 even down to 100 times diluted. A conclusion can be drawn that the protein content here might not be a relevant measure of the strength of the protein activity.
It should also be taken into consideration that errors such as human factors, instrument failure, and pipetting errors may have occurred during the protein concentration measurements.
Table 5. Protein concentrations for recombinant protein samples from MUT1-MO2.1 M = 0.041
Sample [C] mg/ml Sample [C] mg/ml Sample [C] mg/ml
26 1.32 54 1.3
36 2.05 55 1.28
52 0.85 56 1.37
53 1.13 58 2.3
Table 6. Protein concentrations for recombinant protein samples from MUT1-MO2.1 M = 0.0594
Sample [C] mg/ml Sample [C] mg/ml Sample [C] mg/ml
1 1.29 29 1.99 71 1.2 2 2.22 30 1.59 80 2.05 7 0.37 32 1.88 81 1.74 9 0.12 35 1.5 82 0.65 11 0.35 39 1.84 83 0.89 14 2.8 40 2.59 Pos. EL 14.65 15 0.38 50 1.13 Pos. (13) 2.04 18 1.21 51 1.33 Pos. (25) 3.85 20 0.48 52 0.93 25 1.6 55 1.62 27 0.58 60 1.76 MUT2-MO2.1
Table 7. Protein concentrations for recombinant protein samples from MUT2-MO2.1 M = 0.0427
Sample [C] mg/ml Sample [C] mg/ml Sample [C] mg/ml
1 4.3 22 3.33 44 1.35 2 3.34 23 3.01 45 2.06 3 3.96 24 5.19 46 4.04 4 4.75 25 2.86 47 3.09 5 6.12 26 3.85 48 3.01 6 4.37 27 4.73 50 3.52 7 2.63 28 3.68 51 3.28 8 5.32 29 2.56 52 5.01
M = 0.0427
Sample [C] mg/ml Sample [C] mg/ml Sample [C] mg/ml
9 4.23 31 1.07 53 3.85 10 1.93 32 2.22 54 2.74 11 1.15 33 2.22 56 2.66 12 1.59 34 1.8 57 5 13 1.58 35 2.34 58 3.7 14 2.46 36 2.15 59 3.51 15 1.85 37 1.24 60 3.01 16 2.31 38 2.14 61 6.39 17 1.22 39 2.65 62 4.22 18 3.44 40 1.83 63 3.82 19 4.47 41 2.11 64 4.91 20 2.67 42 2.86 Pos. (25) 2.55 21 4.33 43 2.72
Looking at Figure 21 it shows that although the recombinant MO2.1 has enhanced the growth of the gram positive Bacillus Subtilis, but it does not have the effectiveness of the pure MO2.1 protein (positive control). These results confirm the results submitted for MUT1-MO2.1 from disk diffusion method. Comparing the growth in positive samples for both G+ and G- bacteria shows that the pure MO2.1 has a stronger inhibiting effect on gram positive bacteria. This can be because the MO2.1 protein interacts better with this gram positive bacteria either through hydrophobic interactions or through interaction between its positively charged residues with the negatively charged phospholipids in the membrane of Bacillus, than with the gram negative Pseudomonas.
3.7. Kinetics
3.7.1. MUT1-MO2.1:
Although the results from protein concentration showed that the content of the protein is not necessarily related to the effectiveness of its two activities, yet a kinetic test was
coagulation kinetics test for MUT1-MO2.1 revealed that this recombinant protein shows a relatively better activity at the volume of 5 "l compared to those of 1 and 10 "l. (Figure 22)
One explanation can be that the concentration of MUT1-MO2.1 in 1 "l volume of crude extract is not sufficient for reduction of the turbidity. However for the 10 "l volume the problem may be due to the high concentration of the protein in the solution which may lead to self-aggregation and lose of activity.
Figure 22. Coagulation kinetics for MUT1-MO2.1
In the latest information reported by Asalapuram R et al. the dimerization of the MO2.1 protein does not affect the coagulation activity [32]. However there is a possibility that in higher concentrations the self-aggregation of the recombinant MO2.1 into dimmers or higher order of oligomers, does not favour the activity. One possible reason can be that the set of changes applied into this recombinant protein may cause conformational change in such fashion which abolishes the activity of the protein. This can be due to the steric hindrance of the active sites caused by newly added amino acids when the protein is self-associated. Another reason can be the interference of the side chains of the newly substituted amino acids with the conformation of the main chain through interactions between neighbouring side chains. CD (Circular Dichroism) spectroscopy could be used
#! %#! &#! '#! (#! )#! *#! +#! ,#! "#! %##! &1-'%#(%&'-," )%89:% 0#3#)7%K,=I'"%
0#12,314#)%L6)'4*+%8A%M%GA%=6):%
%!C9! )!C9! %#!C9!to study the secondary structure of the recombinant protein and find out whether this assumption is correct or not.18
3.7.2. MUT2-MO2.1
The result for kinetics of the MUT2-MO2.1 is illustrated in Figure 23. The high concentration of the protein here does not seem to cause lose of activity, however yet the 5"l volume seems to be the most suitable one. This can simply be explained as the changes made into this recombinant MO2.1 have not had any interference with the activity of the protein. Looking at the protein concentrations for the samples 16 and 19 in Table 7 it is shown that the protein concentration in sample 16 is 2.31 (mg/ml) while the protein concentration for sample 19 is 4.47 (mg/ml) which is almost double as much as sample 16. Despite higher protein content of sample 19 it shows a relatively lower antimicrobial activity for 10 "l volume compared to sample 16 (Figure 23).
Figure 23. Coagulation kinetics for MUT2-MO2.1
As it is already explained one possibility is that the high protein content of sample 19 is not due to the presence of MUT2-MO2.1 but other types of cell proteins in the crude
!!!!!!!!!!!!!!!!!!!!!!!!!!!!!!!!!!!!!!!!!!!!!!!!!!!!!!!!!!!!! #! %#! &#! '#! (#! )#! *#! +#! ,#! "#! %##! &1-'%#(%&'-," )%89:% 0#3#)7%K,=I'"%
0#12,314#)%L6)'4*+%8A%M%GA%=6):%
%!C9! )!C9! %#!C9!extract. Thawing and refreezing of protein samples is another reason for their lose of activity, since the MO2.1 protein is very temperature sensitive, and this sensitivity may even have been exacerbated due to the recombination.
4. Conclusions
The aim with this study was to use mutation for making recombinant MO2.1 protein with enhanced activity. The results have shown that this aim is not unreachable, however there will still be more studies and experiments needed to reach this goal. This study has shown that the low-cost and simply applicable methods such as disk diffusion and clay solution can be used as reliable methods for investigation of the activity of the recombinant MO2.1 protein. Although the production of MO2.1 is not yet economically favourable to be used in industrial scales, it is a door to new ideas and possibilities as well as a tool for broadening our knowledge.
5. Acknowledgement
I offer my sincerest gratitude to Professor Gunaratna Rajarao-kuttuva for intrusting me with this thesis and for her excellent and constant supervising. I am also so grateful for her support and encouragements during the whole work. My special thanks go to Doctor Pavankumar Asalapuram Ramachand for his perfect supervising, encouragements and constructive comments during the first months of the work. I want to give my greatest appreciation to Professor Stefan Ståhl for taking the time to be my examiner. I also want to thank the MIBI group including Doctor Chuka Okoli, PhD-student Ida Bodlund, PhD student Ramnath Lakshmanan, master thesis student Tobias Ölander and master thesis student Kraiwut Jansriphibul for being so helpful and supportive.
6. References
[1] S. J. S. R. Folkard Geoff, "Water clarification using Moringa oleifera seed coagulant," WELL, vol. 60, 1999.
[2] C. S. S. C. K. K. G. P. T. J. M. Broin, "Flocculent activity of a recombinant protein from Moringa oleifera Lam. seeds," Appl Microbiol Biotechnol, vol. 60, no. 23 August 2002, p. 114–119, 2002. [3] T. C. T. M. A. E. J. O. M. Pritchard, "A study of the parameters affecting the effectiveness of Moringa oleifera in drinking water purification," Physics and Chemistry of the Earth, vol. 35, pp. 791-797, 2010.
[4] A. U. B. W. N. a. M. O. Tetsuji Okuda, "Improvement of Extraction Method of Coagulation Active Components from Moringa Oleifera Seed".
[5] D. A. A. a. T. N. Shunsuke Meshitsuka, "A Risk of Alzheimer's Disease and Aluminum in Drinking Water," PSYCHOGERIATRICS, vol. 2, pp. 263-268, 29 November 2002.
[6] S. Jed W. Fahey, "Moringa oleifera: A Review of the Medical Evidence for Its Nutritional, Therapeutic, and Prophylactic Properties. Part 1.," Trees for Life Journal, vol. 1:5, no. December 1, 2005, 2005.
[7] C. N. B. D. J. P. O. C. H. E. C. E. J. A. a. L. R. F. Martyn, "Geographical Relation between Alzheimer's Disease and Aluminium in Drinking Water," The Lancet, vol. 1, pp. 59-62, 1989. [8] D. D. O. E. a. R. V. K. Mccollister, "Toxicology of Acrylamide, Toxicol. and Appl. Pharmacol.,"
vol. 6, pp. 172-18, 1964.
[9] S. L. M. A. a. A. H. G. Farooq Anwar, "Moringa oleifera: A Food Plant ith Multiple Medicinal Uses," 2006.
[10] M. H. S. C. F. F. P. C. C. S. O. M. R. F. P. M. a. N. M. Mougli Suarez, "Structure-Function Characterization and Optimization of a Plant-Derived Antibacterial Peptide," ANTIMICROBIAL AGENTS AND CHEMOTHERAPY, vol. 49, no. 9, p. 3847–3857, Sept. 2005.