Is there any economic influence on the
cultural expenditures?
A framework of the UK culture sector
Master Thesis within Economics and Management of Entertainment and Art Industries
Author: Sömjéni Gábor
Tutors: Charlotta Mellander, Pia Nilsson and Özge Öner
i
Master Thesis within Economics and Management of Entertainment and Art Industries
Title: Is there any economic influence on the cultural expenditures? A framework of the UK cultural sector
Author: Sömjéni Gábor
Tutor: Charlotta Mellander
Pia Nilsson Özge Öner
Date: 2011.05.31
Subject terms: culture, public goods, welfare economics, public finance theory, time series analysis
Abstract
This paper explores the relation between the governmental expenditures on the cultural sector and the performance of the economy in the UK. In welfare economies it is the government’s role to shorten the effects of the occurring market failures. It is shown that in the cultural sector, two market failures, the high fix cost and the productivity lag are appearing. In order to ease these effects the government intervening into the market mechanisms by giving grants and subsidies to the stakeholders. In the empirical part a time series analysis is executed between the GDP, the total governmental expenditures and the governmental expenditures on the cultural services on a 60 years interval in the UK. It is shown that the three variables have the same order of integration, they move together over time, furthermore cointegration was detected between them. With Granger causality test it was proven that there is a bidirectional informal connection between the performance of economy and the government’s cultural expenditures.
ii
Contents
1. Introduction ... 1
1.1 Purpose of the thesis ... 2
1.2 Disposition... 2
2. Theoretical background ... 3
2.1 The welfare economy and the invisible hand ... 3
2.2 The government as a distributor of wealth ... 3
2.3 The theory of public finance... 4
2.4 Public goods ... 5
2.5 The provision of cultural goods ... 5
3. Historical background ... 7
3.1 Culture and economy ... 7
3.2 The art sector ... 8
3.3 The British art sector ... 8
3.4 The role of subsidy in the art sector ... 9
3.5 Funding the Arts and Heritages in Britain ... 10
3.6 Market failures in the art sector ... 11
3.7 Arguments for subsidizing the arts ... 12
3. Empirical analysis ... 14
3.1 Data gathering ... 14
3.2 Research approach and methodology ... 14
3.3 Defining the models and the hypothesis ... 15
3.4 Visual plot of the variables ... 16
3.5 Correlation ... 17
3.6 Unit Root test... 18
3.7 Cointegration ... 20
3.8 Granger causality test ... 20
3.9 Results ... 21
4. Conclusion ... 23
References ... 25
1
1. Introduction
In this section the purpose of the thesis and a broad view of the historical background are introduced. It is discussed what kind of powers influence the culture sector and what challenges it is facing with.
The culture sector became a significant factor in the western countries over the last 60 years. From the political dimension the main reason is that culture policy turned into a notable part of the Western world’s strategy making. The Arts Council of Great Britain was established in 1946 and later it was followed by many countries in Europe and North America who set up their own Arts Ministries or Council departments (Toepler, 2002). They were formed in order to organize ways of supporting cultural activities and to define clear future achievements, such as preserving and maintaining the national heritages and prestige. Furthermore economic incentives can be found among the arguments: boosting tourism through the culture sector can be a significant source of income in a country (Parliament UK, 2010).
In 1998 at the Intergovernmental Conference on Cultural Policies for Development in Stockholm 150 countries decided and agreed that Cultural Policy goals should be settled, since these appear to be key components of a country’s development strategy (Thorsby, 2004).
The economic explanation shows us that a significant change can be observed in the western countries over the last decades in terms of the growth of: income, leisure time vs. work time, education level, consumption. All these factors are called the determinants of the demand for the arts (Andersson, 2006). The leisure time has been growing over the last centuries, due to the technological and corporate cultural changes. In the western countries the yearly work load was reduced to a 1700 hours level, which implies that people have more time to consume entertainment and art products (Thorsby, 2004).
In practice the culture sector is receiving tremendous amount of subsidies and governmental expenditures in advanced economies today. According to the UK treasury (UK public spending, 2011) the British government is spending nearly 2 billion pounds yearly on the cultural services. The arts and cultural heritage was worth £86 billion (3,7 % of GDP) through the tourism in 2007 in the UK (Parliament UK, 2010).
However, this picture is about to change drastically for many reasons. The global recession hit the western countries really hard, and many of them are now struggling to keep the balance in their budgets, or preventing an even bigger deficit to be formed than they have now (Faiola, 2010); (Sica, 2010).
This change in the economic environment forces governments to have more restricted financial policy, which means that sectors like subsidized culture will be affected heavily in countries such as Britain or the Netherlands (Faiola, 2010). For the sake of budget consolidation the reigning government cut the budget for arts with €200 million in 2010 (Sica, 2010).
2
The decreases in governmental interventions generate a critical situation in the cultural sector. Due to various market failures, such as high fix costs and productivity lag, many institutions in the sector cannot maintain themselves just from their income. According to David Thorsby in a society, where “market fail or do not exist, voluntary or coercive collective action may be required in order for optimal social outcomes to be achieved” (Thorsby, 2004).
1.1 Purpose of the thesis
The purpose of this thesis is to analyze the level change of the government’s expenditure on the culture sector over a 60 year time period (1950-2010) in Great Britain, and to find an answer to the following key question: Is there any relation between the overall economic conditions of a given country and the governmental expenditures on the cultural sector?
1.2 Disposition
This thesis contains three parts. The first two sections are discussing theoretically and historically what is meant by public goods and culture sector, how it is defined, how it functions in terms of company forms and finance and finally why the cultural sector requires governmental intervention. The analysis in the thesis is focusing on those special segments of the sector, where the effects of the market failures are significant, such as the art industries.
The third part of the thesis examines empirically the cultural sector in Great Britain. The purpose of the statistical time series analysis is to test the direction of causality between GDP, the total governmental expenditures and the expenditures on the cultural sector over a 60 year time period.
3
2. Theoretical background
In this part of the thesis the theoretical background of public goods is discussed. The role of the state appears as the redistributor of the wealth and the provider of solutions to market failures. It is also shown that the cultural goods are listed as public goods.
2.1 The welfare economy and the invisible hand
The notion, welfare economy is focusing on normative problems appearing in a society. In relation to normative questions economists tend to think of utility, equity and efficiency issues. From the governments perspective this means the following question: How could a state reallocate its resources? Why do market failures exist in an economy and what do they imply?
According to Smith1 (1937, 1982), an “invisible hand” is distributing resources between the people in the market place. Market failures (Bator, 1958) occur when distortions prevent this invisible hand to distribute the wealth efficiently among the participants of the market. In other words the market equilibrium, where the supply and the demand meet, cannot reach a steady state. First it was Smith who referred to an invisible “point” in the market, where the market is heading through the price mechanism (Smith, 1982). However scholars had to wait one more century when Walras managed to prove it in his book, the Elements of Pure Economics that markets tend to move to an equilibrium point (Walras, 1977). Pigou (1947), Musgrave (1959) and Samuelson (1954) go further from the original idea by stating that these market failures results in under provision of certain collective goods. According to Pigou (1947) a market failure cannot only lead to under provision but also governmental failures can result in undersupplying the public goods and services. Pigou’s underlying idea is that financing these goods will distort taxes and have a negative effect on the supply.
2.2 The government as a distributor of wealth
The role of the state has always been a key question among economists. According to Olsson (1965), collective action is needed in the interest of the majority. This implies that the government in charge should provide public goods even though it may result in free rider effects by smaller interest groups.
Wicksell (1896) was one of the first economists who discussed the state as a distributor of the wealth. In his book, A New Principle of just Taxation, he writes about how a government should consciously organize its taxation policy. Wickshell created the notion, benefit principle, where the “values and counter values” in a distribution process should be measured. In other words this principle does not only focus on the income side of the budget but also on the expenditure. This approach was used not just by the state but by the voters’ side too, who
1
The thesis uses reprinted versions of Adam Smith’s and Walras’ works. The Wealth of Nations from Smith were published in 1776 and 1759. The Elements of Pure Economics from Walras was published in 1844.
4
tend to consider the benefits of reallocated resources and the burden of the taxation. Their voting decision embodies the collective action mentioned by Olsson (1965) and this choice tends to become a political question on the decision makers side.
The benefit principle later inspired other economist to discuss and focus on not just an ability-to-pay taxation principle but also how the state should allocate the given resources moreover how the provision of public goods should be efficient.
2.3 The theory of public finance
In his book, the Theory of Public Finance, Musgrave (1956) improved Wickshell’s idea by dividing the budget into three branches:
1. The Allocation Branch should deal with planning of the cost bearers, and the policy tools (revenue, expenditure) needed in order to achieve the preferred future outcome.
2. The Distribution Branch should execute the plans by setting up the “infrastructure” of reallocation.
3. The Stabilization’s Branch should secure employment- and the price-level rate, which means the government is artificially intervening into certain market mechanisms.
It was not just Musgrave who realized the connection between the income and expenditure side of the budget. According to Buchanan (1949): “The state has its origin, and depends for its continuance upon, the desires of individuals to fulfill a certain portion of their wants collectively. The state has no ends other than those of its individual members and is not a separate decision making unit. State decisions are, in the final analysis, the collective decisions of individuals”.
In 1883 Wagner created his law about the nature and relation between economic growth and public expenditures. Wagner’s law is stating that between these two variables there is a unidirectional relationship. According to him the sequence is starting from the economic growth and resulting in an increase in the government’s public expenditures. Keynes (1936) observed this phenomenon but draw a contradictory conclusion; that the state’s public spending causes the economic growth. While both approaches are assuming the existence of a unidirectional formal connection, recent studies (Cheng and Lai, 1997), (Demirbas, 1999), (Peacock and Scott, 2000) showed this one sided effect is cannot be proved. The results of the level of connection between governmental expenditures and economic growth are significantly differing by countries and periods in these studies.
5
2.4 Public goods
Adam Smith (1973) was the first who used the notion public goods in his book, The Wealth of Nations, however he meant that public good is a common good. In a modern economic sense Samuelson (1954) and Musgrave (1959) discuss the public good issue. According to them public goods have one or both of the following characteristics while consuming them: non-rival and non-excludable (Cornes and Sandler, 1999).
The non-rival property means that consumption of a public good by one individual is not reducing the availability of consumption of a public good for others. For instance enjoying the sight of a firework by one person does not reduce other people’s ability to watch it as well. The non-excludable property implies that no one can be excluded from consumption. Another example is air, which can be breathed in by everyone. Musgrave and Musgrave (1989) combine the two properties in order to categorize different shorts of goods:
Table 1: Categorization of goods
Excludable Non-excludable
Rival in consumption 1. 2.
Non-rival in consumption 3. 4.
Source: Musgrave and Musgrave (1989)
1. In this quadrant pure private goods can be found. Here goods are rival and excludable. An example can be a hamburger. Consuming a hamburger means that no one else can eat it and no one else can have any other economic utility from it.
2. In the second cell rival but non-excludable goods can be found. This is a rare case and Musgrave tends to brings up the example of a national park, since it requires some kind of governmental provision. However crowding effect can occur, where space constraints determines the number of individual, who can consume the public good at the same time.
3. The third quadrant represents goods where exclusion is possible. Musgrave’s example to this type of good is the empty bridge. For consumers who use it the bridge is non-rival, however it can be excludable.
4. The last quadrant is the pure public good. Air, national defense are “goods” which can be found here.
2.5 The provision of cultural goods
In a society many type of public good can be found. A public library, a national or regional museum, theaters and even the education system of the country can be listed as public goods. Another example of a public good is cultural public goods (Santagata and Signorello, 2000) which have the characteristics of purely public goods or mixed goods2 (Thorsby, 2004).
6
According to Santagata and Signorello (2000), one can distinguish between four types of cultural good supplier such as: the Market, State, Non-profit and Collective Ethic Cooperation.
Market provided cultural good can be a palace or a church where exclusion is possible. In this case the cultural good is listed as a mixed good. The market’s aim is to profit maximize. State provided cultural goods can be a library, a museum or the state’s educational system. The government tends to grant these goods by public institutions. The aim is to reduce the market price of the admission fee at the institution. In other words through direct taxation the government gives services at a lower price level than the market.
The Non-profit granted cultural goods can be theaters, music festivals and museums. The Non-profit organization is appearing between the state and the provided good or service. In this case the state has no direct influence and other stake holders are the direct managers of the NPO, such as private donators, patrons, foundations. The aim is the same as in the state provided cultural good case: grant the cultural services and goods at a low price level or for free.
The goods granted by a Collective Ethic Cooperation tend to be free where the contributors are voluntary operating on the market (Santagata and Signorello, 2000). Examples can be charity activities, free summer camps for children.
7
3. Historical background
In this segment of the thesis it is shown what is meant by cultural sector and specifically the United Kingdom’s cultural sector. As a limitation and example the art sector and its properties are introduced in order to explain the market failures and the need for governmental intervention.
3.1 Culture and economy
Culture and economy are operating in different dimensions. On one hand culture accompanies our history since a long time age. Culture was the part of the old civilizations which could only exist based on rich people’s noble donors and a need to crave for something new, something unorthodox. On the other hand economy and the economical theories in the modern meaning were always dealing with the relations of society and material values, production (Thorsby, 2003). Because of this duality it is hard to define or observe values and utilities for the cultural goods (Thorsby, 2003).
Many different types of approaches can be found in the literature in order to define the cultural sector. O’Brien and Feist (1995), Pratt (1997) and the Policy Science Institution of London (PSI, 1993) have their different definitions of the cultural sector. In this thesis Sara Selwood’s (Selwood, 2001) enumeration is used, since it provided a broad understanding of the sector and detailed enough to draw the future limitations for the analysis.
According to Selwood (2001) the cultural sector can be defined by the following segments:
built heritages film
libraries literature
museums and galleries performing arts
public broadcasting visual arts
One can group this list into two parts: government owned segments and private or mixed3 segments (Towse, 1994). In order to analyze and understand the market mechanisms and failures, a limitation is used. From now on the thesis focuses on the private or mixed segments of the cultural sector, namely the art sector. By narrowing the subject a deeper explanation on the market mechanism can be given.
3 Under the phenomenon mixed institution one can understand a cultural segment, where both private and public
interests occur. For instance it can be a ballet institution, which is run by a non-profit organization, however indirect governmental influence may occur in forms of grants and subsidy.
8
3.2 The art sector
In the literature several influential versions can be found, which divides differently the art and creative industry sector.
1. According to Throsby (2001) the Core Creative Art is made up of: performance arts, music, visual arts, video arts, literature and even the computer and media art. The other larger segment of art industry is: book and magazine publishing,
telecommunication, and film. The last segment contains advertising, fashion, tourism, design and architecture.
2. Hutton (2007) has a different approach in his study called: Staying Ahead. He makes the following sub-dividing: The creative core contains: all the original, new output creations which have expressive value.
The cultural industries, such as broadcasting, music, films are the commercialized formations of the expressive goods (Hutton, 2007).
3. The third one is a KEA study for the European Commission. According to them the art industry can be sub-divided: Core Arts field, which contains the Visual and Performing art and the Heritages such as paintings, sculpture, etc.
Under Cultural Industries they understand: film, music, broadcasting, prints and press, while the Creative Industries including just the design and architecture and advertising (KEA, 2006).
One should notice that the three different approaches above are not matching in some aspects. David Throsby is using a liberal model, while the KEA study strictly sticks to a conservative, rather traditional view. On the other hand one should acknowledge that all three approaches are correct, however the differences will result not just in diverse theoretical analysis but also in a diverse policy making.
In the thesis the officially determined definition from the Arts Council of England is used, in order to draw a clear picture of the British art sector for further analysis.
3.3 The British art sector
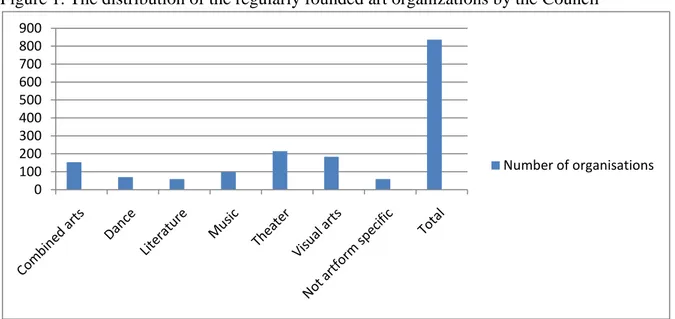
In Great Britain the Arts Council England distinguishes 7 main types of art forms (Council, 2010):
Combined arts: refers to organizations that perform a combination of the following art forms;
Dance: refers to organizations that are providing dance performances;
Literature: includes organizations dealing with publishing and creating literature; Music: refers to organizations that are providing music performances;
Theatre: includes organizations that give theater performances;
9
Not art form specific: all other art forms that cannot be included to the previous ones Also these are the main art forms that the institutions and organizations are funded by the Arts Council of England. The following figure is showing the breakdown of the regularly funded art organizations:
Figure 1. The distribution of the regularly founded art organizations by the Council
Source: Council (2010), Arts Council England: Annual review, 2010.
3.4 The role of subsidy in the art sector
For governmental support of the cultural sector one there is a distinction between public, governmental expenditures on the culture and subsidizing the arts. On one hand the first is a direct form of finance to different parts of the sector. These parts tend to be fully government owned institutions, such as national museums, heritages 4. This implies that public expenditures are used to sustain and maintain these institutions.
Subsidizing arts means changing the market behavior on the demand and supply side and to decrease the market failure effects, in other words it is a policy tool. It can be used not only to sustain non-state owned institutions, but also to change the behavior of these organizations by creating incentives to make changes in terms of quantity, quality and price levels (Towse, 1994). According to Frey the art policies can have different aims. For example boosting tourism, sustaining an art institution or strengthening cultural education for the youth requires different types of subsidies (Frey, 2000).
4
One should point out that these are the parts of the cultural sector which are not included in the art sector. 0 100 200 300 400 500 600 700 800 900 Number of organisations
10
3.5 Funding the Arts and Heritages in Britain
Figure 2. shows the operation of the funding system in Britain. One can distinguish five main funding sources, while the main funding body is the Department of Culture, Media and Sport (DCMS). The complexity of the supporting system is coming from the fact that the DCMS function as an allocation branch and the funding allocators as distribution branches (Musgrave, 1956).
Figure 2. Funding the Arts and Heritages
Source: Alan Peacock (2000): Public Financing of the Arts in England, Page. 175.
In real life this theory is not executed in this way by the system, since all fully government owned institutions are supported directly, meanwhile many of the allocation branches are non-profit organizations. The NPO’s intentions can differ from the state’s, which can lead to a biased situation, where the state is supporting the NPO with grants. However the government cannot follow and influence the way the money should be spent. In other words the allocation is being executed by the NPO (Peacock, 2000).
These proceedings can be justified by the fact, that the Art Councils and other NPO’s are receiving private support (Council, 2010), (Peacock, 2000) which is a significant part of their budget. A possible governmental intervention into the NPO’s budgeting would lead to an uncertain state, due to the reaction of the private donators.
11
3.6 Market failures in the art sector
The art sector has its special properties. There is an income-expenditure duality of an art sector institution’s budget, which has certain implications. On the income side a museum or performing art institution we can detect a monotonously growing amount of revenue, which is usually generated by the raising ticket prices (Baumol & Bowen, 1965). Hence the income side is rigid, since significant positive changes could appear from technological developments or grants, donations but not from admission fees.
However this income is not covering the costs of an art institution for two reasons.
Powell (2006) argues that maintaining these institutions involves a high fix cost. Historically art performances and museum exhibitions take place in large institutions, which involve a large maintaining cost.
The second reason is so-called productivity lag or cost disease (Baumol & Bowen, 1965). The productivity lag evolves due to the reason that economic growth is indicating a raising amount of salaries in both the manufacturing and art segments.
In their study Baumol and Bowen compared the two sectors and found the followings: Economic development is mainly generated by the manufacturing markets so on these fields the salaries are growing accordingly to the extent of the economic development. The manufacturers can keep up with this effect, since they have the ability to use economies of scale and scope in their production in order to reduce their fixed costs effectively. Meanwhile in the art sector the salaries are growing at the same level, however they cannot use the economies of scale and scope to the same extent to reduce their costs as effectively as the manufacturers. In other words this means while in both segments salaries are growing with the economic development, the art sector is suffering from this disease (Baumol & Bowen, 1965), (Abbing, 2004), (Caves, 2001), (Towse, 1994).
Figure 3. illustrates the UK art sector’s cost disease effect, the following figure is introduced. The breakdown of the total income by artform showing that the organizations’ income earned by them is just the third or half of the total income. Towse (1994) argues that even though they receive significant support from the government, the art organizations’ budget tend to be break even.
12
Figure 3. Break down of total income by artform in England
Source: Council (2010), Arts Council England: Annual review, 2010.
This directly implies that a possible cut in their budget causes a biased situation. On one hand the art institution, such as performing arts will be forced to change, lower or cancel some their performances (British Journal, 2010); (Cultural Policies, 2011). On the other hand last years the attendance to these institutions has been monotonously growing in the UK (Council, 2010).
3.7 Arguments for subsidizing the arts
From an economist’s perspective there is a number of efficiency arguments for subsidizing the arts.
1. Option value: People who are presently not taking part or enjoying arts by buying tickets have a willingness to pay taxes in order to sustain the sector. Pigou (1952) draw the attention to the conservation or preservation to sectors or the environment, where the market is inefficient. He argues in this case governmental intervention is needed in forms of taxes. In other words the state through the subsidies executes the willing of the residents.
13
2. Future generations or merit argument: Implying that future generations should have the opportunity to enjoy the arts.
3. National prestige: In a nation citizens are proud of their heritages, so they are willing to preserve it.
In some aspect these arguments emphasize that art is a phenomenon, which lay deep within the body of a countries culture. Therefore the preservation for future generations and for national identity is essential (2-3. argument). Because of this reason the state is acting through the citizens will (Mancur, 1965).
4. Spillover benefits and positive externalities: By subsidizing the arts, spillover benefits occur, since new jobs will be created (the art sector it is a labor-intensive market). The notion, externalities, came into recognition by Coase (1960). An externality a cost or benefit, not transmitted through prices, incurred by a party who did not agree to the action causing the cost or benefit. A benefit in this case is called a positive externality or external benefit, while a cost is called a negative externality or external cost. A negative externality can be a plant where pollution may arise and which damages the surrounding business’ interests. In this case the plant’s owner should repay the not intentionally caused damage to the businesses, who were affected (Cornes and Sandler, 1999).
In the art’s case, we tend to speak about positive externalities. Positive effects can be easily shown on the tourism or on the education of the upcoming generation. Job preservation and recreation are also counted as positive externalities, since the art industries counted as a labor intensive sector.
5. Merit good: Musgrave (1959) created the notion: merit goods. A merit good can be defined as a good which would be under-consumed or under-produced in the market economy. The need to structure the goods and services in a different unorthodox way and create this new type came from the recognition that these goods are under-consumed. Musgrave also defined the merit goods as an adjustment of “a distortion in
the preference structure”(Musgrave, 1959).
Another type of argument is the equity argument (Abbing, 2004). This is saying that in a society everyone should have the opportunity to enjoy and consume arts. Since art is considered as a luxury good, with an income elasticity above 1, governmental intervention is needed in order to lower the market prices. With the low prices people with lower incomes could have the opportunity to consume art goods.
14
3. Empirical analysis
In the empirical part of the thesis a Granger time series causality test is executed in order to study the direction of causality between three factors: the economic growth, the public expenditures on culture and the overall governmental expenditures in the UK from 1951 to 2011.
3.1 Data gathering
In the United Kingdom public spending is transparent. This indicates that not just in the present but back to many decades it is possible to find all the relevant data, which formed the county’s budget. In this testing secondary data will be used and the main source of the information is the official government website (UK public spending, 2011). From here the thesis obtained the main economic indicators, which will be used in the analysis:
GECSt: Governmental expenditures on cultural services. The GECSt shows for a
given year the amount of money the UK government spent on culture. This amount includes all the government direct expenditures, grants and subsidies which were spent on the cultural services. The variable is measured in billions of £ on a 2005 basis. Examined period: 1951-2011.
TGEt: Total Governmental Expenditure. The TGEt shows for a given year the amount
of money the UK government spent. The variable is measured in billions of £ on a 2005 basis. Examined period: 1951-2011.
GDPt: Real Gross Domestic Product. The GDPt refers to the overall market value,
which was produced within the UK in a given year. The variable is measured in billions of £ on a 2005 basis. Examined period: 1951-2011.
3.2 Research approach and methodology
The research approach is to test the direction of causality between the three economic indicators. A Granger causality test is applied (Granger, 1969), which is a time series regression model. A Granger test uses the past and present values of variables and based on the significance results it is trying to find indirect causality links. This method was improved by Toda and Yamamoto (1995), who applied one more step, a modified Wald test, in order to set up lag limitations for their VAR (Vector Autoregressive) model’s parameters. In other words Toda and Yamamoto’s methodology is trying to deal with the possible existence of the invalid asymptotic critical values in non-stationary or cointegrated environment.
In the thesis analysis the following steps will be executed:
1. Defining the models and parameters 2. Setting up the hypothesizes for the models
15
3. Displaying graphically the time series of the variables 4. Run a correlation analysis
5. Run an unit root test in order to decide whether the time series is stationary or not 6. Testing the existence of cointegration between the variables
7. Run the Granger causality test to decide to reject or keep the hypothesis
3.3 Defining the models and the hypothesis
In the thesis 3 bivariate VAR models are created. The causality testing is executed between the GECSt and GDPt, the GECSt and TGEt and finally the GDPt and TGEt respectively:
Model [1].
GECSt=α1+β1GECSt-1+…+ βlGECSt-l+δ1GDPt-1+…+ δlGDPt-l+ε1t
GDPt= α2+ β 1GDPt-1+…+ β lGDPt-l+ δ 1GECSt-1+…+ δ lGECSt-l+ε2t
Model [2].
GECSt=α3+ γ1GECSt-1+…+ γlGECSt-l+ ψ1TGEt-1+…+ ψlTGEt-l+ε3t
TGEt= α4+ γ 1TGEt-1+…+ γlTGEt-l+ ψ 1GECSt-1+…+ ψ lGECSt-l+ε4t
Model [3].
GDPt= α5+ η1GDPt-1+…+ ηlGDPt-l+ θ1TGEt-1+…+ θlTGEt-l+ε5t
TGEt= α6+ η 1TGEt-1+…+ ηlTGEt-l+ θ 1GDPt-1+…+ θ lGDPt-l+ε6t
where:
GECSt: Governmental Expenditures on Cultural Services at t year
GDPt: Gross Domestic Product at t year
TGEt: Total Governmental Expenditures at t year
α’s: constant terms in the VAR model
β, δ, γ, ψ, η, θ’s: the coefficients of the 3 variables respectively ε’s: error terms in the VAR model
l: lag length
The three models entail the following hypothesizes: In Model [1]. at the first equation the null-hypothesis is that GECSt does not Granger causes GDPt if the δ coefficients are equal to
0. The alternative hypothesis is that GECSt does Granger causes GDPt if the coefficients are
not equal to 0. In Model [2]. at the first equation the null-hypothesis is that GECSt does not
Granger causes TGEt if the ψcoefficients are equal to 0. The alternative hypothesis is that
GECSt does Granger causes TGEt if the coefficients are not equal to 0. In Model [3]. at the
first equation the null-hypothesis is that TGEt does not Granger causes GDPt if the θ
coefficients are equal to 0. The alternative hypothesis is that TGEt does Granger causes GDPt
if the coefficients are not equal to 0. In all three models the same hypothesizes can be drawn with opposite causality direction. With this methodology the thesis has 6 different null-hypothesizes about the direction of the Granger causality between the variables.
16
3.4 Visual plot of the variables
Figure 4-5 illustrates the development of the three economic indicators. Each of them are obtained from the UK public spending (2011) official website and calculated in billion £ on 2005 basis. All variables show annual data, since according to Singh and Sahni (1984), these indicators are not sensitive to seasonal or cyclical changes.
Figure 4. GDP and Total governmental expenditures in the UK (1951-2011)
Source for Figure 4-5: UK public spending (2011)
In Figure 4. the GDP and total spending of the UK’s government are shown. Both variables have been growing rapidly over the last 60 years and while the GDP grew 4 times bigger the public expenditures grew 4.7 times bigger in real terms. By examining visually the figure one may suggest that these two variables might move together.
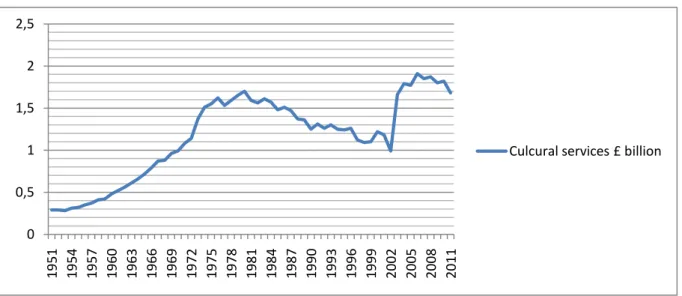
Figure 5. Governmental expenditures on cultural services in the UK (1951-2011)
Figure 5. illustrates the governmental expenditures on cultural services. The volume is significantly smaller compared to the national income or the public expenditures. This statement can be proved by pointing out that the mean of the cultural spending in the
0,00 200,00 400,00 600,00 800,00 1000,00 1200,00 1400,00 1951 1955 1959 1963 1967 1971 1975 1979 1983 1987 1991 1995 1999 2003 2007 2011
Total spending billion £ GDP billion £ 0 0,5 1 1,5 2 2,5 1951 1954 1957 1960 1963 1966 1969 1972 1975 1978 1981 1984 1987 1990 1993 1996 1999 2002 2005 2008 2011
17
percentage of the GDP is 0.156 calculated on the 60 year interval. This indicates that a possible visual examination may lead to false forecasting. In Figure 5. two peaks can be observed. From the beginning till 1980 the governmental expenditures were growing in a rapid way. The volume of the growth was faster than the TGE, however from 1980 it stopped for the next 23 years. During this period the inflation of the £ and other fiscal political effects eroded the GECS. The second peak came in 2003, when the UK government decided to reallocate incomes from the National Lottery to the cultural services. The cultural sector (and be more precise the art sector within) received a part of the National Lottery’s income as a grant (Council, 2010).
Table 2. Descriptive statistics of the variables
Descriptive Statistics
N Minimum Maximum Mean Std. Deviation Variance
GECS 61 ,28 1,91 1,165 ,49611 ,246
TGE 61 123,71 583,71 296,412 124,215 15429,25
GDP 61 325,48 1330,31 747,279 311,231 96864,94
Valid N (listwise) 61
Source: UK public spending (2011)
From the descriptive statistics one can see numerically the change of the variables. For the GECS the minimum value was 0.28 billion £, the maximum value 1.29 billion £, with a mean of 1.1649 and a standard deviation of 0.49611. The TGE has the most excessive values, from a minimum 123.71 billion £ it grew to a maximum 583.71 billion £. According to the excessive values the standard deviation is 124.215 billion £. The GDP in the UK followed the same pattern. Its minimum value was 325.48 billion £, while in 2011 it reached the maximum of 1330.31 billion £ with a standard deviation of 311.23billion £.
3.5 Correlation
The correlation analysis shows how strong the relationship between two statistical variables. The value of the correlation moves from -1 to 1 where, -1 indicates a strong negative connection, 0 means no relationship at all, while 1 is showing a strong positive relation. One should point out that a correlation analysis is not providing any insight in the causality between the variables, however it can numerically introduce the movement of the variables.
18
Table 3. Correlation matrix
GECS TGE GDP
GECS 1 0.82 0.747
TGE 0.82 1 0.975
GDP 0.747 0.975 1
Source: UK public spending (2011)
The obtained bivariate correlation indexes are showing strong positive relationships between the three variables. The strongest relationship is between the GDP and the total governmental expenditures, where the bivariate Pearson correlation index is 0.975. The weakest relationship is between the governmental expenditures on cultural services and the GDP, where the correlation index is 0.747.
3.6 Unit Root test
In a time series analysis one can implement unit root testing to see whether the dataset is stationary or not. In a stationary process no unit-root can be found, so the means and variances of the dataset are not changing over time. This thesis uses augmented Dickey-Fuller (Dickey, 1979) test. In all three cases the rule of thumb is the following: If the GDP, GETS and TGE have the same order of integration that indicates the variables move together over time. The test employs non-differentiated- and first differentiated- levels of the variables.
Firstly the non-differentiated tests were executed, where the null-hypothesizes were: GDP has a unit root, GECS has a unit root and TGE has a unit root respectively.
Table 4. Unit root test on non-differentiated level (Source: UK public spending, 2011)
Null Hypothesis: GDP has a unit root
t-Statistic Prob.*
Augmented Dickey-Fuller test statistic 0.893259 0.9948
Test critical values: 1% level -3.546099
5% level -2.911730
10% level -2.593551
Null Hypothesis: GECS has a unit root
t-Statistic Prob.*
Augmented Dickey-Fuller test statistic -1.482996 0.5354
Test critical values: 1% level -3.544063
5% level -2.910860
10% level -2.593090
Null Hypothesis: TGE has a unit root
t-Statistic Prob.*
Augmented Dickey-Fuller test statistic 1.445675 0.9990
19
5% level -2.911730
10% level -2.593551
In the case of GDP, one cannot reject the null-hypothesis, since the obtained augmented Dickey-Fuller t-test statistic value (0.893) is bigger than the critical values on any significance level (-3.55, -2.91, -2.59). This implies, that the GDP datasets has a unit root on its level, in other words it is non-stationary. At the GECS, one cannot reject the null-hypothesis, since the Dickey-Fuller t-test statistic value (-1.482) is bigger than the critical values on any significance level (-3.55, -2.91, -2.59). This means, that the GECS datasets has a unit root on its level, so it is non-stationary. In the case of TGE, the null-hypothesis is cannot be reject, since the obtained Dickey-Fuller t-test statistic value (1.445) is bigger than the critical values on any significance level (-3.55, -2.91, -2.59). This implies, that the GDP datasets has a unit root on its level, in other words it is non-stationary.
On the first difference levels the null-hypothesizes were the same and in each case it should be rejected, since the augmented Dickey-Fuller t-test statistic values were smaller than the given significance levels’ values (GDP: -5.23, GECS: -7.62, TGE: -4.97, while the significance levels were -3.55, -2.91 and -2.59 respectively). In other words the three time series datasets are stationary in their first difference.
Table 5. Unit root test on first differentiated level
Null Hypothesis: D(GDP) has a unit root
t-Statistic Prob.*
Augmented Dickey-Fuller test statistic -5.234410 0.0000
Test critical values: 1% level -3.546099
5% level -2.911730
10% level -2.593551
Null Hypothesis: D(GECS) has a unit root
t-Statistic Prob.*
Augmented Dickey-Fuller test statistic -7.616968 0.0000
Test critical values: 1% level -3.546099
5% level -2.911730
10% level -2.593551
Null Hypothesis: D(TGE) has a unit root
t-Statistic Prob.*
Augmented Dickey-Fuller test statistic -4.973764 0.0001
Test critical values: 1% level -3.546099
5% level -2.911730
10% level -2.593551
20
One should see that all the variables have the same order of integration on the different levels, which implies that the economic indicators move together over time (Engle and Granger, 1987).
3.7 Cointegration
According to Engle and Granger (1987), when the different time series are moving together, a linear combination of the series can be found, which assumes a long run equilibrium relation between the three indicators. This characteristic is called cointegration. In order toprove this assumption with the test variables of the thesis a cointegration test should be executed. In the thesis the Johansen’s cointegration test was used.
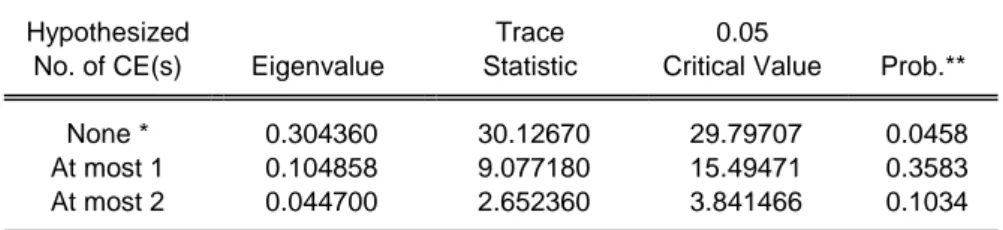
Table 6. Johansen’s cointegration test
Sample (adjusted): 1954 2011
Included observations: 58 after adjustments
Series: GDP TGE GECS
Lags interval (in first differences): 1 to 2 Unrestricted Cointegration Rank Test (Trace)
Hypothesized Trace 0.05
No. of CE(s) Eigenvalue Statistic Critical Value Prob.**
None * 0.304360 30.12670 29.79707 0.0458
At most 1 0.104858 9.077180 15.49471 0.3583
At most 2 0.044700 2.652360 3.841466 0.1034
Trace test indicates 1 cointegrating eqn(s) at the 0.05 level * denotes rejection of the hypothesis at the 0.05 level **MacKinnon-Haug-Michelis (1999) p-values
Source: UK public spending (2011)
The results are indicating that the three variables are cointegrated, since the null-hypothesis that there is no cointegration among the variables was rejected on a 5 percent significance level as it is shown at the first line of the results. Both “At most 1” and “At most 2” were accepted by the EViews.
The unit root and cointegration tests proved that in the UK the GDP, the total governmental expenditures and the governmental expenditures on the culture are processes, which not just have the same movement, but they are cointegrated. In other words, one can find a long term equilibrium relationship between them. These properties are the underlying basic requirements, which allow the execution of the Granger causality test (Granger, 1969).
3.8 Granger causality test
Having seen that the variables are moving together and cointegrated, the nature and direction of causality can be tested with the Granger causality test (Granger, 1969). Under the notion
21
Granger causality the following statistical idea is meant: One can say that x Granger causes y, if current y can be estimated from the past values of y and then the added x values improving the original estimation of the model.
”It is important to note that the statement “x Granger causes y” does not imply that y is the effect or the result of x. Granger causality measures precedence and information content but does not by itself indicate causality in the more common use of term” (EViews, 2010). The 3 models’ six hypothesizes are shown on the following table. One can accept the null-hypothesis, when the obtained value of the F-statistic is bigger than the probability’s value.
Table 7. Granger causality test for the models
Model [1].
Pairwise Granger Causality Tests Sample: 1951 2011
Lags: 3
Null Hypothesis: Obs F-Statistic Prob.
GECS does not Granger Cause GDP 58 0.36124 0.7812
GDP does not Granger Cause GECS 0.30811 0.8194
Model [2].
Pairwise Granger Causality Tests Sample: 1951 2011
Lags: 3
Null Hypothesis: Obs F-Statistic Prob.
GECS does not Granger Cause TGE 58 3.06057 0.0363
TGE does not Granger Cause GECS 0.90398 0.4457
Model [3].
Pairwise Granger Causality Tests Sample: 1951 2011
Lags: 3
Null Hypothesis: Obs F-Statistic Prob.
TGE does not Granger Cause GDP 58 0.11258 0.9524
GDP does not Granger Cause TGE 3.34667 0.0261
Source: UK public spending (2011)
3.9 Results
At Model [1]. both F-statistic values (0.361 and 0.308) are smaller than the probability values (0.781 and 0.819), which indicates both null-hypothesizes should be rejected. At Model [2]. one should accept both hypothesizes, since their F-Statistic values (3.06 and 0.903) are bigger
22
than the probability values (0.03 and 0.445). At Model [3]. the GDP does not Granger Cause TGE should be accepted, since its F-value is 3.34 while the probability is 0.02. The TGE does not Granger Cause GDP should be rejected, in this case the F statistic value (0.11) is smaller than the probability (0.952).
The results of the analysis about possible connections and relations between the governmental expenditures on cultural services, the total governmental expenditures and the GDP are the followings: the three variables are moving together over time and they are cointegrated, so there is a long term equilibrium relationship among them. The GDP and the cultural expenditures in the UK Granger causing each other. This indicates a bidirectional relationship. On the other hand when the Granger causality connection between the total governmental expenditures and the expenditures on the culture is discussed, no evidence was found, that one time series can explain the other. In the third case between the total governmental expenditures and the GDP the Keynesian (Keynes, 1936) findings were proven. In other words the Granger causality runs just in one way, from the TGE to the GDP.
23
4. Conclusion
In this part of the thesis the descriptive analysis and empirical results are introduced.
The cultural sector in the United Kingdom is having its second renaissance. Over the last ten years more than 1.5 billion pounds was spent annually by the UK’s government to maintain the culture sector and make it attractive to the tourists. However this picture is about to change. The negative economical effects reached the western world’s policy making and it implied restrictions in the budget. In this new situation a question emerged, which became the main discussion of the thesis: From a macro perspective is there any relation between the cultural sector in a country and the performance of the economy?
In the thesis the descriptive analysis has two main focuses, a theoretical part and a historical approach. In the theoretical part it is shown that the role of the government became to distribute and reallocate the resources from its income (Wicksell, 1896; Samuelson, 1954). The role of reallocation evolved in order to shorten or prevent the negative effects of the market failures (Bator, 1958), which can result in under provision of the public goods on the market (Pigou, 1947; Musgrave, 1959). These characteristics of the public goods explain the justification of the governmental interventions on the market mechanisms (Mancur, 1965).
In the historical analysis the United Kingdom’s cultural sector is discussed in details to present the theoretical framework idea. In this part the UK cultural sector is broken up in two parts: segments run and owned by the government, such as public museums, libraries and heritages and segments where the government has less- and the private sector has more influence. The latter sector is called the art industry. In order to show the market failures and the need (and justification) for governmental interventions in the cultural sector a limitation was created: the main focus of the thesis become on the art sector. There are several main organization types functioning on the art market, for example music or visual arts institutions. They have a complex financial cash-flow system, where the UK government has a leading role. For these institutions the grants from the state and local authorities are covering more than half of their overall income.
The need for a strong governmental intervention on the arts market appeared since two main market failures occur in the art sector: high fix cost of the institutions (Powell, 2006) and cost disease (Baumol & Bowen, 1965). These failures are coming from the fact that the art sector cannot use for its production economies of scale and scope in a great extent, unlike the manufacturing segments of the market. The productivity lag between the two sectors are implying the manufacturing sector can keep up with the effects of the economic growth (growing salaries), the art sector needs external support in order to ease this effect. The last part of the historical analysis examines, why the governmental intervention is a justified action. There are a number of efficiency and equity arguments, such as positive externalities, spillover benefits or national prestige (Pigou, 1952; Coase, 1960; Cornes, 1999; Musgrave; 1959).
In the third part of the thesis the UK cultural sector is examined empirically in order to find the answer to the thesis’s question: is there any relation between the performance of the
24
economy (GDP), the total governmental expenditures (TGE) and the governmental expenditures on the cultural services (GECS). The thesis uses time series analysis for these three variables on a 60 year timeline and built up three different bivariate VAR models. With the time series analysis it is possible to see causality between them. It was found that the GDP, TGE and GECS are moving together over the time, and they are cointegrated, in other words they have a long term equilibrium relationship among them.
We tested the hypothesizes with a Granger causality test, which can be executed if the variables are meeting the requirements above. The Granger causality is not indicating direct causality between two variables; however it can explain trends and forecasting. It was found that there is a bidirectional Granger causality between the GDP and GECS, however no causality evidence was found between the GECS and TGE. In the third case between the TGE and the GDP the Granger causality runs just in one way, from the TGE to the GDP.
The results imply that there is no direct connection between the GDP and the governmental expenditures on culture. While the GDP is driven by many external and internal factors of the economy and society, it was shown the level GECS is purely based on the government’s fiscal policy.
However on the other hand the final findings about an informal relation between the governmental expenditures on the cultural sector and the GDP are proven, moreover it is representing the current negative events occurring in the UK economy, the growth of the unemployment and external debt. Recently the UK government decided to significantly decrease the amount of expenditures on the cultural sector for sakes of budget consolidation (Cultural Policies, 2011).
25
References
Abbing (2004), Why Are Artists Poor? The Exceptional Economy of The Arts, Page. 178,
211. Amsterdam University Press
Andersson (2006), The Economics of experiences, the arts and entertainment, Page. 34.
Edward Elgar Publishing Ltd
Bator (1958), The Anatomy of Market Failures, Page. 351-379. The Quarterly Journal of
Economics, Vol. 72, Issue 3. Harvard University Press
Baumol & Bowen (1965), On the Performing Arts: The Anatomy of Their Economic
Problems, Page. 495-502. The American Economic Review, Vol. 55, Issue1/2, American Economic Association publication
British Journal (2010), British Journal Online:
http://www.bjp-online.com/british-journal-of-photography/news/1686599/government-cuts-arts-council-englands-budget article by: Olivier Laurent
Buchanan (1949), The Pure theory of Government Finance, Page. 496-505. Journal of
Political Economy, Issue 57. The University of Chicago Press
Caves (2001), Creative Industries, Contract Between Arts and Commerce Page. 221.
Industries Harvard University Press
Cheng and Lai (1997), Government Expenditure and Economic Growth in South Korea: A
VAR Approach. Page. 11-24. Journal of Economic Development, Vol. 22. no. 1.
Coase (1960), The Problem of Social Cost, Journal of Law and Economics The University of
Chicago Press
Cornes and Sandler (1999), The Theory of Externalities, Public Goods and Club Goods,
Page. 8-10, 32, 39-66, 179. 2nd edition, University of Cambridge Press.
Council (2006), Arts Council England Annual review, Page. 48.
Council (2010), Arts Council England: Annual review, Page. 9, 10, 26, 97, 98, 99.
Cultural Policies (2011), Compendium Cultural Policies and Trends in Europe, Council of
Europe/ERICarts: http://www.culturalpolicies.net/web/unitedkingdom.php?aid=421
Demirbas (1999), Co-integration Analysis-Casualty Testing and Wagner’s Law: The Case of
26
Dickey (1979), Distribution of the Estimators of Autoregressive Time Series with a Unit Root.
Vol. 74. Page. 427-431. Journal of the American Association,
Engle and Granger (1987), Co-integration and Error Correction: Representation
Estimation, and Testing. Econometrica, Vol. 55. Page. 251-276.
Eviews (2010), EViews 7 User’s Guide I-II. Page. 443 Quantitative Micro Software
copyright.
Faiola (2010), Anthony Faiola, Washington Post 2010. aug.4.
http://www.washingtonpost.com/wp-dyn/content/article/2010/08/03/AR2010080306964.html?hpid=topnews
Frey (2000), Arts and Economics, Analysis and Cultural Policy in John Knell: The Art of
Living (2007) Page. 33, 34.
Granger (1969), Investigating causal relations by econometric models and cross-spectral
methods. Econometrica Volume. 37 Page. 424–438.
Hutton (2007), Staying Ahead: The Economic Performance of the UK’s Creative Industries.
Page.6. The Work Foundation study
KEA (2006), European Affairs: The Economy of Culture in Europe Page. 45-47. (for the
European Commission)
Keynes (1936), The General Theory of Employment, Interest and Money, Palgrave Macmillan
Publication
Kulturfonden (2008 ), Official webpage of the Kulturfonden organization
http://www.kulturfonden.fi/eng/
Mancur (1965), The Logic of Collective Action: Public Goods and the Theory of Groups
Page. 9 – 16, 62. Harvard University Press
Musgrave (1959), The Theory of Public Finance, Page. 33 – 43,143. McGraw-Hill Book
Company
Musgrave and Musgrave (1989), Public Finance in Theory and Practice, McGraw-Hill
Book Company New York: Modern Library
O’Brien and Feist (1995), Employment in the arts and cultural industries: an analysis of the
27
Parliament UK (2010), Official webpage of the UK’s parliament
http://www.publications.parliament.uk/pa/cm201011/cmselect/cmcumeds/writev/464/057.htm
Peacock (2000), Public Financing of the Arts in England, Page. 174, 175. Fiscal Studies
Vol.21, no. 2. Institute of Fiscal Studies press.
Peacock and Scott (2000), The curious Attraction of Wagner’s Law, Public Choice Vol.102
Page. 1-17.
Pigou (1947), A Study in Public Finance, McMillan and Co. publication London
Pigou (1952), The Economics of Welfare, Page. 27. 4th Edition, McMillan and Co. publication London
Powell (2006), The Nonprofit Sector: A Research Handbook. 2nd edition, Page.443-444. Yale University Press.
Pratt (1997), The Cultural Industries Sector: its definition and character from secondary
sources on employment and trade. Research Papers in Environmental and Spatial Analysis No. 41.
PSI (1993), Cultural Trends Volume 20: Employment in the cultural sector. Policy Studies
Institute press
Samuelson (1954), The Pure Theory of Public Expenditures, Page: 337-389. Rev. Econ. and
Statis. Issue: 36-4
Santagata and Signorello (2000), Contingent Valuation of a Cultural Public Good and
Policy Design: The Case of “Napoli Musei Aperti”, Page. 181-204. Journal of Cultural Economics Vol. 24. Kluwer Academic Press.
Selwood (2001), The UK cultural sector: profile and policy issues. Policy Studies Institute
press
Sica (2010),SICA Dutch Centre for International CulturalActivities: http://www.sica.nl/en/node/32703
Singh and Sahni (1984), Causality between Public Expenditure and National Income. The
Review of Economics and Statistics, Vol. 66 Page. 630-644
Smith (1937), The Wealth of Nations, Page. 423.
Smith (1982), Theory of Moral Sentiment, Page. 184, 185. Oxford University Press Thorsby (2001), Economics and Culture Page. 112-113. Cambridge University Press
28
Thorsby (2003), Determining the Value of Cultural Goods: How Much (or How Little) does
Contingent Valuation Tell Us?, Page. 275-285. Journal of Cultural Economics Vol. 27. Kluwer Academic Press.
Thorsby (2004), Economics and Culture Page. 69, 134, 13, 23 Cambridge University Press. Toda and Yamamoto (1995), Statistical Interference in Vector Autoregressions with
Possibly Integrated Processes, Journal of Econometrics Volume: 66 (1-2) Page. 225-250.
Toepler (2002), Subsidizing The Arts, in Diana Crane: Global Culture Page. 29. Routledge
publication
Towse (1994), Achieving Public Policy Objectives in the Arts and Heritage, in Alan Peacock:
Cultural Economics and Cultural Policies, Page. 145 - 147,150, 153. Kluwer Academic Publication
UK public spending (2011), www.ukpublicspending.co.uk. The official government website
for the transparency of public spending.
Wagner (1883), Three Extracts of the Public Finance, in David Cameron: The Expansion of
the Public Economy: A Comparative Analysis. The American Political Science Review, Vol.72. No. 4 (1978) Yale University Press
Walras (1977), Elements of Pure Economics, A. M. Kelley publication
Wickshell (1896), A New Principle of just Taxation, In: Richard Musgrave and Alan Peacock
29
Tables and figures
Table 1: Categorization of goods, Page 5.
Table 2: Descriptive statistics of the variables, Page 17.
Table 3: Correlation matrix, Page 18.
Table 4: Unit root test on non-differentiated level, Page 18.
Table 5: Unit root test on first differentiated level, Page 19.
Table 6: Johansen’s cointegration test, Page 20.
Table 7: Granger causality test for the models, Page 21.
Figure 1: The distribution of the regularly founded art organizations by the Council, Page 9.
Figure 2: Funding the arts and heritages, Page 10.
Figure 3: Break down of total income by artform in England, Page 12.
Figure 4: GDP and Total governmental expenditures in the UK (1951-2011), Page 16.


![Table 7. Granger causality test for the models Model [1].](https://thumb-eu.123doks.com/thumbv2/5dokorg/4669214.121863/24.892.113.615.486.566/table-granger-causality-test-models-model.webp)
