School of Innovation, design and engineering
Västerås, Sweden
Thesis for the Degree of Master of Science (120 credits) in Computer Science, with
specialization in Software Engineering - DVA501 - 30.0 credits
Evaluation of Automated Test Generation for
Simulink: A Case Study in the Context of
Propulsion Control Software
Anton Roslund
ard15003@student.mdh.se
Supervisor: Eduard Paul Enoiu
Mälardalens University, Västerås, Sweden
Supervisor: Raluca Marinescu,
Bombardier Transportation, Västerås, Sweden
Examiner: Wasif Afzal
Mälardalens University, Västerås, Sweden
Abstract
Automated Test Generation (ATG) has been successfully applied in many domains. For the mod-eling and simulation language Simulink, there has been research on developing tools for ATG with promising results. However, most tools developed as part of academic research and are not publicly available, or severely limited in their ability to be integrated into an industrial workflow. There are commercial ATG tools for Simulink, with Simulink Design Verifier (SLDV) as the de-facto standard tool.
For this thesis, we perform an empirical comparison of manual tests to those generated by SLDV. For the comparison, we used 180 components from the propulsion control software developed by our industry partner. All except two components are compatible for test generation to some extent. The majority of components are partially compatible, requiring block replacement or stubbing. Ap-proximation of floating-point numbers is the primary reason for block replacement, which can be performed automatically by SLDV. Two components were incompatible, and 14 required full stub-bing of blocks.
Using a pre-processing step, the generated tests achieve similar coverage as the manual tests. We performed a Mann–Whitney U test with the hypothesis that the generated tests achieve higher cover-age than the manual tests. There are no statistically significant differences for either decision cov-erage (p= 0.0719), or condition coverage (p = 0.8357). However, for Modified Condition/Decision Coverage, the generated tests achieve higher coverage, and the difference is significant (p= 0.0027).
The limitations of ATG were explored by looking at the cases where the generated tests achieved lower coverage than the manual test. We found that the use of floating-point arithmetic and tem-poral logic increases the time required for test generation, and causes the analysis to hit the time limit. The test generation does not support all custom S-functions and perform stubbing of these blocks. This made the tool unable to reason about persistent storage. Configuration constants have limited support, which was the reason for the coverage difference in three cases.
We have concluded that while much effort is required for custom tooling and initial setup, ATG can prove useful for early fault detection in an industrial workflow. ATG would prove especially useful in an automated continuous integration workflow for integration-level conformance testing.
Contents
1 Introduction 1
2 Background 2
2.1 Software Testing . . . 2
2.1.1 Coverage . . . 2
2.2 Automated Test Generation . . . 2
2.2.1 Test Input Generation . . . 3
2.2.2 Test Oracles . . . 4
2.3 MATLAB Simulink . . . 4
2.4 Testing Simulink Models . . . 5
2.4.1 Simulink Test . . . 5
2.4.2 Simulink Coverage . . . 6
2.4.3 Simulink Design Verifier . . . 7
3 Related Work 8 3.1 State of the Art: Test Generation Techniques for Simulink . . . 8
3.2 State of the Practice: Applying Test Generation in Industry . . . 10
4 Problem Formulation 11 4.1 Research Questions . . . 11
5 Method 12 6 Context of the Case Study 13 6.1 Software Architecture . . . 13 6.2 A Software Component . . . 13 6.3 Configuration Constants . . . 14 7 Experimental Setup 15 7.1 Experiment Subjects . . . 15 7.2 Hardware Setup . . . 15
8 Test Input Generation 16 8.1 Coverage Filter . . . 16
8.2 Pre-processing and configuration . . . 16
9 Empirical Comparison 18 10 Conformance Testing 19 11 Results 20 11.1 Test Generation Process Metrics . . . 20
11.2 Coverage Metrics and Comparison . . . 22
11.2.1 Per Component Coverage Difference . . . 23
11.2.2 Reasons for Coverage Difference . . . 24
11.3 Test Metrics . . . 25
11.4 Input Data Signal Comparison . . . 26
11.5 Conformance Testing . . . 27
12 Discussion 28 12.1 Empirical Comparison . . . 28
12.2 Limitations of Automatic Test Generation . . . 28
12.3 Validity . . . 29
14 Conclusions 31
References 32
List of Figures
1 A venn diagram representing the state of software behaviour. . . 2
2 Overview of Automated Test Generation. . . 3
3 Example of a Model Based Design workflow. . . 5
4 A test harness with a test sequence and data logging of the output signals. . . 6
5 Example of input signals for a test case. . . 6
6 The Simulink block S-R Flip-Flop. . . 7
7 The hierarchical architecture of propulsion control software developed at Bombardier. 13 8 A simplified example of a Simulink model of propulsion control software component. 14 9 Box plots depicting coverage of with and without feature flags. . . 17
10 The number of replaced blocks per model. . . 20
11 Average time per component for test generation. . . 21
12 The percentage of components for which the test generation process did timeout. . 21
13 Box plots depicting coverage of generated tests and manual tests. . . 22
14 Absolute decision coverage difference betweenΛ30 mcdm and manual tests. . . 23
15 Absolute condition coverage difference betweenΛ30 mcdm and manual tests. . . 23
16 Box plots depicting test metrics of generated tests and manual tests. . . 25
17 Test Input signals from the manually created test. . . 26
18 Test input signals automatically generated. . . 26
List of Tables
1 Overview of ATG approaches for Simulink . . . 82 Information of the models in the component experiment. . . 15
3 The test generation trials. . . 16
4 The number of models compatible with SLDV. . . 20
5 Identified reasons for block replacement. . . 20
6 The relative percentages of coverage objective from the test generation trials. . . . 21
7 Mean coverage values. . . 22
8 Identified main reasons for lower coverage of Λ30 mcdccompared to manual testing. . 24
List of Listings
1 Pre-Pocessing . . . 172 SiL Pre-Pocessing . . . 19
List of Acronyms
ATG Automated Test Generation. HiL Hardware-in-the-Loop.
MC/DC Modified Condition/Decision Coverage. MiL Model-in-the-Loop.
PiL Processor-in-the-Loop. SiL Software-in-the-Loop. SLDV Simulink Design Verifier. SUT System Under Test.
1
Introduction
Software development of safety-critical systems has to follow safety-regulations and standards. These standards require rigorous testing practices. Software testing is a practice to gain confidence that the System Under Test (SUT) work as intended. In the safety-critical domain, the aim of software testing is often to find faults as early in the development process as possible.
ATG is the process of generating test-cases automatically, reducing the time required for manual testing. There are many approaches to ATG. Test input can be generated from a formal specifica-tion, or the implementation of the SUT. Automated Test Generation (ATG) has been successfully deployed in many domains, and tools exist for high-level languages, e.g., Java or C#.
Model-based design has become common in the safety-critical domain. Control systems are cap-tured as models, from which performant low-level code can be generated. Simulink [1] is a de-velopment and simulation language that is widely used for Model-based design in the embedded system industry. To avoid the introduction of defects and to ensure that failures are identified as early as possible, it is of utmost importance to ensure that Simulink software satisfies functional safety requirements.
Model-based design allows for testing to be performed early in the development process, on different integration levels. In an industrial workflow, ATG could potentially complement manual testing to provide fault detection early in the development process. One area for which ATG could prove particularly useful is integration-level conformance testing.
Several approaches for ATG for Simulink have been proposed in literature, many of which out-preforms commercial tools in some aspect [2–11]. Despite the past academic research on Automated Test Generation, there are relatively few successful deployments of tools for testing and verification of Simulink models. Many of the approaches proposed in the literature are realized as research prototypes, not ready for adoption in industry. Most research prototypes are not publicly available, and those that are have not been updated or maintained after the research project ended. In this thesis, we have explored and evaluated the potential of ATG in an industrial context. The thesis was performed as a case study, carried out in the context of an industrial propulsion control software developed by our industry partner. The de-facto standard tool for ATG for Simulink, SLDV, was empirically compared to the existing manual tests for 182 software components. The empirical comparison focused on coverage and cost. The limitations of the tool was explored in terms of model compatibility and an investigation into the reasons for the coverage difference of manual and generated tests.
Our results show that, with a pre-processing step, it is possible for the generated test to achieve sim-ilar decision and convection coverage as the existing manual tests. For Modified Condition/Decision Coverage (MC/DC) the generated test achieve significantly higher coverage.
The remainder of the thesis is structured as follows: Section 2 provides background on software testing, Automated Test Generation (ATG), and MATLAB Simulink. Section 3 surveys related work, both state of the art and state of the practice. We present research on methods and tools used for ATG for Simulink models and applications of ATG in an industrial context. The problem formulation and research questions are presented in Section 4. The research method used is de-scribed in Section 5. Then, in Section 6, we describe the current development and testing practices of our industry partner, which is the bases of this case study. Section 7, describes the experimental setup and the models used for the case study. Section 8 presents the process of test generation and our pre-processing step. The process of the empirical comparison is described in Section 9, and in section 10, the process of using the generated test for conformance testing. In Section 11, we present and explain our results. In Section 12, we discuss our results in relation to related work, and analyze threats to validity. Ideas for future work is presented in Section 13, and we end with our conclusions in Section 14.
2
Background
This section provides background on software testing, automated test generation, MATLAB Simulink, and how Simulink models are tested.
2.1
Software Testing
Software testing [12] is a practice to gain confidence that the software works as intended. While software testing is a practical task, non-technical considerations need to be made. Ideally, we would like to test all possible permutations of inputs for a software. This is not practical, and for any reasonable complex software it is not feasible. Software testing is generally considered to be a time-consuming task, and by extension expensive.
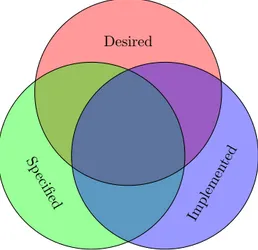
Consider the venn diagram in figure 1. Ideally, the behaviour of a piece of software should be desired, specified and implemented. Generally, software testing focuses on two things, finding behaviour that is implemented and undesired (i.g, software bugs), and verifying that the specified software behaviour is implemented.
Desired
Sp ecified
Implemen ted
Figure 1: A venn diagram representing the state of software behaviour.1
In the safety critical domain, the main goal of software testing is to detect faults as early as possible since the cost of fixing faults increases over time.
2.1.1 Coverage
Coverage is a measurement of a tests ability to exercise the behaviour of the SUT [12]. Decision coverage, also known as branch coverage, measures the coverage of the branches of every decision point. For an if statement, both the then and else branches need to be taken at least once to achieve full coverage of the statement. Condition coverage, also known as predicate coverage, requires all boolean expressions to evaluate to both true and false. Modified Condition/Decision Coverage (MC/DC) requires conditions to independently be able to affect decision outcome.
2.2
Automated Test Generation
Automated Test Generation (ATG) is the process of generating test-cases automatically given a test goal. ATG is a concept studied in many research areas and seldom defined in general terms. In a paper from 1990 [13], Korel defined a test-data generator as “a tool which assists a programmer in
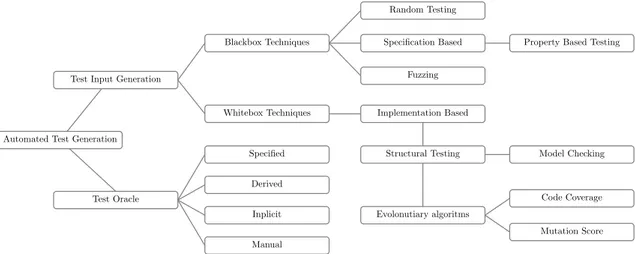
the generation of test data for a program”. However, ATG also includes evaluating the results of a test to distinguish if the SUT behaves correctly or not. This is the responsibility of the test oracle. ATG can be applied at many integration levels, e.g. unit-level or system-level. Many approaches exist, Anand et al. [14] have surveyed the area and present techniques, tools, and areas of research. A none exhaustive overview of techniques for ATG can be seen in Figure 2.
Automated Test Generation Test Input Generation
Test Oracle Whitebox Techniques Blackbox Techniques Specified Derived Inplicit Manual Random Testing Fuzzing
Specification Based Property Based Testing
Structural Testing Implementation Based Model Checking Evolonutiary algoritms Code Coverage Mutation Score
Figure 2: Overview of Automated Test Generation and some techniques.
2.2.1 Test Input Generation
Test input generation can be either dynamic or static, depending on if the execution of the SUT is involved or not. There are whitebox and blackbox approaches, classified by if the SUT structure or source code is used in the generation process. In this section, we give a short description of some input generation techniques that can be used for automated test generation.
Random testing [15] is, as the name suggests, based on randomly generating inputs. It is a static blackbox approach, meaning that the inner workings of the System Under Test (SUT) can be unknown. Typically, the ranges of the generated input are constrained by the interface of the SUT.
Fuzzing [16] is another blackbox approach. Fuzzing focuses on actively trying to break the SUT. This can be done by supplying inputs outside the range of the interface of the SUT, or sending input to rapidly for the SUT to handle. Fuzzing tries to ensure the absence of vulnerabilities in the SUT.
Search-based test generation are whitebox techniques. It will try to maximize a test objective, com-monly a structural coverage objective. Typical approaches involve using evolutionary algorithms or Model-checking. One example of a search-based approach to test generation is EvoSuite [17]. Model-checking works by transforming the implementation into a model. A model-checker is used to try to solve for coverage, expressed as a reachability problem.
The mutation score from mutation testing can also be used as a search criterion [2]. Mutation testing [18] is a technique to evaluate the quality of a test suite. The thinking is that a test suite should be able to detect changes to the system under test (i.e. if the system is changed, at least one test should fail). A predefined number of mutants are created by making changes to the system under tests. This is done using mutation operators (e.g. changing operators or values of variables). The test suite is then run against the system under test, with the goal to “kill" the mutants. Not being able to kill a mutant does not necessarily mean that the tests are inadequate, there is the possibility that the mutation creates a mutant functionally identical to the original. Therefore, all alive mutants need to be compared manually to the original.
Specification-based testing [19] focuses on testing the specified software behavior, as compared to implementation-based techniques that focus on the implemented behavior. To automatically
generate test input from specification, a formal specification language is needed. The use of a formal specification is what sets specification-based testing apart from functional testing based on requirements.
Property-based testing is a specification-based input generation approach. It relies on generators to create different types of inputs, such as classes, numbers, or text. It then tries to prove the specified properties of the output. If test input that disproves the specified property is found, a counter-example is provided. First, it will try to shrink the test input, so to provide the user with a minimum input that still disproves the specified property. Property-based testing was popularized by QuickCheck [20], a testing tool for Haskell.
2.2.2 Test Oracles
A test oracle is something to decide whether or not the software behaves as expected, given the provided test input. Barr et al. [21] categorize and describes test oracles and approaches for oracle automation. They define four categories of oracles: specified, derived, implicit, and manual. Specified test oracles are explicitly created using assertions in the test. The test oracle can also be derived from the software specification. It can be derived from both functional and non-functional requirements. If the requirements are specified in a formal specification language, the oracle can be derived automatically.
Implicit oracles are when SUT the test can be assumed to misbehave without knowledge of the expected output of the SUT. One example of an implicit oracle is run-time crashes and exceptions. If some kind of instrumentation is present so that the SUT can be observed while running, overflows and subnormal floating-point values can be treated as errors by an implicit oracle. A challenge for ATG in the safety-critical domain is test oracles. Implicit test oracles are often insufficient since run-time crashes and exceptions are rare.
In the safety-critical domain, it is common for ATG tools to rely on manual oracles. When employing manual oracles, it is desirable to have small test-suites and short test-sequences since the output has to be manually validated.
2.3
MATLAB Simulink
Simulink [1] is a graphical block-programming tool for modeling, simulation, and analysis of sys-tems. It supports generating low-level code from a model with the same behavior. Each block has a set of in-ports and out-ports connected to other blocks using signals. An example of a Simulink model can be seen in figure 8.
A signal is a line from the outport of one block to the inport of another block. A signal has a specified data type. It is also possible to specify “auto” to use type inference. Signal ranges can be used to further constrain the input values the signal caries. It is then possible to specify if Simulink should show a warning or throw an error is this range is violated. Blocks can also have specified ranges, is especially useful for inport and outports, which define the interface of a subsystem or model.
Simulink includes a library of fundamental blocks that are used to create models. Some examples of common library blocks are: add, logical operators, such as xor, and discrete-time in-tegrator. It is possible to create a library containing custom blocks. Custom blocks can be composed of blocks from the standard library, or code in either MATLAB, C, C++, or Fortran using so-called s-functions.
Sub-systems provide a way to group a subset of the model’s blocks together. A sub-system can be virtual, meaning that it only visually groups the blocks, or non-virtual allowing for conditional, and atomic execution. Sub-systems can be masked, which hides the underlying implementation of the sub-system. The mask has the possibility to take parameters which will be used to set constant values in the masked sub-system.
2.4
Testing Simulink Models
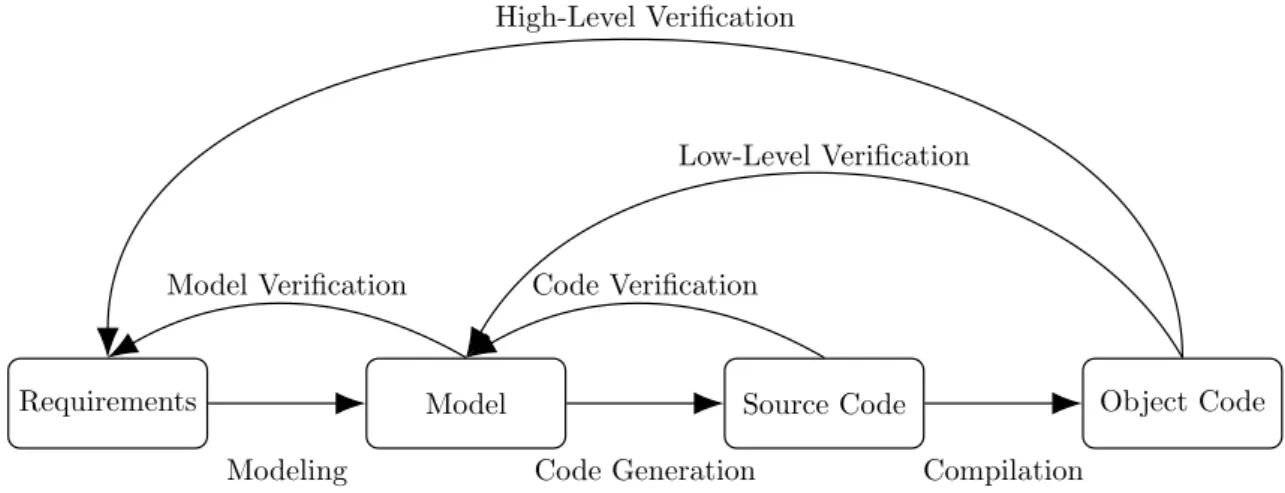
Requirements Model Source Code Object Code
Modeling Code Generation Compilation Model Verification Code Verification
Low-Level Verification High-Level Verification
Figure 3: Example of a Model Based Design workflow.
The testing of Simulink models can be performed on different integration levels. A test suite should support being used at different integration levels during the development process. Commonly, the following integration levels are distinguished:
• Model-in-the-Loop (MiL): The system under test and its environment are simulated and tests run against this simulation in the modeling framework.
• Software-in-the-Loop (SiL): Low-level code is generated from the model of the system under test. SiL test can reveal faults in the code generation process.
• Processor-in-the-Loop (PiL): The compiled object code is run on the target processor and architecture (or an instruction set simulator). The environment is simulated and signals provided directly to the processor. PiL tests are important because they can reveal timing differences and faults in the target compiler or processor architecture.
• Hardware-in-the-Loop (HiL): The test are run on the target hardware. Commonly per-formed as part of a larger full system test.
Testing of Simulink models is most commonly performed within Simulink using first-party testing tools, such as Simulink Test. For Automated Test Generation (ATG), there are commercial tools available for testing and verifying Simulink models that support ATG. Commercial tools commonly mentioned in literature are Reactis [22], BTC Embedded Tester [23], and T-VEC Tester [24]. However, the de-facto standard is Simulink Design Verifier (SLDV) [25,26], a commercial testing toolbox from MathWorks. SLDV integrates with Simulink and is used for validating and verifying Simulink models.
2.4.1 Simulink Test
Simulink Test [27] is a toolbox with tools for testing Simulink models. Simulink Test Manager provides a rich interface for organizing and executing test cases and visualizing results. A test case consists of time-series data since Simulink works with signals over time. Simulink Test Manager supports different types of test types, these are:
• Baseline Test: Compares the simulation output with a recorded baseline from a previous simulation of the model. Normally used for regression testing.
• Equivalence Test: Performs two simulations and compare the outputs. Can be used to compare the output of two models, different versions of a model, or a signal model under different configuration.
• Simulation Test: Performs simulation with no criteria. • Real-time Test: Performs simulation on a real-time target.
Signal spec. and routing Inport Inport1 Out1 Out2
Test Sequence Model Under Test
Figure 4: A test harness with a test sequence and data logging of the output signals.
Test Harness
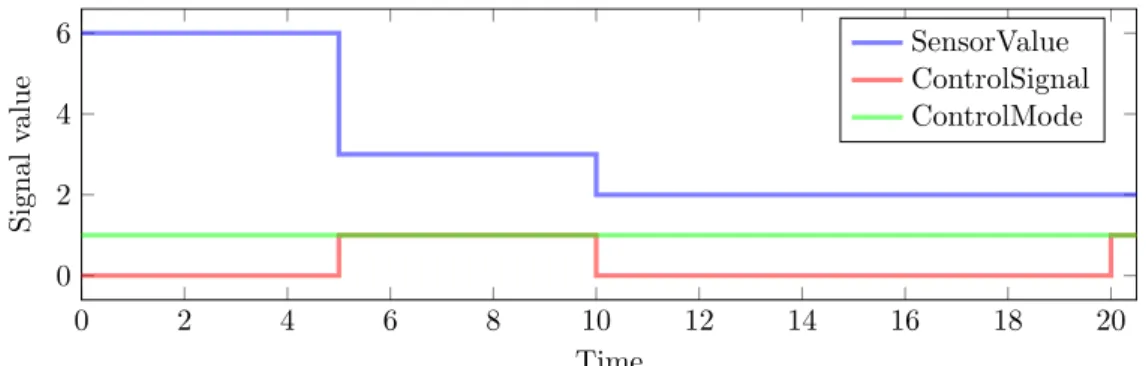
A test harness provides an isolated environment for testing components or full models. The test harness itself is a model to provides inputs and monitors outputs for the component under test. The test inputs are signals with values over time, as visualized in figure 5. In a test harness these signals are normally produced by special blocks such as signal builder, signal editor, or test sequence. However, any library block or reference model can be used in a test harness. A typical test harness for a baseline test can be seen in figure 4. For this test harness, the test input are provided by a test sequence block and the output is logged and attached to terminators.
0 2 4 6 8 10 12 14 16 18 20 0 2 4 6 Time Signal value SensorValue ControlSignal ControlMode
Figure 5: Example of input signals for a test case.
2.4.2 Simulink Coverage
Simulink Coverage provides coverage information captured during simulation of the models. It is worth noting that not all blocks have all types of coverage. For example a gain blocks has no coverage, switch has only decision coverage, and a relational operator has only condi-tion coverage. For detailed informacondi-tion on what blocks report what kinds of coverage, we refer the reader to MathWorks documentation.By default, Simulink Coverage uses masking for MC/DC, and this means that sub-conditions are not evaluated individually. In addition to coverage, Simulink Coverage also reports the cyclomatic complexity of models. That is the number of linearly inde-pendent paths, which indicates the overall complexity of a model.
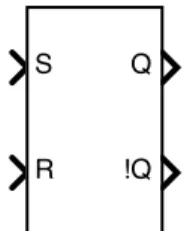
Full coverage is not possible on some blocks and models. For example, the Simulink library block s-r flip-flop that can be seen in figure 6. When the input S (set) is true the output Q is true
S
R Q
!Q
Figure 6: The Simulink block S-R Flip-Flop.
until R (reset) is true. The output Q! is the compliment of Q. For this block it is advised to avoid the state where both S and R are true, this will cause both output to be true. For this block, it is not possible to have both outputs to be false at the same time.
2.4.3 Simulink Design Verifier
Simulink Design Verifier (SLDV) [25,26], is the de-facto standard tool for validating and verifying Simulink models. Using automatic theorem-proving and model-checking technologies, it provides automated test-case generation and property proving. SLDV can operate in three different modes: Design Error Detection, Test Generation, and Property Proving. For design error detection, it can detect several different errors, e.g., dead logic, overflows, division by zero, and specified minimum and maximum value violations. In property proving mode, the objectives are manually specified using Simulink as a specification language. Assertion blocks will be used by the model-checker to prove that the assertions can never be raised. The assertion blocks also enable online test execution, stopping simulation if an assertion fails. For design error detection and property proving, SLDV provides counterexamples.
SLDV supports a subset of the modeling language, the same subset as supported by the code generation with a few exceptions. For unsupported blocks, SLDV can autocratically perform subbing, and the user can manually specify block replacement rules. SLDV approximates floating-point arithmetic with rational number arithmetic.
Test generation is based on a user-specified coverage objective. SLDV relies on Simulink Coverage for measuring the coverage during test generation and of the generated tests. The test generation can use both the model and the generated production code as a target for the coverage objective. SLDV accepts a coverage filter of objectives to exclude during test generation. It is also possible to provide a coverage report that SLDV will try to extend as to achieve any missing coverage. SLDV can generate HTML and PDF reports of the process that are beneficial when manually analyzing the results. SLDV has integration with Simulink and Simulink Test. It is possible to present the test generation coverage on the model visually. There is integration to generate a harness model and export the generated test cases to Simulink Test. Simulink Test provides the ability to use SLDV to extend existing test cases using SLDV to capture missing coverage.
3
Related Work
This section presents some related work. Section 3.1 presents the state of the art, focusing on the research prototypes and evaluation of tooling for Automated Test Generation (ATG) for Simulink models. Section 3.2 presents the state of the practice, more broadly on how ATG can be applied in an industrial context and the related challenges.
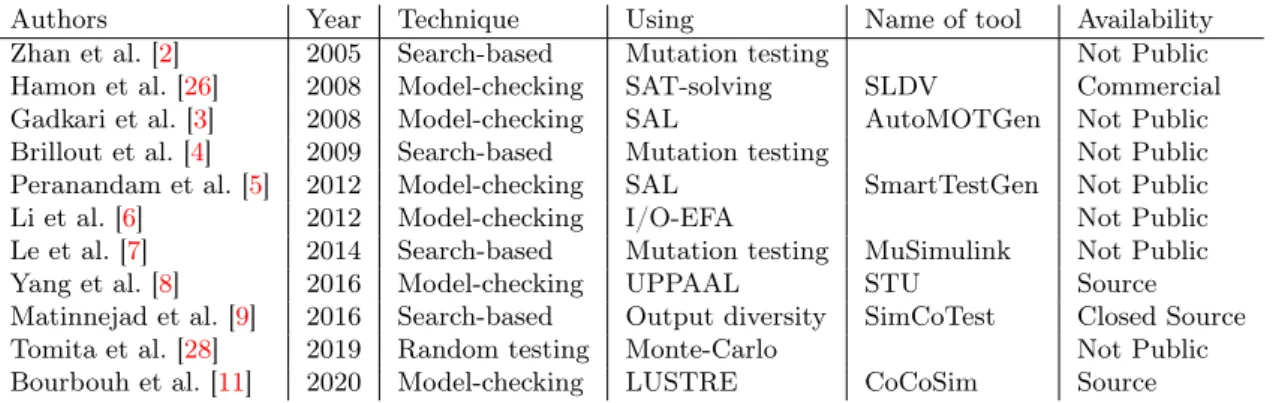
Authors Year Technique Using Name of tool Availability Zhan et al. [2] 2005 Search-based Mutation testing Not Public Hamon et al. [26] 2008 Model-checking SAT-solving SLDV Commercial Gadkari et al. [3] 2008 Model-checking SAL AutoMOTGen Not Public Brillout et al. [4] 2009 Search-based Mutation testing Not Public Peranandam et al. [5] 2012 Model-checking SAL SmartTestGen Not Public Li et al. [6] 2012 Model-checking I/O-EFA Not Public Le et al. [7] 2014 Search-based Mutation testing MuSimulink Not Public Yang et al. [8] 2016 Model-checking UPPAAL STU Source Matinnejad et al. [9] 2016 Search-based Output diversity SimCoTest Closed Source Tomita et al. [28] 2019 Random testing Monte-Carlo Not Public Bourbouh et al. [11] 2020 Model-checking LUSTRE CoCoSim Source
Table 1: Overview of ATG approaches for Simulink and/or Stateflow.
3.1
State of the Art: Test Generation Techniques for Simulink
There are several approaches for automated testing of Simulink models in literature. Several approaches [3,5,8,11,26] relies on model-checking for formal verification and test input generation. They rely on translating the model into the input language of the model-checker. Search-based approaches have also been proposed [2,4,9,29]. An overview of different tools for automated testing of Simulink models can be seen in table 1. The rest of this section provides more details on some of these tools (SLDV is described in section 2).
In [2], Zhan et al. extend their previous work [30] on structural search-based test input generation. They propose a search-based approach based on mutation testing. The mutation is performed on the signals of a Simulink model and not the block themself. This is done by inserting a block on a signal between two blocks. This block will perform an arithmetic operation (e.g., add one, or multiply by two) or assignment of a constant. Their approach gives sore based on how far the fault propagates within the model. Test data that generate different outputs on the mutant and the SUT get a score of zero. Simulated annealing is used as the search algorithm. They evaluate their approach on three Simulink models, Two of which are example models that can be considered very simple, one consisting of only 14 blocks (only i/o, add, multiply and switch blocks). One of the models is from an industrial partner, and no information on the complexity of this model is provided. From what we can tell, their approach and models do not include any temporal logic. AutoMOTGen [3] is a tool for automated test generation for Simulink/Stateflow. The tool uses SAL [31] based model-checking. The tool allows the user to select the sampling time, allowing for fewer discrete time steps during simulation. AutoMOTGen does not support all Simulink/Stateflow block since the translation into the SAL language is a non-trivial. Therefore, the authors have focused on the block most commonly used in the automotive domain. Similar to other tools, it provides test-cases for counter-examples found by the model-checker. An not fully automated version of the tool was evaluated [32] on two example models provided by MathWorks, Automatic Transmission Controller , and Adaptive Cruise Controller. The tool showed promising compared to an unnamed commercial tool based on random and guided simulation techniques.
SmartTestGen [5] is another ATG tool for Simulink/Stateflow that integrates three test generation techniques. In addition to SAL [31] based model-checking, it uses random testing, and local constraint solving and heuristics. These techniques are used in tandem. Initial test-cases are based on random testing and extended with test-cases generated by the other techniques. The tool is
evaluated on 20 industrial Simulink/Stateflow models, ranging from 37 to 901 blocks. The tool is compared to the commercial tools Reactis and BTC Embedded Tester. The comparison is made on the 20 industrial models and measured in terms of decision, condition, and MC/DC coverage. While their tool out-perform both commercial tools in terms of coverage, there is no mention of test-suite size, test-sequence length, nor the time required for generation.
In a paper [33], the authors describe an experiment where they use SmartTestGen to generate test-cases based on existing tests-cases. They note that SmartTestGen is unlikely to replace the commercial tools in use in industry. The existing test-cases could be created manually or by a tool. In their evaluation, they use test-cases generated by Reactis. In most cases, they can extend the test-cases to achieve higher coverage.
Le et al. [7] have proposed a search-based method for ATG based on mutation testing implement in the tool MuSimulink. For mutation testing, the quality of a test suite is measured based on its ability to detect injected faults. They note that mutation testing is computationally expensive since multiple test cases all need to run on all mutants derived from the model. They compare both a Genetic Algorithm and Simulated Annealing to random test generation.
SimCoTest [9,29], is a tool for automated test input generation for Simulink models. It works by generating a limited set of diverse output signals. Two publicly available models from MathWorks, CC, CLC, were used to compare the fault revealing the ability of the tool to that of SLDV. To measure the fault revealing ability, they inject common Simulink fault patterns into the models and using the fault-free models as a ground truth. They show that their tool has a higher fault revealing ability than SLDV. This is attributed to the fact that the output produced by the SLDV test cases only deviates slightly or not at all to the ground truth oracle. In a more recent paper [34] Matinnejad et al. explores test prioritization for the test-cases generated by SimCoTest. In addition to structural coverage, output diversity of a test-suite is also used for test-case prioritization. They show that their approach out-performs random and coverage based prioritization of test-cases. Tomita et al. present a template-based Monte-Carlo approach to input generation for large Simulink models [10]. They compare their approach to SLDV [10,28]. Since the input to Simulink is time-series data, templates are used for signal creation. The templates have been developed together with domain experts. Different signals can be generated bases on a number of parame-ters. They evaluate on two industrial models, consisting of 476 and 2374 blocks respectively, both consisting of multiple sub-systems. Their approach is compared to SLDV in terms of coverage, test-suite size, and time required for the tool to run. Since their tool is non-deterministic, they evaluate it over 20 runs. In all cases, their tool achieves better coverage than SLDV and similar test-suite size. It is worth to note that the evaluation was time-constrained to 10 minutes. With their tool having a fast implementation to measure coverage, compared to Simulink Coverage, they can generate many candidates. It would be interesting to see a comparison without time constraints. Since a Simulink test-case is a set of time-series data, the sequence length is also of interest.
CoCoSim [11] is an open-source tool for formal verification and code-generation from Simulink models. For verification, CoCoSim relies on external model-checkers. The tool provides integration with Simulink, tractability, and translation of the model into LUSTRE [35]. The tool relies on external model-checkers for formal verification and test input generation. It is compatible with multiple model-checkers that support LUSTRE, such as Kind2 [36]. Like other tools, CoCoSim supports a subset of Simulink blocks, around 100 of the frequently used blocks. For test input generation, two approaches are used; the first is based on MC/DC coverage metrics, the second relies on mutation testing.
Yang et al. present a tool, STU [8], for verifying Simulink Stateflow models by translating them into a UPPAAL timed automata. The tool is evaluated on both industrial and artificial Stateflow models and compared to SLDV. The show that SLDV is unable to detect some faults in the artificial model, that STU is able to detect. For the industrial model, STU was able to detect potential issues with the model.
Eric Rapos and James Cordy present a tool [37] to generate and update test harnesses from Simulink models automatically. The tool was evaluated on a set of industrial Simulink models. The tool is tailored to the specific needs of their industry partner and not publicly available. They evaluated the tool on 457 models provided by the industry partner. It was able to generate test harnesses for the majority of the models. However, 86.7% of the generated test harnesses gave the same output as the manually created ones.
Menghi et al. present SOCRaTeS [38]. It is an open-source tool for automated generation of online test oracles based on functional requirements defined in a logic-based language. The tool was verified in industrial case studies where it is shown that the requirements language can express all 98 requirements in the case studies.
3.2
State of the Practice: Applying Test Generation in Industry
In a technical report, [39], the authors compare SLDV and UPPAAL in their ability to be used in the process of requirement verification in industry. They compare the validation of requirements of components using both SLDV and UPPAAL. Transforming a Simulink model into a timed au-tomaton requires scaling of floating-point numbers and mapping of the Simulink model to elements of the timed automata. They conclude that the fact that UPPAAL requires the Simulink model to be transformed into a timed automaton is a big obstacle for industry practitioners. Given the time constraints, not all requirements were verified with UPPAAL, since the transformation was too time-consuming. They also question the scalability of SLDV to be used on large models. In a paper [40] from 2013, Fraser et al. evaluate EvoSuite [17] on 100 randomly selected open source java projects. EvoSuite is a test generation tool for the Java programming language. One of the main challenges is that real-world software often interacts with its environment. This can cause unwanted side-effects from the SUT, such as file deletion. To address this issue, EvoSuite includes a security policy. There are also many challenges directly related to Java. They also present the methods EvoSuite applies to generate “readable” tests: Test suite/case minimization, value minimization, constant inlining, and variable naming. These are applied as a post-processing test. Having readable test-cases is important in a real-world application of ATG, but quantifying the readability of test cases is hard. They concluded that developing an ATG tool for use in the real world, by real users, is a hard task. In a subsequent study [41], they expand the evaluation, including the top-10 open-source java projects from SourceForge, seven industrial projects, and 11 automatically generated projects. EvoSuite can achieve84% branch coverage on classes without environment interaction, compared to71% on average.
In an empirical investigation, Gran et al. [42] compare the readability of manually created tests to tests automatically generated by EvoSuite, and the readability of the SUT. They found a significant difference in the readability of the SUT and the test cases, while the generated tests were only slightly less readable than the generated ones.
Daka et al. [43] explored how to further improve the readability of the test-case generated by EvoSuite. They explore using a machine learning model to implore the readability. They compare several approaches, using the model as a secondary criterion, using a multi-objective search, and using it as an additional processing step. Their evaluation also includes the EvoSuite post-processing proposed by Fraser et al. [40]. The results show that the EvoSuite post-processing improves the readability considerably. However, using a survey with 79 participants, they show that their search-based approach can further improve the readability of the generated test-cases. Kracht et al. [44] compared automatically generated tests from two ATG tools to existing manual tests from ten real-world programs. The comparison was in terms of code coverage and fault revealing ability. For code coverage, they measured decision coverage, and the fault revealing ability was measured using mutation score. On average, the automated test had a slightly higher branch coverage than the manual tests (31.8%, compared to 31.5% for manual tests). A more significant difference is seen in the mutation score, where the manual test achieves an average mutation score of 42.1% compared to 39.9% for the generated tests.
4
Problem Formulation
In a model based design workflow, Automated Test Generation (ATG) could prove useful for integration level conformance testing. If the generated test suite is able to fully exercise the system under test we can have confidence in the conformance of the software.
This thesis will explore and evaluate automated test generation in the context of an industrial control system. We will compare the coverage achieved by tests generated by an automatic test generation tool to that of the existing manual tests. The tool we have chosen to focus on is the de-facto standard tool for automated test generation: Simulink Design Verifier (SLDV).
While the main focus is the comparison of the coverage achieved, it is also important to focus on the cost associated with both creating the test and the challenges of utilizing the tests in an industrial workflow. The process of generating tests have an associated cost in terms of generation time. The time required for executing the tests and analysing the results can also be considered a cost. This thesis has also explored the limitations of ATG. In cases when the generated tests achieve lower coverage than manually created tests it is of interest to know the underlying reason. These costs and limitations are important to consider before adoption of ATG in industry. More specifically this thesis address the following research questions.
4.1
Research Questions
rq1 How does Automated Test Generation compare to manual testing in terms of coverage
and cost?
Structural coverage can be used as a measure of the quality of a test suite. It measures the tests’ ability to exercise the behavior of the System Under Test. The tests cost should also be considered. The cost of creating the test, running the test, and evaluating the results of a test.
rq2 What are the limitations of Automated Test Generation for testing Simulink models?
It is also of interest to know the limitations of Automated Test Generation, what cases are the tool unable to reason about, what limitations need to be considered when adopting Automated Test Generation in an industrial workflow.
5
Method
This thesis was performed as a case study, this research method was chosen since the work is set in an industrial context where there is limited possibility to have control over the variables. We follow the guidelines for conducting case study research by Runeson and Höst [45].
A literature review was performed with three goals in mind. a) Identifying ATG techniques for Simulink models. b) Finding tools providing ATG for Simulink. c) Identifying challenges when applying ATG in an industrial context, governed by safety standards.
To limit the scope of this thesis, only one tool for Automated Test Generation was evaluated. SLDV was selected and evaluated in its ability to be integrated into the testing practices of our industrial partner. This tool was selected since it is a first party tool, and the de-facto standard for applying ATG for Simulink. Most research prototypes were not publicly available or severely limited in compatibility. Furthermore, SLDV is commonly used as a baseline when evaluating research prototypes and other test generation tools for Simulink.
To answer research question rq1, an empirical comparison were performed. The comparison used
industrial software components with existing manual test-suites. We have primarily looked at coverage and test execution time. However, the readability of the tests was also explored to some extent. To answer research question rq2, challenges and limitations was explored during the
process of generating the test for the comparison. Additionally, the generated test was used for integration-level conformance testing, this to identify any limitations when applying the generated test in an realistic use-case.
6
Context of the Case Study
Bombardier Transportation develops safety-critical systems for train and rail. The software de-ployed to a train has to be developed in accordance with relevant safety-regulation and standards. For the rail industry, the standard EN 50128:2011 [46] Railway applications - Communication, signaling and processing systems describes the requirements and procedures for software develop-ment of railway systems. The standard EN 50657:2017 [47] Railways Applications - Rolling stock applications - Software on Board Rolling Stock adapts EN 50128:2011 for software in use on rolling stock. These standards require rigorous validation and verification practices.
This case study focuses on the propulsion control software for high-speed trains, commuter trains, and metros. Model-based design is used in the development of this software. Modeling is done using MATLAB Simulink, and Simulink Embedded Coder is used to generate high-quality C code optimized for embedded processors. The software is thoroughly tested across all integration levels.
6.1
Software Architecture
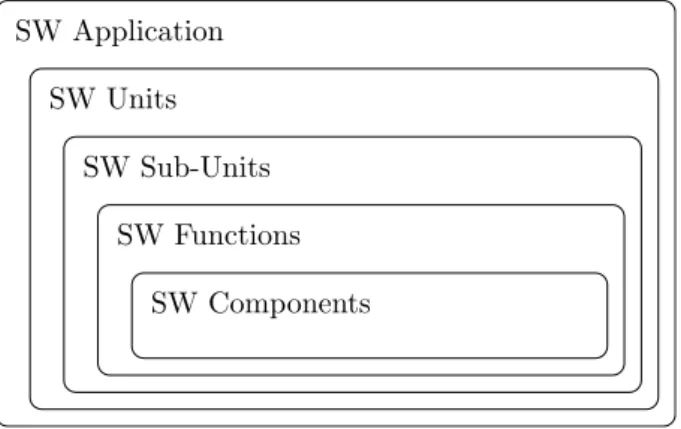
The development guidelines at Bombardier defines the architectural hierarchy used for the propul-sion control software application, and a visual representation can be seen in figure 7. The appli-cation contains the whole propulsion control software to be deployed to a train. The appliappli-cation itself consists of several software units. A software unit is a logical grouping of software sub-units. A sub-unit is a grouping of software functions with high functional cohesion. An application will either require all functions in a sub-unit or none of them. A software function is realized as a subsystem and consists of software components which perform specific action relating to a single function. Software components are reference models made up entirely of library blocks, specifically a set of custom blocks and a subset of blocks from the standard library.
SW Application
SW Units
SW Sub-Units
SW Functions
SW Components
Figure 7: The hierarchical architecture of propulsion control software developed at Bombardier.
The standard software application for propulsion control consists of 9 Software units, hierarchically containing sub-units and functions and components. In total, there are 182 Software components. These components are the subject of the experiments in this thesis.
6.2
A Software Component
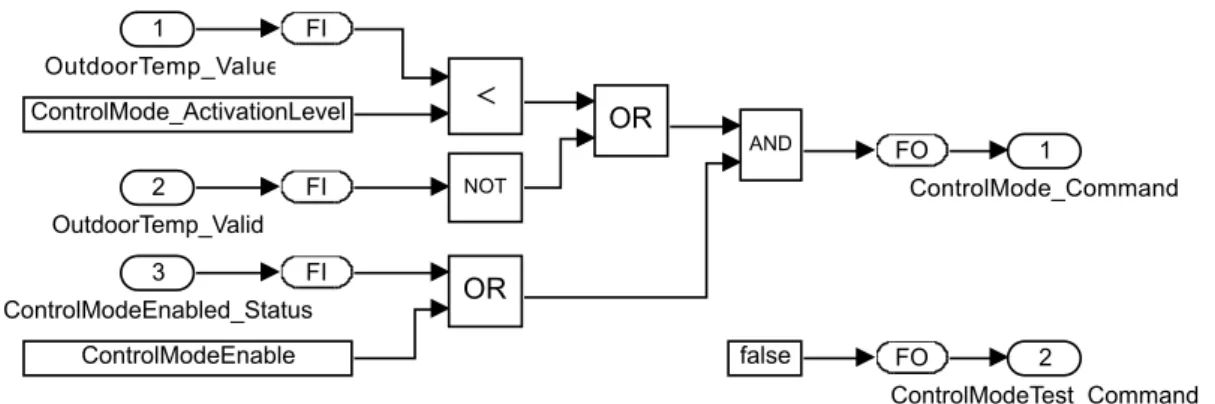
Figure 8 depicts the Simulink model of a simple propulsion control software component. This component have been altered slightly, the names of signals and constants have been changed for clarity and confidentiality reasons. This model will be used as a running example. The compo-nent consists of three inports and two outports. The compocompo-nents are responsible for sending a command if it is enabled, and the outdoor temperature is below a set activation level. The con-trol mode enable command will be sent when the outdoor temp is below the activation threshold,
or if the temperature signal is invalid. The control mode can be enabled from either the Con-trolModeEnabled_status signal form the train control management system, or the parameter value ControlModeEnable. It is also possible to activate the control mode in test mode.
The blocks force input (fi) and force output (fo) are connected to inports and outputs respectively. The fi fo blocks are actually masked subsystems that provide functionally for forcing signals, and exclusively used during Hardware-in-the-Loop (HiL) testing. These force blocks are used for all inports and outport in all models. These blocks can not be fully covered during Simulink testing. The example component contains three constants, two of which (ControlMode_ActivationLevel and ControlModeEnable) are configuration constants. The constant false sets the ControlMode-Test_Command to false, this can only be overwritten using the fo block when performing HiL testing. 2 ControlModeTest_Command 2 OutdoorTemp_Valid 1 OutdoorTemp_Value 3 ControlModeEnabled_Status 1 ControlMode_Command FO FO FI FI FI
Figure 8: A simplified example of a Simulink model of propulsion control software component.
6.3
Configuration Constants
As seen in the example component in figure 8, some of the models rely on configuration constants (often referred to as parameters). These are constant blocks, which values can be set when configuring the model and does not change during run-time. These configuration constants can be set as values in the model- or base-workspace, or as arguments in the model mask. During testing, different combinations of these parameters need to be used in order to fully exercise the SUT. Considering these parameters are not meant to change during run-time, multiple test cases are required.
In this context, boolean constants are often used to enable or disable specific functionality of the model. We will refer to these as feature flags. Configuration constants of type integer and floating-point will be referred to as value parameters. Consider the example model in figure 8, it has two configuration constants: EnableControlMode which is a feature flag. And Con-trolMode_ActivationLevel which is a value parameter. In this case, it is most likely that we can fully test the model by only having to change the feature flag. The exception is if the value param-eter ControlMode_ActivationLevel is equal to the upper bound, or outside, of the signal range of OutdoorTemp_Value. In that case, both configuration constants need to change in order to fully test the model.
7
Experimental Setup
To explore and answer our research questions, Automated Test Generation (ATG) is applied in the context of an industrial control system. This section presents our experimental setup and test subjects. In Section 8, we describe the process of test generation. Section 9 describes the comparison to the existing manual tests. Section 10 describes the experiment of actually using the generated test for integration-level conformance testing.
7.1
Experiment Subjects
The subject of this case study have been the propulsion control software from Bombardier. More specifically, the software components of the propulsion control software, as described in section 6. These components can be considered to be “unit” level of the software. To get a representative sample, all Simulink models classified as components have been selected. The components are taken from the the latest revision of the standard implementation of the Simulink project for the propulsion software. This revision was part of an active development phase.
In this revision there are182 Simulink models classified as components, of these we have excluded two models. One model was excluded since it does not take any inputs and therefore requires no input to test. The other model was excluded since since no manual test had been created for that model. For this study we therefore have180 Simulink models we can use for test-case generation and empirical comparison to manual tests.
min max median mean sd Number of Blocks 15 402 114 124.79 64.07 Feature Flags 0 4 0 0.36 0.72 Cyclomatic Complexity 4 114 18 20.78 14.87
Table 2: Information of the models in the component experiment.
To provide the reader with an understanding of the nature of the models, a simple but representa-tive model of a component can be seen in figure 8. There is statistics about the models presented in table 2. The number of blocks where collected using sldiagnostics(), the cyclomatic com-plexity using comcom-plexityinfo(). We also report on feature flags, that is the number of boolean configuration constants, as described in section 6.3.
7.2
Hardware Setup
The experiment was performed on a Dell Latitude E7250 with an Intel Core i5-5300U CPU @2.30GHz and 8GB of RAM. Which can be considered a low-end setup in this context. The MATLAB version used was 2019b update 4.
8
Test Input Generation
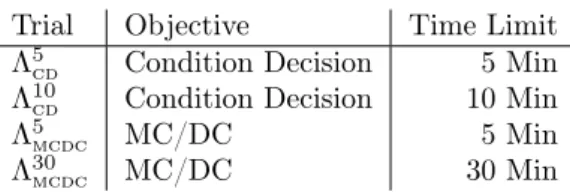
The generation of tests was performed using the test generation capabilities of SLDV. The two main factors that affect the coverage of the generated tests are the coverage objective and the analysis time limit for test generation. In order to explore how these affect the achieved coverage of the generated tests we ran four trials with the values seen in table 3. We denote the trials as ΛT imeout
Objectiveto allow the reader to easily identify the objective and time limit used.
Trial Objective Time Limit Λ5
cd Condition Decision 5 Min
Λ10
cd Condition Decision 10 Min
Λ5
mcdc MC/DC 5 Min
Λ30
mcdc MC/DC 30 Min
Table 3: The test generation trials.
Test generation does not need to be run multiple times since SLDV is deterministic. However, while the test generation is deterministic, we have no control over how much execution time is given to MATLAB by the operating system. To mitigate the affect the OS scheduling, all other applications was closed and the computer was not in active use during test generation. Since test generation is repeated for each trial, cashing was disabled to get accurate time measurements for the test generation process.
To explore research question rq2, the following metrics was captured:
• Compatibility. The number of models compatible and to what extent.
• Generation Time. Including pre-processing, analysis and results generation times. • Coverage Objectives. The total number of coverage objectives. The number of objectives:
excluded, satisfied, undecided and unsatisfiable.
8.1
Coverage Filter
For both the test generation and the when generating the coverage results, a coverage filter was used. The coverage filter exclude some coverage objectives that are impossible to cover. The force input (fi) and force output (fo) as seen in figure 8 are excluded since they are impossible to cover and only used in HiL testing. The case where both output of s-r flip-flop is true were also in the coverage filter. For the test generation the coverage filter help reduce the number of coverage objectives.
8.2
Pre-processing and configuration
To increase the coverage of the generated tests, configuration constants can be incorporated into the test generation process. MathWorks support pages2 recommend running the SLDV tool multiple
times with different values for the configuration constants.
As seen in table 2, several models (26.5%) relay on feature flags. Examining some of these models and their manual test showed that is is essential to include these feature flags in the test generation process to achieve high coverage.
While SLDV can not automatically identify parameter values, it is possible to supply a list of parameters and their possible values. However, this approach has constraints, changes are needed to
2https://se.mathworks.com/help/sldv/examples/using-command-line-functions-to-support-changing
make the models compatible. Potentially, all configuration constants could be added as parameters to SLDV. Though we do not know the range of these parameters, we only know the name and datatype. However, for feature flags the signal range is known: true or false.
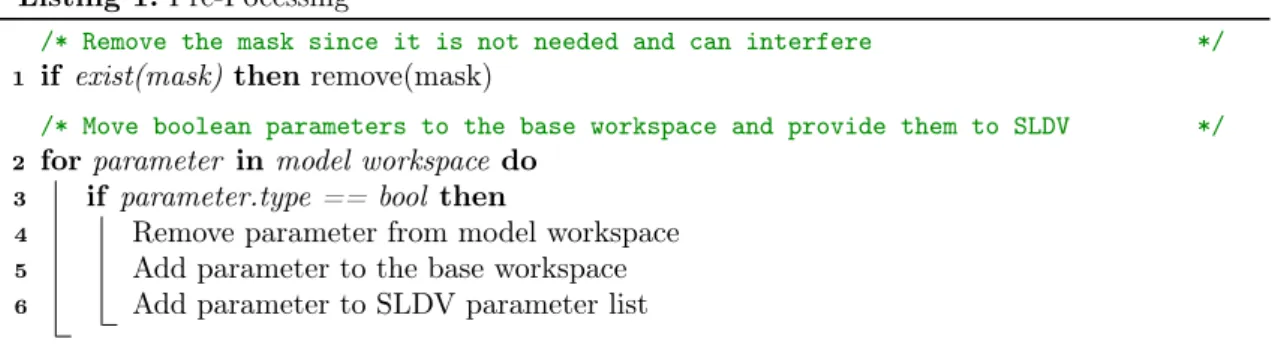
Listing 1: Pre-Pocessing
/* Remove the mask since it is not needed and can interfere */
1 if exist(mask) then remove(mask)
/* Move boolean parameters to the base workspace and provide them to SLDV */
2 for parameter in model workspace do 3 if parameter.type == bool then
4 Remove parameter from model workspace 5 Add parameter to the base workspace 6 Add parameter to SLDV parameter list
We have implemented support for feature flags using a pre-processing step implemented as a MATLAB function. The pre-processing function is necessary to make the model compatible with the parameter functionality of SLDV. The steps of the function are listed as pseudocode in listing 1. SLDV requires the parameters to be only defined in the base workspace, currently they reside in the model workspace. Models can be masked and parameters from the mask will be inserted into the model workspace.
To evaluate the feature flags effect on coverage. We compare the coverage result of test generated with and without feature flags as parameters. Both trials were run on the178 components with MC/DC as a coverage objective and a timeout of 5 minutes. The coverage results are presented as boxplots in Figure 9. As can be seen in the boxplots, even if only 26.5% of models have feature flags, it greatly affect the coverage of the generated test suite.
No FF With FF 80% 85% 90% 95% 100%
(a) Decision Coverage
No FF With FF 80% 85% 90% 95% 100% (b) Condition Coverage No FF With FF 0% 20% 40% 60% 80% 100% (c) MCDC Coverage
Figure 9: Box plots depicting coverage of with and without feature flags as parameters in the test generation process.
9
Empirical Comparison
For the empirical comparison to the manual tests. The following metrics were collected:
• Coverage. In terms of decision, condition, and MC/DC coverage.
• Test Suite Size. The size of the test suite for a model is measured in the number of test cases. The sequence length of a test case is measured in the number of discrete times-steps where any input signal changes value. The sequence length is presented as a summation of the lengths of the sequences of all test cases for the model.
• Test Suite Execution Time. The time required to run the test inputs in MiL. Note that execution time seems to vary between simulation runs, this applies to both the generated as well as the manual tests.
To capture coverage, the generated tests were simulated using sldvruntest() and coverage col-lected using Simulink Coverage. The manual test were simulated using Simulink Test Manager, which also utilize Simulink coverage. Simulink Coverage report on the test execution time as well as coverage. To compare the coverage, we present boxplots for the different coverage metrics for the manual tests and the trials of generated test. Then do perform a Mann–Whitney U, where we compare the best result from the ATG trials to that of the manual test. A Mann-Whitney U test was chosen since our data is not normally distributed. The statistical test is performed with the hypothesis that the generated test achieve higher coverage than the manual tests.
For the test suite size we are interested in both the number of test cases for a model and the combined length of those test cases. For the generated test this info can be easily accessed in the output generated by SLDV. For the manual tests, the number of test cases are easily accessible from the test file. However, we were unable to extract the sequence length automatically. As explained in section 6, the manual test uses the a test harness with a test sequence block. This makes it challenging to count. We decided to count the steps in the test sequence. This could not be performed automatically because the test sequences contains steps that does not change values, which we had to exclude. These are steps such as test-case routing, test step groupings and end steps. However, it was noted after the fact that the steps in a test sequence can specify a function (e.g., sin() or ramp()) of the value over time. This results in the sequence length reported for the manual tests not necessarily representing the definition accurately.
10
Conformance Testing
One of the main use cases for automated test cases in a safety critical environment is integration-level conformance testing, also known as equivalence testing. That is making sure that the software exhibit the same behaviour throughout the different integration levels.
In this experiment the test cases generated from trialΛ30
mcdc where run in both MiL and SiL and
their respective output signals compared. For this we used the command sldvruncgvtest() that takes the test input generated by SLDV and uses the code generation verification toolbox to run test tests and compare the results.
To make the models compatible the tooling changes to the model and their configurations had to be made. Since there is no official documentation of the limitations of the tools, the pre-processing steps were constructed from error messages, debugging, reading the source-code of the tool, and trial and error. The pre-processing steps we ended up with are described as pseudocode in listing 2.
Listing 2: SiL Pre-Pocessing
/* Apply the pre-processing used for test generation. See listing 1 */
1 FeatureFlagPreProcessing()
/* Setup SIL specific configuration and compilation tool-chain */
2 setCustomConfigurationSet()
/* The tooling does not support reference models. Therefore, they are converted
into subsystems. */
3 for mdlref in find_mdlrefs(model) do 4 Convert2SubSystem(mdlref)
/* Enable data logging on the signals connected to the models outports. */
5 for outport in model.outports do
6 outport.inport.signal.name = outport.name 7 outport.inport.signal.srcPort.dataLogging = true
It is possible to import the test cases into Simulink Test, and use Simulink Test Manager to execute the tests, both in MiL and SiL. However, we have found no way of importing the tests into an existing test file. When working with tens, or even hundreds of models, ease of use and efficiency is important when ruining the tests.
11
Results
In this section we present the results of our experiment. First, we present metrics from the test generation process, model compatibility, the time required for test generation and the number of coverage objectives satisfied in Section 11.1. Then in section 11.2 we compare and analyse the coverage achieved of the generated test from the different trials and compare to the manual test. Section 11.3 compares the test themselves, in terms of sequence length, number of test cases and test execution time. A comparison of the test input signals is made in section 11.4. Finally, the conformance test of MiL and SiL is presented in section 11.5.
11.1
Test Generation Process Metrics
In table 4, the model compatibility is presented. Of all 182 models, only 39 models are fully compatible with SLDV. In some cases, the tool automatically performs replacement or stubbing of incompatible blocks, and139 models require some sort of block replacement. However, 12 of these models only have block replacement for fixing links to reference models and should not affect the test generation process. So only127 models require block replacement for unsupported or partially supported blocks. In table 5 we have listed the reasons for block replacement. All the127 models that have block replacement have replacements due to some kind of approximation. And only14 models contain blocks that are completely stubbed.
Fully Compatible 39 Partly Compatible 139 Incompatible 2
Table 4: The number of models compatible with SLDV.
Approximation 127 Full Stubbing 14
Table 5: Identified reasons for block replace-ment.
A boxplot of the number of block replacement per model can be seen in figure 10. Out of all models in this experiment, the tool could not generate tests for two models , the tool failed with an “Unexpected unknown exception". Therefore, there are no generated tests for these models.
0 5 10 15 20 25
Figure 10: The number of replaced blocks per model.
Figure 11 presents the average time per component required for test generation. Time is split into the time required for pre-processing, analysis, and result generation. The analysis time is, as expected, correlated to the time limit set for the test generation. The pre-processing is linked to the coverage objective, a stronger coverage objective requires more pre-processing. The results generation time does not differ noticeably among the trials.
Figure 12 depicts the percentage of models where the test generation stopped because it exceeded the set time limit. With a coverage objective of condition and decision coverage, the same per-centage, 72.5% of models exceeded the time limit. We get the same results forΛ5
mcdc. However
with a time limit of 30 minutes there is slight improvement, forΛ30
Λ5 cd Λ10cd Λ5mcdc Λ30mcdc 0 5 10 15 20 25 Time (min utes) Pre-Processing Analysis Results Generation
Figure 11: Average time per component for test generation. Λ5 cd Λ10cd Λ5mcdc Λ30mcdc 66% 68% 70% 72% 74% 71.3% 72.5% 72.5% 72.5%
Exceeded time limit
Figure 12: The percentage of components for which the test generation process did timeout. In table 6, the percentage of satisfied, undecided and unsatesfiable coverage objective for the different trials are presented. Comparing the number of undecided coverage objectives in runΛ5
cd
andΛ10
cd, we see that there are0.19% increase in the number of satisfied coverage objectives. This
increase in satisfied coverage objectives is distributed over four models . ComparingΛ30
mcdcand Λ 5
mcdc, there is difference in the number of satisfied coverage objectives of
almost2%. However only 5 models are affected by this increase. The majority of the undecided coverage objectives fromΛ5
mcdcthat where decided inΛ 30 mcdcwere unsatisfiable. Λ5 cd Λ 10 cd Λ 5 mcdc Λ 30 mcdc Satisfied 90,36% 90,55% 86,66% 88,62% Undecided 5,48% 5,23% 9,70% 5,45% Unsatisfiable 3,10% 3,17% 2,24% 4,53% Undecided due to stubbing 1,06% 1,06% 1,40% 1,40%
11.2
Coverage Metrics and Comparison
The mean coverage achieved for the test generation trials, as well as the manual tests are presented in table 7. Overall, all trials and the manual tests achieve high decision and condition coverage. The trials targeting decision and condition coverage achieve substantially lower MC/DC coverage, which is to be expected. It is worth noting thatΛ10
cdget higher decision coverage thanΛ 30
mcdc. This
suggest that it should be possible for Λ30
mcdc to achieve higher coverage given a longer time limit
for analysis. Λ5 cd Λ 10 cd Λ 5 mcdc Λ 30 mcdc Manual Decision 97,24% 97,51% 97,42% 97,49% 96,08% Condition 97,84% 97,98% 97,75% 98,01% 98,44% MC/DC 60,24% 60,71% 88,26% 89,04% 85,21%
Table 7: Mean coverage values.
Comparing run Λ30
mcdc and run Λ 10
cd there is one model that got lower decision and condition
coverage. In condition coverage we see minor increases (less than 5%) in 3 models, this could either be due to the difference in generation time or that the additional test-cases incidentally covers objectives that SLDV is unable to reason about due to stubbing.
Λ 5 cd Λ 10 cd Λ 5 mcdc Λ 30 mcdc Man ual 80% 85% 90% 95% 100%
(a) Decision Coverage
Λ 5 cd Λ 10 cd Λ 5 mcdc Λ 30 mcdc Man ual 80% 85% 90% 95% 100% (b) Condition Coverage Λ 5 cd Λ 10 cd Λ 5 mcdc Λ 30 mcdc Man ual 0% 20% 40% 60% 80% 100% (c) MCDC Coverage
Figure 13: Box plots depicting coverage of generated tests and manual tests. Note that some outliers are not visible.
Figure 13 displays boxplots of the coverage of the respective test generation trials as well as manual testing. For decision coverage, there is a trivial difference in coverage between the automatically generated tests, while the manual tests have slightly lower coverage. The automated test with an MC/DC target objective got higher condition coverage than those targeting condition and decision, this is likely due to incompatible blocks being stubbed during test generation. The coverage objective of these blocks being indirectly covered when targeting an MC/DC objective of other blocks. For both decision and condition coverage, all test groups have high coverage with the exception of a few outliers. For MC/DC coverage we observe a clear distinction in coverage between the test targeting MC/DC and those that do not. Here there is also a larger discrepancy between the manual test and that automatically generated test.
11.2.1 Per Component Coverage Difference
As seen in figure 13, there are little difference in coverage between test groups. For decision and condition coverage it seems that even the outliers are the same. However, in a boxplot we have no way of telling if the outliers are the same model or different modest that got the same coverage percentage. Therefore, we compared the coverage results ofΛ30
mcdmto those of the manual tests per
component. This was done by taking the coverage of the generated tests minus the coverage of the manual tests. Cases where the generated test achieve higher coverage results in positive values, and where the manual test achieve higher coverage results in negative values.
50% 44% 20% 14% 14% 13% 13% 10% 8% 8% 8% 6% 6% 4% 3% 2% −4% −5% −6% −9% −10% −10%
Decision Coverage Absolute Difference
Figure 14: The absolute decision coverage difference betweenΛ30
mcdm and manual tests. Each bar
is the difference for a component. Components with no difference are excluded.
In figure 14, the absolute difference in decision coverage is presented. Only the decision coverage of 22 models differ between the generated and manual tests. For 16 of these models the generated tests achieve higher coverage. From this data and as seen in the figure there is a difference in decision coverage between automatically generated tests and manual tests. However, this difference is not statistically significant (p= 0.0719). 18% 17% 14% 8% 8% 7% 5% 5% 4% 3% 2% 2% 2% 1% 1% − 1% − 2% − 2% − 3% − 3% − 3% − 3% − 4% − 4% − 5% − 6% − 7% − 8% − 8% − 8% − 11% − 12% − 13% − 13% − 13% − 15% − 24%
Condition Coverage Absolute Difference
Figure 15: The absolute condition coverage difference betweenΛ30
mcdm and manual tests. Each bar
is the difference for a component. Components with no difference are excluded.
In figure 15, we see the same type of plot for condition coverage. Here the there are more compo-nents that differ in coverage, 37 to be precise. Generally the manual test achieve higher condition coverage. Once again, this difference is not statistically significant (p= 0.8357).
11.2.2 Reasons for Coverage Difference
In some cases, the generated test achieves lower coverage than the manual tests. This proves that there is a possibility for the generated tests to improve. To explore the underlying reason why the generated tests achieve lower coverage, we have manually inspected and compared the models and the coverage results. Only decision and condition coverage was considered for this investigation. A compilation of the identified reasons can be seen in table 8.
Six models achieved lower decision coverage than the manual tests. For two of these models, this is because of a bug in the software allowing the manual test to provide input outside the interface range of the component. This is explained in greater detail at the end of this section. Of the other four components, one was limited by the use of value parameters, which we do not account for in the test generation process. For the rest of the components, the time limit was the main factor. Timeout is a classification we have given to the cases where we believe that the generated test could have achieved the same (or higher) coverage as the manual test given enough analysis time. We have identified three reasons why the test generation timeouts: the complexity of the model, the use of floating-point arithmetic, or the use of temporal logic. Primarily temporal logic in custom library blocks. Decision Condition Timeout 3 16 Value Parameter 1 3 Stubbing 0 3 Interface Limit 2 0
Table 8: Identified main reasons for lower coverage ofΛ30
mcdccompared to manual testing.
For condition coverage, timeouts were the main contributing factor as to why the generated tests achieve lower coverage than the manual tests. There are 3 cases where the use of one or more value parameters is what causes the difference. Finally, there are 3 cases where stubbing of unsupported blocks is the reason for the difference. In all three instances of subbing, it blocks related to persistent storage that is causing the issue.
We have also looked at cases where the generated test achieves higher coverage than the manual tests. What was found is that there is a possibility for the manual test to improve. Mainly, it was simple edge-cases and defensive programming styles that could use more testing to improve coverage.
Broken Range Checks When Using Test Harness
The test harness setup, used by some manual test, does not need to respect the interface ranges defined in the model under test. Therefore the manual tests have a larger input space, and for two models this is the reason why the manual tests achieve a higher coverage than the generated tests. Consider the test harness in figure 4. If the block signal spec. and routing were to be removed and the test sequence connected directly to the Model Under Test. The defined ranges of the inports are not respected, even if diagnostics are enabled. We get the same behaviour when using the signal builder and signal editor. Inserting any block, (e.g. gain) between the test sequence and SUT will allow for the range checks to work as intended. Mathworks have been informed of this behaviour.