Earnings Management; a
way to show strength
MASTER THESIS WITHIN: Accounting NUMBER OF CREDITS: 30
PROGRAMME OF STUDY: Civilekonom AUTHOR: Jonathan Engdahl, Per Malmström JÖNKÖPING May, 2019
The financial facades’ during IPOs: evidence
from Northern Europe
Master Thesis in Business Administration
Title: Earnings Management; a way to show strength Authors: Jonathan Engdahl & Per Malmström Date: 2019-05-18
Keywords
Discretionary accruals, Organizational façades, Information asymmetry, IPO, Earnings management
Abstract
Background: -Researchers have provided evidence that managers mislead stakeholders with organizational façades in the non-financial reports. However, few, if any, studies have studied if the reported information in financial reports is used in the same way. Purpose: -The purpose of this study is to investigate if managers use earnings management as a façade or organized hypocrisy.
Method: -This study uses panel data analysis to test if managers use discretionary accruals earnings management to report inconsistent earnings in the years adjacent to the IPO. The authors selected 44 companies that performed an IPO between 2009 and 2017. Conclusion: -Using a sample of 330 firm-year observations, the authors find a negative correlation between the year of the IPO and discretionary accruals earnings management. In contrast to previous research, the discretionary accruals did not offer a significant difference from the average. The findings offer similarities to both the decision, the action and the talk criteria discussed in organizational façade literature.
Acknowledgements
We would like to dedicate our first gratitude to our examiner Professor Dr. Adele Berndt, for providing the structure and outline that made our study possible. Thank you for a great learning opportunity and a rewarding series of workshops.
Secondly, we devote our greatest gratitude towards our tutor for the feedback and support that improved the quality of our thesis. Further, the seminar sessions provided both knowledge and structure to carry the process according to the plan, thank you. Following, we thank Mr. Oskar Eng for his support during the planning process leading up to the purpose of the thesis.
Finally, we thank Dr. Argyris Argyrou and Dr. Toni Duras and members of our seminar group for contributing with knowledge and feedback during the process leading up to the final product, thank you.
Table of content
Master Thesis in Business Administration ... i
Abstract ... i
Acknowledgements ... ii
1 Introduction ... 1
1.1 Background and Problem ... 1
1.2 Purpose ... 3
2 Frame of reference ... 5
2.1 Theoretical background and literature review ... 5
2.2 Organizational Façades and Organized Hypocrisy ... 8
2.2.1 Organized hypocrisy ... 8
2.2.2 Organizational Façades ... 10
2.3 Earnings Management ... 14
2.3.2 Measurement of Earning Management ... 17
2.4 Hypothesis development ... 18
3 Methodology and method ... 20
3.1 Methodology ... 20
3.2 Sample ... 20
3.3 Earnings management proxy ... 21
3.3 Empirical Model ... 22
4 Findings ... 24
6 Conclusions and Discussion ... 31
7 References ... 34
Tables
Table 1: Industry distribution in final sample………..………21Table 2: Descriptive statistics……….…………24
Table 3: Descriptive statistics of mean for DA and EBIT……….……..24
Table 4: Correlation matrix……….………..25
Table 5: Multicollinearity test………..………..25
Table 6: Model 1……….…………26
Table 7: Model 2……….…………26
1 Introduction
1.1 Background and Problem
The gap between companies talk and action has previously been studied through analyses of the companies’ sustainability reports (Cho, 2009, Cho, Laine, Roberts, and Rodrigue, 2015, Malsch 2013, Milne & Gray, 2013). The analyses present valuable information regarding how organizations act and how companies communicate with their stakeholders. However, these studies have only considered stakeholders with a non-financial interest in the company. In recent years, more and more people in Sweden have begun investing in the stock market. According to Euroclear Sweden (2019), the number of individuals owning shares in companies have increased since 2014. These individuals are usually small portfolio owners, on average; they own 11% of the total market value (Euroclear Sweden, 2019). Scholars have argued that stakeholders with a smaller stake in an organization are easier to mislead through action (Lipson, 2007).
The shareholders of a company are one of multiple stakeholders, “a group or individual who can affect or is affected by the achievement of the organization’s objectives” (Freeman 1984, p.46). Stakeholders, such as individuals, organizations, societies and institutions all have different financial, and non-financial interests in a company (Mitchell, Agle, & Wood, 1997). The main source for conflicts and loss of trust between a company and its stakeholders is irregularities between stakeholders’ expectations and the action of the company (Cho et al. 2015; Michelon, Pilonato, Ricceri, Roberts, 2016). To avoid such conflicts, companies engage in organized hypocrisy (Brunsson, 2007) and organizational façades (Abrahamson & Baumard, 2008; Nystrom & Starbuck, 1984). When a company decides to list their stocks on a stock market through an Initial Public Offering (IPO), current shareholders exchange some influence over the company with the aim of future earnings. Researches argue that the information asymmetry between the organization and external stakeholders is larger for newly listed companies because of the short-recorded history of those firms (Nam, Park, & Arthurs, 2014). Furthermore, research also suggests that managers use the existing information asymmetry to fulfill both the organization’s benchmarks, as well as their own by boosting the share price in the short run (Nam et al, 2014; Watts & Zimmerman, 1978). Studies in finance have
provided evidence that the stock price of an IPO-stock, at offering is on average underpriced compared to the closing price of the first day of trade (E.g. Ritter, 1991). However, after three years the share price was less than the closing price of that first day (Ritter, 1991).
To understand the irregularities between different companies talk, decision, and action, scholars have investigated the behavior of organizations through the context of corporate governance. In order to explain such behavior, scholars have applied theories, such as, Legitimacy theory, Signaling theory, Organizational hypocrisy and Organizational façades (Abrahamson & Baumard, 2008; Brunsson, 1993; Cho et al., 2015; Simnett, Vanstraelen & Chua, 2009) which suggest that management use reporting to gain acceptance from its stakeholders. Research in the area, including the gap between talk, decision, and action, have gain attention in recent years (Cho, 2009; Gray, 2010; la Cour & Kromann, 2011; Michelon et al., 2016; Tregidga, Milne & Kearins, 2014). Most of these studies have examined the language in companies’ sustainability reports. The worse corporate environmental performance, the more optimistic language in the sustainability report. Companies want to camouflage or conceal bad news by turning focus to the good news through the talk of the future (Michelon et al, 2016). At the same time, management uses financial reporting to fulfill their self-interests, by either maximizing profits in a period or moving profits to another period by using the flexibility within the Generally Accepted Accounting Procedures, GAAP, in what is called earnings management (Efendi, Srivastava & Swanson, 2007; Riedl, 2004). According to Ronen and Yaari (2011) earnings management,
“occurs when managers use judgment in financial reporting and in structuring transactions to alter financial reports to either mislead some stakeholders about the underlying economic performance of the company or to influence contractual outcomes
that depend on reported accounting numbers.” (Ronen & Yaari, 2011 p.26). Earnings managementis argued to mislead or disfavor some stakeholders as the inconsistent use of the possibilities within GAAP effects when the value is presented (Ben Amar & Chakroun, 2018).
Research in the area of corporate behavior, including the gap between talk, decision, and action, have gain attention in recent years (Cho, 2009; Gray, 2010; la Cour & Kromann, 2011; Michelon et al., 2016; Tregidga, Milne & Kearins, 2014). Most of these studies have examined the language in companies’ sustainability report. Simultaneously, other studies have examined the readability of annual reports and the correlation with earnings management. Lo, Ramos, and Rogo (2017) extends Li’s (2008) research and finds further evidence that companies that use earnings management to increase earnings or to beat break-even or just above write their Management Disclosure and Analysis (MD&A) report with less clarity than companies delivering similar results as previous years. However, few studies have studied the existence of organized hypocrisy and organizational façades in financial reporting. Ben Amar and Chakroun (2018) investigated the connection between earnings management and corporate social responsibility (CSR) to see what impact CSR reporting has on earnings management. Their study did not suggest any explanation of why companies use earnings management to hide bad performances.
In order to improve the usability of corporate reports, organizations have developed frameworks to visualize the full value-chain. The Integrated Reporting Framework <IR> is one of the larger frameworks for reporting corporate financial and non-financial information to the organization’s stakeholders (IIRC, 2013). The <IR> is built on six capitals where the one with the most focus is financial capital (Dumay at al., 2016; Flower, 2015). With a focus on financial capital, the study will contribute to the existing literature in the area of corporate disclosure and organizational behavior.
1.2 Purpose
According to Aerts and Cheng (2011), accruals earnings management may increase agency cost due to more information ambiguity. Further, if detected, it may lead to considerable reputation cost for the company and risk accountability of the managers. The purpose of this study is to investigate if managers use earnings management as a façade or organized hypocrisy.
Cho et al. (2015) and Espeland and Hirsch (1990) discusses accounting- and rhetorical symbols to critical stakeholders. The literature offers clear examples of rhetorical
symbols, but fail to deeper discuss the use of accounting symbols. Further, studies regarding earnings management show that managers engage in Discretionary Accruals (DA) management to influence stakeholders in periods surrounding an IPO. Assuming that organizations want to show strength preparing for an IPO (Aerts & Cheng, 2015) and manage the earnings to meet the expectations of continuous growth (Gu & Hu, 2015), it is contributing to study the DA during an IPO from an organizational façade perspective. By investigating managers use of DA earnings management during 44 IPOs on North European public lists, this study aims to answer the research question: Do managers use earnings management as a façade and/ or organizational hypocrisy in situations of IPOs?
The study aims to contribute to the existing literature by proposing that companies use façades to either show strength or hide bad financial performances as an alternative explanation of why companies use earnings management. Scholars have focused on earnings management and organizational façades separately and in different areas of accounting, earnings management in financial disclosures and organizational façades in non-financial disclosures. By combining the two aspects of disclosures, this study provides a deeper understanding of the use of organizational façades and corporate disclosure.
The outline of the study will have the following design. In section two, the study looks closer into the theory and the literature review of organizational façades, organized hypocrisy and earnings management, as well as the theories behind the behavior of companies, namely legitimacy theory and signaling theory. In section three the study presents the method and methodology, including the sample size, the proxy for earning management and the empirical model. The study shows the findings in section four. Section five includes an analysis of the findings and in the final section (section six) the study presents its conclusion and discuss the findings.
2 Frame of reference
2.1 Theoretical background and literature review
Organizations are part of a wide social system where companies exist as an element of a bigger social environment (Cho, 2009). However, even though organizations play a significant role today, they are not living creatures in flesh and bone; they cannot take action by themselves. In order to make long lasting profits, the people in organizations must work efficient and effective, showing respects for the needs, talents, and aspirations of the employees as well as have an understanding of human behavior (Schermerhorn Jr, Uhl-Bien, & Hunt, 2010). Although organizations are defined as a legal person who has rights and obligations, it still is the people within the organization who must make the decisions for the company. In the field of behavioral science,humans are individuals with their own preferences which are assumed to be stable and specific (Brunsson, 1993, 2007). All decisions taken in an organization are the results of human actions, which are the intentional acts, in which people must choose among future alternatives. Organizations are understood to act in the same way as human because they are controlled by humans (Brunsson, 1993, 2007).
The aim of decision-making should be a high degree of rationality. However, Brunsson (2007) states that humans are systematically irrational when they make decisions. People base their decisions upon present preferences even though those preferences may be subject to changes. In order to increase rational behavior organizations have implemented several programs such as balanced scorecards, quality programs, management by objectives, and business process re-engineering (Brunsson, 1993).
Organizations do not exist in a vacuum, they are subjects of others’ thoughts, opinions, and norms. Scholars have examined the behavior of organizations through the lenses of several theories, such as agency theory, institutional theory, and transaction cost theory, but two common theories used to explain the interaction between organizations and the stakeholders are legitimacy theory and signaling theory. Companies seek to legitimate their actions by entering a social contract with society where society (the public in general) provide the company with a license to operate (Cho, 2009). If a company fails the expectations of society, the society could revoke the contract, thus jeopardize the existent of the company. The threat of having this social contract revoked is the reason
why companies put much effort to maintain its contract with society (Patten, 1992). Neu, Warsame, and Pedwell (1998) extend Patten’s (1992) arguments and stress the concordance between the action of a company and the values of the stakeholders as important for the existence for a company. Legitimacy helps companies to assure the flow of capital, customers and the labor necessary for the survival of the company. However, legitimacy can also be delicate; the actions needed to generate money to an entity are constantly in conflict with social norms of stakeholders such as employees, environmentalists, and people living in the immediate area,which may differ from those of the company and the managers(Cho et al., 2015; Neu et al., 1998).
Signaling theory explains how companies and organizations behave when information asymmetry exists between companies and its external stakeholders and how companies use signals to reduce this information gap (Steigenberger & Wilhelm, 2018; Mavlanova, Benbunan-Fich & Koufaris, 2012). In situations where companies must make a decision in times of uncertainty or when they have incomplete or no information at all, they send out signals to reduce this asymmetry. Signals are often actions which provide information to stakeholders about unobservable characteristics, for example, a candidate for a job may use his or her diploma from a high-quality university as a way to signal its competence (Bergh, Connelly, Ketchen & Shannon, 2014).
Signaling theory originates from the work of the Nobel prize winner Michael Spence (1973), in which the author developed the idea of separating equilibrium, the idea that only a few market actors can send out signals so costly to imitate, that it gives these actors a competitive advantage. Signals are, according to Spence (2002), visible means people do when they communicate with each other. According to Espeland and Hirsch (1990) signals can both be written words and numbers but can also take more abstract expression in the form of symbolic functions. Espeland and Hirsch (1990) argue that manipulation of earnings, growth, profits, and debt, managers and companies do, and the way these numbers motivate investors to invest in the company is no more than the symbolic authority of the accounting technology.
Spence (1973) applied his theory on an individual level, where he brought up the example of the labor market. However, scholars have later developed the theory on company or organizational level (Bruton, Filatotchev, Chahine, Wright, 2010; Nam et al. 2014). Basic
communication theory demands a sender and a receiver. In this study, the senders are the companies and the receivers are the potential shareholders who want to invest in the company (Nam et al. 2014). The investors do not have full information about the company but might see the earnings as a signal and will weigh the benefits and costs of investing in the signal and make a rational decision based on the signal they receive (Bergh et al, 2014). The signal companies send out to its receivers affect how much the investors are willing to pay for the company. Arthurs, Busenitz, Hoskisson, and Johnson (2009) noted how low-quality companies exaggerate their prospect to raise as much funds they can. In order to not lose bidding against low-quality firms, high-quality firms must signal the value of their company, for instance by highlight the R&D department for research companies. High-quality firms must create a separating equilibrium by making the signal costly or difficult to imitate (Arthurs et al. 2009; Nam et al, 2014).
Managers in low-quality companies that manage earnings during IPOs will have stronger incentives to sell their shares after an IPO than managers in high-quality companies because they know that their shares are overvalued. The selling of the shares is another signal to the market that managers have information the market does not have, leading to the market selling its share to, thus the company’s stock will decrease rapidly (Nam et al. 2014)
The management’s position gives them access to information which is not available to everyone. This advantage provides the management the opportunity to communicate the information they favor and reduce the information asymmetry between the shareholders and the company (Pham, Chung, Roca, and Bao, 2017). The information communicated to the market could lead to an increase in the stock price, but the information could also not be relevant, thus become less reliable and informative for investors about the performance of the company, leading to a decrease of the stock price (Pham et al. 2017). To separate low-quality attributes and high-quality attributes from each other, hence avoid paying more for low-quality attributes, companies can use investments as signals. Market participants weight the benefits and costs of investing upon the signal and make a rational decision based on that signal. An example to show this problem is the problem of implementing standards. In this example a high-quality and a low-quality firm which gains an extra $300 000 if they implement ISO 14001 (environmental management). A
high-quality company would gain on being certified and a low-quality would not gain on being certified (Bergh et al. 2014). However, if a low-quality company would set up the progressive façade that they will be certified sometime in the future, investors would have the incentive to invest in the company in hope that they will be certified at a certain point in time, thus separating equilibrium and send out a signal to other investors that the low-quality company actually is a high-low-quality company.
Cho et al. (2015) argue that the signaling theory assumes that companies and organizations are unitary actor and act as one. The signal a company sends out must be verifiable by the market; otherwise, the market will ignore the signal. The market constantly compares signals from different companies and organizations in search of evidence consistent with the signal i.e., in this case, the content of the sustainability reports (Cho et al. 2015). If talk and decision are inconsistent with action, the market value the signal as a non-credible signal, leading to the credibility for the company to erode and loss in the trust from the market. It will damage the reputation of the company and may lead to society revoke the social contract; thus, leading to the loss of the legitimacy for the company. In the sense of environmental reporting, sustainability reporting is a way for companies to manage its relationship with its stakeholders, hence the sustainability report signals accountability (Cho et al. 2015). However, Malsch (2013) disagree with Spence’s (1973, 2002) classic view of signaling theory, and argue that sustainability reporting not necessary is consistent with such accountability for the impact of the company.
2.2 Organizational Façades and Organized Hypocrisy 2.2.1 Organized hypocrisy
To meet the conflicting expectations, norms, interests, and demands from various stakeholders of a company, Brunsson (1989, 1990, 1993, 2007) developed the idea of organized hypocrisy. Organized hypocrisy builds upon the assumption that managers cannot meet all the expectation facing a company from its stakeholders and must balance between different demands to meet its contract with society (Mitchell et al., 1997). If influential stakeholders would set a series of oxymoronic claims, companies must be able to develop strategies to meet the demands in order to keep its legitimacy (Cho et al., 2015). Although it is hard for companies to meet all the demands, Brunsson (2007) states
that modern organizations often pretend that they can please conflicting requirements.
One strategy companies use to respond to these conflicting demands is through organized hypocrisy. Brunsson (2007, p. 113) defines organized hypocrisy as “a response to a world in which values, ideas, or people are in conflict – a way in which individuals and organizations handle such conflicts”. People and stakeholders frequently have conflicting and dissimilar thoughts and ideas of what a company should achieve and aim for. For example, companies should be profitable, provide a good working environment, adequate wages to employees, satisfactory customer service, not polluting the environment, and contribute to the prosperity of society. To fully satisfy the demand for profitability means that the company may not fully satisfy other demands, such as no polluting or prosperity of society poorly or fail them completely (Brunsson, 2007).
Hypocrisy only exists if talk and decision have an aberrant value i.e. there are inconsistencies between the rhetoric and the action of a company (Lipson, 2007). Talk, action, and decision are the three predominant output of a company (Brunsson, 2007). They are the tools a company uses to give the company legitimacy and to give different propositions to stakeholders, and organized hypocrisy prevails when talk and decision are discrepant with action (Cho et al., 2015; Lipson, 2007). In organized hypocrisy, the three outputs are causally related to each other, meaning they compensate for each other. To make an idea actionable, managers and companies cannot just think about the idea, they need to talk about it to get attention. Furthermore, they need to put them on paper, to declare the idea as a decision, which is a signal for action to its stakeholders (Brunsson, 1993). Talk and decision compensate for inconsistent action, and action compensate for inconsistent talk and decision (Brunsson, 2003). Actions are in most cases more resource demanding, time- and power-consuming than thoughts and ideas. Organizations often lack the time needed to turn ideas into action, the power to influence influential actors and resources, or action might take so long to implement that the company misses the opportunity or fail to solve the original issue (Brunsson 1993). Ideas and thoughts, on the other hand, are often easy and cheap to talk about, they can be quickly stated, and easily spread. Vague and simple ideas are quite easy to win support for and to compromise with, to win over most of the stakeholders (Brunsson, 1993). However, such ideas and thoughts are often hard to put into action, because they give a very little direction of where to go (Brunsson, 1993). The difference between talk and action are conspicuous, and in order
to progress a company need to separate the two. However, in such cases another issue appears, namely, how can a company guarantee that the right thoughts or ideas control the action. As mentioned above, in contrast with action, which demands realism, solutions, and precisions, talk is often characterized by vagueness, issues, and conflicts. To mitigate the problem, companies may engage in decision-making, which lowers the vagueness, inconsistency, and the variance of talk. It also transforms talk into action by expressing a clear impression (Brunsson, 1993).
Companies can talk about the demanded issues without actually doing something and they can also protect its action from critique by taking contrary decisions that will appease critics and reduce the demands of changing the action (Lipson, 2007). The inconsistent relationship between talk, decision, and action is called counter-coupling by Lipson (2007) and is used by companies as a cheap method to mitigate stakeholder demands, while they focus on more influential stakeholders. Companies could, for instance, talk about stakeholder issues through the press, in news articles, or declare decision addressing future action on websites and social media (e.g. Twitter, Facebook, LinkedIn). Therefore, it is essential for executives to coordinate their talk, action, and decision in a way that gives the company a legitimate tool to meet conflicting stakeholder demands (Cho et al., 2015).
2.2.2 Organizational Façades
Decisions made by investors, employees, managers, competitors, regulators, and leaders about a company are mainly based on organizational façades (Abrahamson & Baumard, 2008). Organizational façades are defined in previous research as a superficial, delusive, or insincere image or effect (Nystrom & Starbuck, 1984) and as “a symbolic front erected by organizational participants designed to reassure their organizational stakeholders of the legitimacy of the organization and its management” (Cho et al., 2015 p.82). Organizational façades were developed by Nystrom and Starbuck (1984); in the beginning, the theory’s only purpose was to give executives tools to establish legitimacy towards its stakeholders, that is, a company must uphold and maintain only one relatively stable façade. In this view, façades give managers time and resources to work with their projects without thinking about the effectiveness, efficiency, or the approval from the stakeholders (Abrahamson & Baumard, 2008). Later scholars have diverged from this
early interpretation of organizational façades; instead, companies use façades in several roles when they communicate to their stakeholders (Cho et al., 2015). Scholars have identified three specific façades companies use in managing stakeholders; rational façades, progressive façades, and reputation façades (Abrahamson & Baumard, 2008) Abrahamson and Baumard (2008) base rational façades on the concept of rational norms developed by Meyer and Rowan (1977). According to the authors, rational norms exist in institutionalized social structures through rules, meanings, and understanding. Company policies, positions, procedures, and programs are upheld by stakeholders through their public opinion (Meyer & Rowan, 1977). A rational façade provides the impression that companies uses techniques that are rational for the stakeholders and meet the norms of society; for instance, decisions based on cost/ benefit analyses are rational in the eyes of the shareholders (Abrahamson & Baumard, 2008; Cho et al, 2015). Managers use rational façades in four different ways. First, they serve as a protection wall where companies can develop innovation, changing procedures and design new façades. Second, rational façades are used by companies to shift focus fromunfortunate events. In a situation where companies cannot find a solution to a problem, a façade could create a new problem which the company can present a solution to, thus divert focus from the original problem. Third, rational façades allow companies to relinquish the overhead cost of implement expensive processes which will have little use for the company. Lastly, it allows companies to do business in an unconventional or an atypical fashion, allowing managers and other employees to work with the departments and units that best serve the need of the unit (Abrahamson & Baumard, 2008).
Companies use progressive façades to provide proof to the stakeholders that the company is aware of their demands and act upon them. As Cho et al (2015, p. 82)) express it “not only fit the norms of rationality, but also mirror norms of progress”. Progressive façades are rational and display a commitment to traditional notions of progress. This façade uses forward-thinking language, state-of-the-art technology, and processes of continuous improvement. The norm for progressive façades is the use of the most modern and upgraded techniques to reach the end goals of the company. Progressive façades pressures managers to upgrade its management techniques to the latest, modern ones. These techniques are façades because they are more symbolic than practical (Abrahamson & Baumard, 2008).
According to Abrahamson and Baumard (2008), progressive façades play three slightly different roles. The first two roles are to hide the stagnation of development within the company and to provide the illusion that the company uses the most up-to-date management techniques. Companies and organizations are under constant pressure from external stakeholders to improve and use modern management techniques, even though many companies have lost the development momentum. Abrahamson and Baumard (2008, p.446) compare this role of the progressive façade as to “putting old wine in new bottles”. A lot of the progressive façades companies set up will fall apart over time. The reason for these collapses, could be that the purpose of progressive façades is emblematic and not a pragmatic one (Abrahamson & Baumard, 2008). Lastly, progressive façades help lower management to convince senior management on decisions that otherwise would have been rejected. It gives lower managers a buffer, where, for instance, engineers can be innovative, experimental and have control over their projects, without being micro-controlled from the board of directors (Abrahamson & Baumard, 2008).
Reputation façade is the crafting of a company’s legitimacy by fortifying a positive picture of the company. Companies and organizations gain reputation by providing stakeholders means that benefits them, such as providing them with safe products, following acceptable standards and regulations, helping stakeholders in need. Reputation façades are the most abstract façade. Managers use symbols, stories, or other characteristics to set up reputation façades to give the company a shiny cover (Abrahamson & Baumard, 2008). Such symbols could be the language found in the annual reports and press releases or the codes of conducts. Reputation façades uphold the image of social, environmental, and corporate values, and when a company engages in unethical or immoral actions, stakeholders do not regard the violation of these values. In this way, companies disguise intolerable performances (Abrahamson & Baumard, 2008). Furthermore, reputation façades project a positive image of the company. If investors, managers and stakeholders have a positive image of the organization their expectation will increase and they will allow management more risk-taking in decision-making (Abrahamson & Baumard, 2008). The façades hide the current capabilities of the company, allowing them to get investments from stockholders, which would perhaps not happen if investors assessed the company based on realistic capabilities.
It is, however, important to notice that it is managers who put up façades and not the organizations themselves. As Brunsson (2007) notice; managers make decisions based on a series of assumptions, where they search for the best solutions in order to solve a problem. As mentioned above, the decisions may cause conflict between stakeholder demands, meaning that there will always be stakeholders that critically examine the action of the company. When the examination of an organization reaches a certain point, the façades and hypocrisy are exposed (Cho et al., 2015). However, as Brunsson (2007) stresses, most stakeholders are bystanders which have little knowledge of the action of the company and will not scrutinize the company’s action. To those stakeholders, companies will use the talk, and decision approach to put up façades. To the small portion of stakeholders who examine the company extensively, companies usually use the action approach to manage these types of stakeholders. Cho et al. (2015) argue that façades are limited in their long-term effectiveness. Time is critical when a company sets up façades because there will be one point in time when the future becomes the present and stakeholders no longer accept the talk or decision of future action. If this happens, a company cannot admit the structure behind the façades or that they cannot coordinate its talk, decision, and action. It would severely damage the trust for the company and the legitimate status through the social contract with society would be revoked by stakeholders. To avoid getting in a situation of lost confidence due to the exposing of the façades, it is a necessity for companies to present themselves as a unified actor who through its talk and decision can deliver the promised action (Cho et al., 2015).
A common misconception pointed out by Brunsson (2007) is that organized hypocrisy and organizational façades have a negative impact on society. However, both Abrahamson and Baumard (2008) and Brunsson (2007) emphasize the positive outcomes of hypocrisy and façades. Hypocrisy provides an opportunity for changes which would not emerge without organizational hypocrisy (Brunsson, 2007). Abrahamson and Baumard (2008) suggest in their article that organizational façades can be an incentive to improve the organization and enhance the capabilities for improvements. For instance, by implementing a new management technique, companies show stakeholders they are modern and use the latest fashion.
Christensen, Morsing and Thyssen (2013) argue that it is not necessary that organizational façades and organizational hypocrisy will provide companies legitimacy, just because
they can generate a positive impact on society. In their study of the existence of hypocrisy in Corporate Social Responsibility (CSR) reporting, they notice, to balance legitimacy and efficiency, companies leave intentional gaps between its functions and activities, which allow them to set up façades of honesty while they continue to practice non-environmentally friendly practices. In order to improve CSR reporting, companies cannot be ambidextrous in their talk about sustainability, they must be aspirational to get legitimacy. The difference between aspirational talk and a lie is that aspirational talk generates expectations about the future. A company that can convince its stakeholders that the talk was aspirational and not a lie if the façade would crack will gain the legitimacy and generate new expectations about the future (Cho et al, 2015).
2.3 Earnings Management
An area, scholars have studied comprehensively is earnings management. According to El Diri (2018), there are multiple definitions of earnings management. This study will use the definition of Ronen & Yaari (2011, p.26), which state that earnings management is in contrast to fraud, legal and within the GAAP regulations and write: “Earnings management occurs when managers use judgment in financial reporting and in structuring transactions to alter financial reports to either mislead some stakeholders about the underlying economic performance of the company or to influence contractual outcomes that depend on reported accounting numbers.”
The early studies of earnings management focused on the capital market and if earnings management affects stock prices (Ball & Brown, 1968; Ball, 1972; Kaplan & Roll, 1972; Rath & Sun, 2008). The studies were mainly conducted under the Mechanistic Hypothesis or the Efficient Market Hypothesis (EMH). The Mechanistic Hypothesis assumes that investors might be misled by earnings management, as financial reports are assumed to be the only source of corporate information (Ball, 1972; Rath & Sun, 2008). According to EMH stock prices is unbiased of managerial accounting choice as investors have access to all information resulting in stock price adjustment to the fair value (Rath & Sun, 2008). Watts and Zimmerman’s (1978) Positive Accounting Theory (PAT) moved the focus of Earnings Management research to find why earnings are managed. Their study found that large companies, with the risk of governmental interference manage earnings by investing in low-risk assets to avoid large growth and with that reducing political cost. Further,
earnings are managed to avoid failing debt covenants and to improve the payments of bonus plans (Watts & Zimmerman, 1978).
Dechow and Skinner (2000) investigate the differences between researchers, practitioners and regulators view on earnings management and conclude that there is a need to understand manager incentives to manage the earnings. The study offers what to look for to find earnings management; companies with large accruals has a greater difference between earnings and cash flows and companies with week corporate governance are more likely to manage earnings. Further, they propose academics to focus on company’s pursuit towards benchmarks and companies desiring to issue equity (Dechow & Skinner, 2000).
Following Dechow and Skinner’s (2000) study, researchers have performed numerous studies in Dechow and Skinner’s proposed areas. For instance, Dechow, Richardsson, and Tuna (2003) studied the irregularity in the profit distribution and did not predict high DA for organizations that could not avoid a loss. Dechow et al.’s (2003) prediction was in line with Riedl’s (2004) study that found evidence that organizations used Big bath expense to gain long-term gains after a year of losses. In contrast to Dechow et al.’s (2003) hypothesis, the study did not find a significant difference in positive DA between small profit, and small loss firms. The discussion covers the possibility of an insufficient explanatory power as one explanation, however external influence and real actions are proposed as alternative explanations. Hansen (2010) found an alternative explanation to Dechow’s et al. (2003) high DA for small loss firms. The author argues and provides evidence that small loss firms with high DA use earnings management for other benchmarks (Hansen, 2010). Adjusted for small loss firms with other benchmarks, the study provides a significant difference in DA between small loss firms and small profit firms. Gu and Hu (2015) provided evidence, using an accruals model, that companies use earnings management to reach benchmarks. The results are in line with PAT and it confirmed Hansens (2010) finding, as it finds a positive correlation between loss avoidance and earnings management. Gu and Hu’s (2015) results regarding forecast achievement and continuous growth are related to stock market objectives and provide further evidence to Hansen’s (2010) alternative benchmark hypothesis.
Earnings management research relating to the investment market provides insight into both management incentives to please the stock market and the investors’ ability to use report information. Ben Amar, Ben Salah and Jarboui´s (2018) study found a positive correlation between DA and the dividend policy of the company. The authors concluded that their finding was in line with signaling theory, managers want to reduce the information asymmetry between the company and the market and highlight the company’s ability to pay dividends to its shareholder, thus signaling strength to investors. Cohen, Darrough, Huang, and Zach (2011) studied warranty accruals valuation and found evidence that the warranty accruals signal product quality to customers and that investors rationally priced the stocks according to the over or understated warranty accruals. Controlled for signaling, the market reduced the stock value dollar-for-dollar to an abnormal reduction in warranty accruals, providing evidence of information specific market efficiency. Lo et al. (2017) investigated the readability of financial reports and found new evidence that organizations conducting earnings management decreased the readability of Management Discussion and Analysis (MD&A) section of annualreports as a method to cover misleading information. The reason for the low readability was that it is harder to back up a lie than to write the truth. Earnings management is not lying, although it violates comparability, making it hard to present the desired picture in a readable manner (Lo et al., 2017).
For managers, to reach the objectives of them self and their organization, they have the possibility to manage earnings up and down. In periods where the earnings are smaller than desired, managers might increase the earnings to avoid reporting a loss, to reach an analyst expectation or to reach a bonus level (Gu & Hu, 2015; Hansen, 2010; Watts & Zimmerman, 1978). When the benchmarks and a profit is out of reach, the managers have the incentive to report as much costs as possible, the Big bath expense, in order to move costs from upcoming years and providing the opportunity of future higher earnings (Riedl, 2004). According to Riedl (2004), one year with a large loss affect the market less, than multiple years of small losses. On the other hand, when an organization performs better than the market expects, managers have the incentive to use earnings smoothing and report the earnings in accordance with the expectations (Graham, Harvey & Rajgopal, 2005). According to Graham, Harvey and Rajgopal (2005) managers expect the market to react positively on low volatile earnings, meeting or slightly exceeding expectations.
By managing the high profit down to the expected level, the company provides a buffer to use in periods where the earnings would have been lower than expected, smoothing the earnings between periods.
The IPO of a firm has been studied with a focus on earnings management, value, and the effect on stakeholder over the years (E.g. Aerts & Cheng, 2015; Nam et al., 2014; Ritter, 1991). For instance, Aerts and Cheng (2015) studied how the MD&A disclosures were affected by earnings management and found that positive pre-IPO earnings management correlated with vagueness in the report. These findings have similarities with the findings of Lo et al. (2017) as it is hard to be clear and concise, providing explanations for growth built on DA instead of business development. Nam et al. (2014) studied the negative price reaction as a signal of earnings management and found that if pre-IPO owners did not sell their shares at the end of the lock-up period, the market read this as a positive signal of strength and priced the shares favorably. On the other hand, Ritter (1991) studied IPOs from an investors perspective and provided evidence that companies underperform the price of the first closing day listed, compared to three years later. In the short run, the offering price is considered underpriced with an average first-day increase of 16.4%. However, the return after three years was of 83% of the price paid at the first closing day indicating periodical over-optimism (Ritter, 1991).
2.3.2 Measurement of Earning Management
Within Earnings Management and earnings quality studies, scholars have used accruals models to investigate if audit fee levels affect earnings quality (E.g. Frankel, Johnson, & Nelson, 2002; Larcker & Richardsson, 2004; Palmrose, 1986; Simunic, 1984). The combined findings did not provide clear evidence that audit fees affect the audit quality, although Larcker and Richardsson (2004) provided a strong correlation between non-audit fees and DA. The development of the modified Jones Model used in recent research, from the Jones (1991) to Dechow, Sloan and Sweeney (1995) and developed by Larcker and Richardsson (2004), within the above mentioned studies, have contributed to research in Earnings Management (E.g. Ben Amar & Chakroun, 2018).
To isolate the discretionary parts of the total accruals (TA), the expected accruals are to be identified and removed. Jones (1991) provided the standard model used in research to derive DA. The model uses a time series approach for each firm or cross-section for each
industry and focuses on assets and the change in revenues to account for nondiscretionary accruals (NA). Jones (1991) model offered a low explanatory factor leading to the need for modification. Dechow et al. (2003) developed and tested, based on the Jones (1991) model, a series of more advanced models. The modified Jones models offered a higher explanatory factor and identified the discretionary accruals better than the earlier Jones (1991) model. Dechow et al. (1995) deviated from the assumption that revenues are free from managerial discretion and subtracted credit sales from the NA. Larcker and Richardson (2004) further developed the model with a book-to-market (BM) variable to proxy for firm growth and a current operating cash flow (CFO) variable to proxy for performance. The developed modified Jones model strengthens the explanatory power further by isolating the NA in a better way (Larcker & Richardson, 2004).
2.4 Hypothesis development
Discussed in the literature, managers use earnings management to reach targets. The target might be to gain personal benefits in the short run by maximizing a bonus plan (Watts & Zimmerman, 1978) or long run by offering a stable continuous growth (Gu & Hu, 2015). Aerts and Cheng (2015) study provided evidence of positive DA earnings management in the three pre-IPO years. The reasoning that it is important to present the organization as strong and actionable in front of potential investors have similarities to the rational façades discussed by Cho et al. (2015). In line with previous research, the use of DA earnings management is expected in the years prior to the IPO. The first hypothesis is therefore:
H1: Managers conducts DA earnings management prior to the IPO.
As mentioned, managers might have long term targets. PAT discusses three main areas; bonus plans, debt covenants and political cost (Watts & Zimmerman, 1978). Managers use earnings management, as mentioned above, to boost earning, but also to smooth earning by reporting a lower result in one year and transporting that to a later year (Dechow et al., 1995; Riedl, 2004). Cho et al. (2015) and Abrahamson and Baumard (2008) argued that progressive façades are constructed to signal future actions. By using negative earnings management, the company creates a financial buffer that can be used to report higher earnings in the future in line with Gu and Hu’s (2015) discussed continuous growth target. Following this discussion, the second hypothesis is:
H2: Managers conducts negative DA earnings management in the year before, under or closest after the IPO.
3 Methodology and method
3.1 Methodology
To gain an understanding of earnings management, researches use a deductive approach, where they test hypotheses, drawn from theoretical conclusions and by testing these conclusions, scholars can draw its final conclusions (Bryman, 2015). Previous studies on earnings management, such as Ben Amar and Chakroun, (2018), DuCharm, Malatesta and Sefcik, (2001), Riedl, (2004), have tested their theory from a quantitative approach. This study will continue in the footsteps of previous studies and use discretionary accruals to proxy for earnings management in line with Jones (1991), Dechow et al. (1995) and Larcker and Richardson (2004).
Ben Amar and Chakroun (2018) developed a regression model to test if there is a significant correlation between the amounts of CSR reporting and Earnings Management. In their model, they used the Larcker and Richardson (2004) development of the modified Jones Model to proxy for DA. Changing the independent variable, in the Ben Amar and Chakroun’s (2018) model, from indicating CSR reporting to indicate the year previous to the IPO, the year of the IPO or the year after the IPO, the model will enable this study to empirically test the correlation between the IPO year and Earnings Management.
3.2 Sample
The sample selection starts with a list containing North European IPOs for the years 2005-2017, retrieved from "Börsnoteringar” (2019). The study collects its data from the Amadeus database, containing ten years of financial and business data for European listed companies between the years 2008 and 2017. The list of IPOs contains 1014 IPO events between 2008 and 2017 ("Börsnoteringar", 2019). The study initially excludes 889 companies, as they do not appear in the database. Further, the study excludes 845 firms due to lack of financial data for relevant years. The remaining 44 companies, represented in the database have at least five years of succeeding data, covering at least one of the years adjacent to the IPO. The final total sample consists of 44 companies and 330 firm years.
The final sample spans over 20 industries presented in table 1. The most frequent industry is companies that manage companies and enterprises, representing 25% of the total final sample.
3.3 Earnings management proxy
In previous literature using the Jones models, TA is calculated in two ways. Jones (1991) and Dechow et al. (1995) uses a balance sheet approach to calculate the total value. Larcker and Richardson (2004), on the other hand, uses a cash flow approach where the TA is the difference between operating cash flows and income before extraordinary items. Due to limitations in available data, this study uses the balance sheet approach.
Table 1
Industry distribution in the final sample. 20 NAICS industry codes for 44 companies
Industry Freq. Percent Cum. Basic chemical manufacturing 1 2,27% 2,27% Semiconductor and Other Electronic Component
Manufacturing 1 2,27% 4,55%
Motor Vehicle Manufacturing 1 2,27% 6,82% Other Miscellaneous Manufacturing 1 2,27% 9,09% Professional and Commercial Equipment and Supplies
Merchant -Wholesalers 1 2,27% 11,36%
Metal and Mineral (except Petroleum) Merchant
Wholesalers 1 2,27% 13,64%
Machinery, Equipment, and Supplies Merchant Wholesalers 2 4,55% 18,18% Apparel, Piece Goods, and Notions Merchant Wholesalers 1 2,27% 20,45% Wholesale Electronic Markets and Agents and Brokers 1 2,27% 22,73% Deep Sea, Coastal, and Great Lakes Water Transportation 1 2,27% 25,00%
Software Publishers 2 4,55% 29,55%
Wired and Wireless Telecommunications Carriers 1 2,27% 31,82% Nondepository Credit Intermediation 4 9,09% 40,91%
Lessors of Real Estate 1 2,27% 43,18%
Activities Related to Real Estate 1 2,27% 45,45% Architectural, Engineering, and Related Services 3 6,82% 52,27% Computer Systems Design and Related Services 1 2,27% 54,55% Management, Scientific, and Technical Consulting Services 5 11,36% 65,91% Scientific Research and Development Services 4 9,09% 75,00% Management of Companies and Enterprises 11 25,00% 100,00%
[TA=∆Current Assets-∆Current Liabilities-∆Cash+∆Short time Debt-Depreciation expense] where ∆ is the difference between t and t-1.
This study uses Larcker and Richardson’s (2004) development of the modified Jones model to proxy for Earnings Management. In deviation from Larcker and Richardson (2004) an Ordinary Least Square (OLS) models are used, because both the Houseman test and the Breusch-Pagan LM test results were insignificant. Further, the BM variable is removed as the database lacked the data sufficient to calculate the variable. The model used is the following:
TAit=α+β1(∆Salesit-∆RECit)+β2PPEit+β3CFOit+ε were, TAit is the total accruals for firm i in year t.
∆Salesit is the change in sales for firm i between year t and year t-1.
∆RECit is the change in accounts receivables for firm i between year t and year t-1. PPEit is the property, plant and equipment for firm i in year t.
CFOit is the current operating cash flow, calculated as the cash flow from operations to net cash flow, for firm i in year t. To provide comparability between companies and firm years, everything is scaled by A, the average total assets between year t and year t-1. The independent variables aim to capture the NA in the firm. ε is the residual and the difference between TA and NA. DA is the difference between TA and NA, leaving ε as a proxy for DA and Earnings Management (Larcker & Richardson, 2004).
The Jones model uses PPE in gross value to proxy for changes in firm conditions (Jones, 1991). Due to limitations in available data, this study uses PPE in net value. Further, this study calculates CFO without change in inventory and tax liability due to limitations in data availability. These deviations from the original models possess a limitation of the calculated DA in this study.
3.3 Empirical Model
Ben Amar and Chakroun (2018) studied the correlation between earnings management and CSR reporting. In the study, Ben Amar and Chakroun (2018) uses the DA calculated using a modified Jones model as the dependent variable in their empirical model. In their model, the independent variable is a score point constituting a proxy for the CSR activity
measured. Further, the study uses three control variables that have been shown to affect earnings management (Ben Amar & Chakroun, 2018). The first control variable controls for size, as larger companies have a larger performance pressure from the capital market. Ben Amar and Chakroun (2018) uses the natural log of total assets to represent the size of the company. The second control variable is long-term debt to total assets. The debt level is argued to be a risk variable and correlated to earnings management as the measures to avoid violating debt covenants increases with the debt level (Ben Amar & Chakroun, 2018). The purpose of the third and final variable is to control for financial performance. Return on assets is used as a measure of financial performance and have been shown to have a positive correlation with earnings management (Dechow et al., 1995; Ben Amar & Chakroun, 2018). To incorporate a test variable for the periods close to an IPO, the CSR variable is replaced with an IPO dummy to represent the period of interest. The following three OLS models tests the year of the IPO as well as the year prior and post IPO year.
Model 1: DAit= α+β1IPOt-1it+ β2DEBTAit+β3ROAit+ε
Model 2: DAit= α+β1IPOtit+ β2DEBTAit+β3ROAit+ε
Model 3: DAit= α+β1IPOt+1it+ β2DEBTAit+β3ROAit+ε
Were:
DAit is the residuals from the modified Jones model described above.
IPOtit (t-1, t+1) is a binary variable indicating the year of the IPO for firm i in period t.
DEBTTAit is the long-term debt scaled by total assets for firm i in period t.
ROAit is the earnings before extraordinary items divided by total assets for firm i in period
t.
In contrast to Ben Amar and Chakroun (2018), natural log of total asset is excluded as it weakens the models to insignificance in all conventional significance levels.
4 Findings
The descriptive statistics for the variables in this study are presented in Table 2. The number of observations, mean, standard deviation, as well as min and max values, are presented for the studied period between 2009 and 2017. The mean for DA is -0,00 and the median is approximately 0. To further describe the dependent variable Table 3 provides the mean over the different time periods. The mean in time period t is -1.607, significantly different from other time periods.
Table 2
Desccriptive statistics
Variable Obs Mean Std.Dev. Min Max DA 330 -0.000 5.086 -58.181 42.519 IPOt-1 330 0.100 0.300 0 1 IPOt 330 0.100 0.300 0 1 IPOt+1 330 0.109 0.312 0 1 DEBTA 330 0.089 0.166 0 0.865 ROA 330 -0.061 0.359 -3.342 0.618
Further, Table 3 presents the distribution of mean Earnings Before Interest and Tax (EBIT), adjusted EBIT and DA per time period. In total, the organizations report positive results in contrast to t-1 and t, where they report losses. To control for unrepresentative EBIT, the largest reported loss and profit in period t is removed; the adjusted EBIT in time period t-1 is 2290 t€ and in t is 3973 t€.
Table 3
Descriptive statistics of the mean for DA and EBIT in different time periods.
Variable t-1 T t+1 Other years Total DA -0.094 -1.607 0.154 0.222 -0.00 EBIT 1000x€ -171 -2874 3002 13568 9397 EBIT adj 2290 3973 4478 13516 9336
In Table 4, the correlations between the variables are presented. The largest correlation is between IPOt and DA with 0.098402. In Table 5, the variance inflation factor (VIF) test results are presented. The values from the VIF test and the tolerance values shows that the multicollinearity problem is absent with VIF values below 10 and tolerance level over 0.1 (Ben Amar & Chakroun, 2018).
Table 4
Correlation Matrix
DA IPOt-1 IPOt IPOt+1 DEBTA ROA DA 1.0000 IPOt-1 -0.0976 1.0000 IPOt 0.0956 -0.1150 1.0000 IPOt+1 0.0007 -0.1169 -0.1169 1.0000 DEBTA -0.0508 -0.0267 -0.0411 -0.0037 1.0000 ROA -0.0172 0.0187 -0.0240 -0.0757 -0.0289 1.0000 Table 5 Multicollinearity test
Variable VIF Tolerance ROA 1.01 0.992765 IPOt-1 1.03 0.969346 IPOt 1.03 0.967087 IPOt+1 1.04 0.963615 DEBTA 1.00 0.995754 Mean VIF 1.02
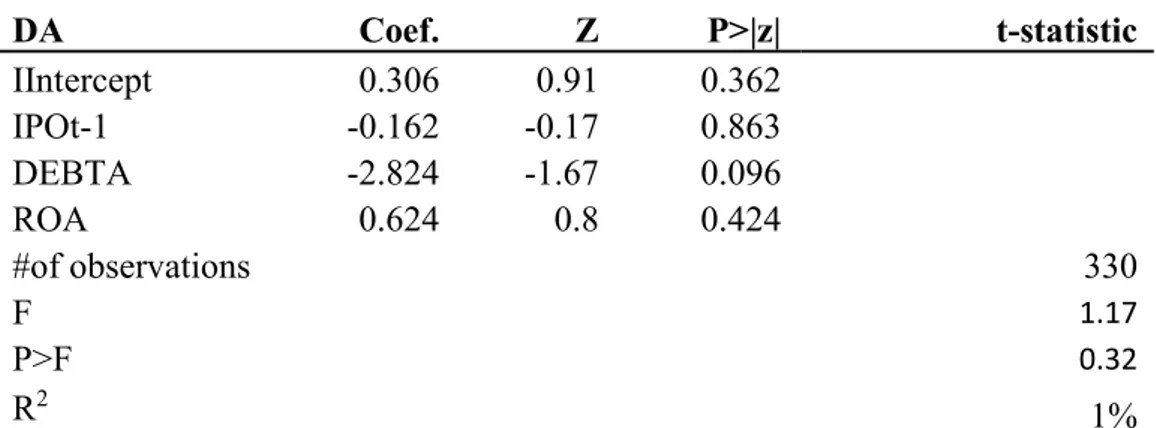
The study presents the results of the three regressions in Table 6, 7 and 8. All three models are regressed on panel data. The Houseman test is conducted to choose between random-effect and fixed-effect panel data models. The insignificant Housman test-statistic propose a random-effect model. Further, a Breush-Pagan LM test for random effects versus OLS is conducted. Failing to reject the H0 of the test indicating that an
OLS model is to be used. Model one and three is insignificant as models and just DEBTTA offers a significant result on a 10% level. Model two is significant on a 10% level with an F-value of 2.49. IPOt is significant at the 5% level and offers a strong
Table 6 DA Coef. Z P>|z| t-statistic IIntercept 0.306 0.91 0.362 IPOt-1 -0.162 -0.17 0.863 DEBTA -2.824 -1.67 0.096 ROA 0.624 0.8 0.424 #of observations 330 F 1.17 P>F 0.32 R2 1%
Note: This model is insignificant.
Table 7 DA Coef. Z P>|z| t-statistic IIntercept 0.484 1.45 0.148 IPOt -1.838 -1.9 0.048 DEBTA -2.962 -1.76 0.079 ROA 0.579 0.75 0.455 #of observations 330 F 2.49 P>F 0.06 R2 2.2%
Note: IPOt is significant at a 5% level. DEBTTA is significant at a 10%
level. Table 8 DA Coef. Z P>|z| t-statistic Intercept 0.267 0.80 0.426 IPOt+1 0.211 0.23 0.814 DEBTA -2.811 -1.66 0.097 ROA 0.635 0.81 0.417 #of observations 330 F 1.18 P>F 0.317 R2 1.1%
The slope coefficient of the IPOt variable is -1.838 which indicates a negative relationship between earnings management and the year of the IPO. Further, the DEBTTA slope coefficient is -2.962 indicating that the debt-level has a negative effect on the use of discretionary accruals earnings management. The R2 of the model is 1,1%, significantly lower than Ben Amar and Chakroun’s (2018) 10-12%. The low R2 is, partly, connected to the limited availability of data mentioned above.
5 Analysis
The findings provide evidence that managers in companies, that are subjects of IPOs, use negative earnings management in the year of the IPO. The significant difference of the DA in the year of the IPO and the mean of DA and adjusted EBIT over the observed period suggests that managers use earnings smoothing as a way to report steady growth over time in line with Gu and Hu’s (2015) continuous growth hypothesis. In contrast, Aerts and Cheng (2015) suggested that managers drive earnings up when facing an IPO. The insignificant findings for IPOt-1 fail to confirm or reject positive earnings
management in IPOt-1.
Following, this study fails to find support for hypothesis 1; Managers conducts DA earnings management prior to the IPO as the findings in year t-1 and t+1 were insignificant and the findings in period t offered a significant negative correlation between the IPO and DA. The significant correlation between IPOt and DA provides support for
hypothesis 2; Managers conducts negative DA earnings management in the year before, under or closest after the IPO.
Watts and Zimmermans (1978) PAT suggests that managers act upon the existing information asymmetry to maximize personal benefits. By performing negative earnings management in IPOt, assuming a profit, managers try to limit political cost by avoiding
unnecessary attention. Further, the smoothening effect of the downward earnings management in IPOt provides improved long term possibilities for profits, and with that
dividend from bonus-schemes (Watts & Zimmermans, 1978).
In Cho’s et al (2015) study, the authors find that the expectation of companies to maximize profit and growth, and the striving for these opportunities is crucial elements of shareholder value today. The linkage between shareholder value and the maximization of revenue is the core of the capitalist economy. A rational façade highlight the efforts to maximize the growth and profit, in an attempt to convince current and future shareholders that the company reaches these goals (Cho et al. 2015). By driving earnings down in IPOt
managers provide a buffer for continuous growth, hence give the investors the image of steady growth in a foreseeable future.
By decreasing the earnings to a level from where the company improve their possibility to reach benchmarks, managers create a sense of security that the company is able to create profit in line with both Gu and Hu’s (2015) benchmark hypothesis and Espeland and Hirsch (1990) argument of accounting as a rhetoric tool. In the IPO earnings management strategy, the concern to entice new owners outbalance the consideration to please the existing shareholders. By rearranging earnings between periods, the action of organizations offers similarities to Cho et al.’s (2015) rational façade by signaling stability towards potential investors. In this sense, the numbers are presented as corporate talk, promising growth and prospect for future owners.
Progressive façades are about the future of the company (Abrahamson & Baumard, 2008). Companies use a progressive façade when they want to talk about future reforms and delay demands required by stakeholders. A progressive façade is recognized by its forward-thinking language, modern technology, and the promise of continuous improvement and growth (Michelon et al. 2016). The result provided by the models does not have the power to provide evidence of the use of progressive façades. However, as mentioned above in the section, companies might use earnings management as a way to project an image of continuous growth. Current shareholders will see a decrease in power when the number of shares increases due to dilution. To keep these important stakeholders satisfied, companies may indirectly use earnings management as a progressive façade to project the image of future financial benefits, such as higher dividends and higher value of the shares, to the current shareholders.
The third façade recognized by Abrahamson and Baumard (2008), Cho et al. (2015) and Michelon et al. (2016) is reputation façade. Reputation façade is the symbolic language of a company. The symbols express the values of the corporation and are often found in the code of conduct or the mission statement, and may emphasize the activities of good citizenship the corporation may involve themselves in, such as philanthropic activities (Cho et al. 2015; Michelon et al. 2016). Cho’s et al (2015) study focus on the rhetorical symbols but mention that the symbols can be both accounting symbols and rhetorical symbols. The findings cannot show any direct evidence of companies putting up a reputation façade in the sense described by Cho et al. (2015). However, as the adjusted EBIT distribution indicates, earnings management might be positive in the years beyond IPOt+1, suggesting that companies want to show a continuous growth, which might be in
line with Abrahamson and Baumard. (2008) and Cho’s et al. (2015) definition of accounting symbols.
Companies engage in organized hypocrisy to manage conflicting interest and social pressure from and between stakeholders (Brunsson, 2007). Brunsson (2007) concludes in his work that companies will never be able to satisfy all demands from its various stakeholders. Cho et al. (2015) suggest in their study that organized hypocrisy takes place across the façades, where progressive talk might be opposed by rational action. The significant negative correlation between the IPOt and earnings management cannot
confirm nor reject the suggestions made by Cho et al. (2015).
According to Ben Amar et al. (2018), it exists two different perspectives in the area of signaling theory, the opportunistic perspective and informative perspective. The negative correlation between IPOt and the DA indicates that managers want to smooth earnings to
send the market and future investors a signal of future growth and prospect in order to decrease the information asymmetry and to show strength, which is in line with Ben Amar’s et al (2018) study.
6 Conclusions and Discussion
This study uses a panel data set on IPO firms to investigate if managers use discretionary accruals earnings management to put up a façade towards financial stakeholders. Using panel data of 44 newly listed companies, the findings did not offer significant results for the year before and after the IPO, whereas the year of the IPO offered a significant negative relationship between the year of introduction and earnings management. These findings failed to support the hypothesis that managers use earnings management to boost earnings prior to the IPO in contrast to Aerts and Cheng’s (2011) findings. Further, the findings provided support for the second hypothesis that managers use negative DA earnings management in the years surrounding the IPO in line with both Gu and Hu (2015) discussion on continuous growth targets and the progressive façade phenomenon discussed by Cho et al. (2015) and Abrahamson and Baumard (2008).
The findings provide similarities with Watts and Zimmerman’s (1978) PAT regarding both the bonus plan hypothesis as well as the political cost hypothesis as down managed earnings in one period provides the possibility to move value to another time period (Gu & Hu, 2015). Further, the findings show similarities with both signaling theory (Ben Amar et al., 2018), rational facades and progressive facades (Cho et al., 2015; Michelon et al., 2016), as the inconsistent accounting numbers tell the managers story. However, the insignificant results for IPOt-1 and IPOt+1, as well as the significant, negative result for
IPOt, fail to provide support for the pre-IPO boosting of earnings weakening the rational
façade connection. This study argues that the use of earnings management is based on decisions and are in line with the action criteria discussed by Cho et al. (2015) and that the reporting of the inconsistent earning is in line with the talk criteria. This study finds some support that managers use earnings management as façades. However, this is a small study conducted on limited data and further studies are needed to fully reach the purpose of this study.
Whereas the findings in this study did not find support of pre-IPO bosting of earnings other studies have (Aerts & Cheng, 2011;DuCharm et al., 2001; Teoh, Welch & Wong, 1998). Espeland and Hirsch’s (1990) accounting symbols and the thoughts of Abrahamson and Baumard (2008) is in line with the rationale of pre-IPO bosting of earnings as a method to signal strength. By using the possibilities within GAAP to signal