MODELING, SIMULATION AND
OPTIMIZATION OF A SUBMERGED
RENEWABLE STORAGE SYSTEM
INTEGRATED TO A FLOATING WIND
FARM
A feasibility case study on the Swedish side of the Baltic sea, based on the
geographical and wind conditions
PRAJWAL HONNANAYAKANAHALLI RAMAKRISHNA
School of Business, Society and Engineering Course: Degree Project in Sustainable Energy Systems
Course code: ERA401 Credits: 30
Program: Sustainable Energy Systems
Supervisor: Dr. Jan Sandberg Examinor: Dr. Valentina Zaccaria
Costumer: Dr. Pietro Elia Compana, Mälardalen Hogskola
Date: 2019-01-11
ABSTRACT
Mathematical modeling and simulations of a submerged renewable storage system integrated to a wind farm, chosen based on the geographical and wind conditions at the Baltic Sea, gives insight on the feasibility of the submerged renewable storage and an approximation of the payback period and profits that could be generated. Genetic Algorithms were used to obtain the optimal number of spheres for a certain depth, based on 2 objective functions I.e. Minimum Life Cycle Cost (LCC) and maximum reduction in wind curtailment. The new arrangement concept shows that the Initial Capital Cost (ICC) could be decreased by 25% to 60% depending upon the number of sphere employed. Based on the inputs considered in the study, the results prove that the submerged renewable storage system would be feasible, and the profits ranging from 15 Million Euro to 29 Million Euro can be achieved at the chosen location, towards the Swedish side of the Baltic sea. Although, in a real life scenario it is assumed that only up to half of the profits obtained in the results would be achievable. The results also show that, the Pump/Turbine with a high turbine efficiency and lower pump efficiency, generated better profits, compared to a Pump/Turbine running with a higher pump efficiency and lower turbine efficiency. An attempt to increase the round-trip efficiency by adding a multi stage submersible pump, resulted in additional ICC and LCC, which saw a decrease in profits.
Keywords: Renewable ocean storage, storage spheres, Baltic Sea, Pumped Hydro, Modeling, Simulation, Optimization, Offshore wind farm, Storage sphere Integration, feasibility study, Genetic Algorithm, Multiple objective function, Life cycle cost, Payback period, Profit.
PREFACE
This report is the outcome of the final year Master Thesis Project in the program “Sustainable Energy Systems”, which was carried out at Mälardalen Hogskola, Vasteras, Sweden. The report sheds light on simulating and optimizing the renewable storage system integrated to a wind turbine, based on the geographical and wind conditions in the Baltic sea. The Master Thesis work was proposed and carried out by myself under the guidance of Dr. Jan Sandberg and Dr. Pietro Elia Compana.
I would take this opportunity to thank Dr. Pietro Elia Compana who has been my mentor and has stood by me through thick and thin. I would also like to thank Prof. Eva Thorin and Dr. Jan Sandberg for encouraging me and giving me the opportunity to work on my thesis. Lastly, but most importantly I’d like to thank my parents who supported me and made it possible for me to pursue my studies in Sweden, for which I will forever be in their debt.
Mälardalen Hogskola/Vasteras, in December 2018 Prajwal Honnanayakanahalli Ramakrishna
“In loving memory of my grandparents, who worked hard for their
todays for our better tomorrows”
SUMMARY
The concept of renewable ocean energy storage (ORES) was proposed by (Slocum et al. 2013). Their journal provides an overall analysis of the concept of energy storage under the sea. According to (Slocum et al. 2013) the immense hydrostatic pressure that the deep oceans contain can be utilised by implementing economical utility scale concrete storage spheres in a calm and uninterrupted offshore environment. The ORES works by generating power while the pressurised water flows into the sphere via a pump/turbine, and the same pump/turbine is used to pump the water back to the ocean in order to store energy (Slocum et al. 2013). A new storage sphere arrangement concept was proposed to reduce the ICC and LCC of the storage spheres. Based on the new storage arrangement, a mathematical model was
developed to model the integration of the submerged storage system with an offshore wind farm. The aim of the study was to carry out simulations for the wind conditions at a chosen location in the Baltic Sea, and to optimize the number of storage spheres required, for the given wind conditions, electric load and Sea depth. The feasibility of the most optimal number of spheres at the given location and conditions would be assessed, based on the profitability and the payback period. Sensitivity analysis was carried out for various
efficiencies, Sea depth and electric loads to analyse the impacts on profitability and payback period.
Theoretically, a location in the Baltic sea with the highest depth was selected as a deployment site for the storage spheres. For the same location, an offshore floating wind farm was
assumed to be deployed, and the wind profile data for 1 year was procured for the chosen deployment site. The integration of the storage system with a wind farm was modelled in MATLAB by using and altering the OptiCE code (Campana et al. 2017). Some of the input data such as screen system cost, sphere cost, Pump/Turbine cost, efficiency etc, were taken directly from (Hahn et al. 2017). Some of the electric equipment capacity and costs were scaled up by 2 times to meet the new concept and electrical load assumptions.
The working principle here is, when the power generated by the wind turbine exceeds the required electric load, the excess power would be utilized to charge the storage sphere by pumping water out of the sphere (Slocum et al. 2013). Similarly, when the power generated by the wind turbine does not suffice the required electric load, electricity is generated by allowing water to run through the turbine in the sphere, due to the hydro static pressure (Slocum et al. 2013).
Simulation were carried out for different scenarios I.e. for various Pump/Turbine efficiencies and cost, at a depth of 400 meters. Based on these inputs, the optimal number of storage sphere best suited for that depth were calculated using multiple objective Genetic Algorithm. The optimization of the storage spheres was done based on two objective functions i.e. Reduction in LCC and Reduction in wind curtailment. The optimal solutions obtained were further subjected to selection by using Grey Relational method, where a single optimal solution was chosen based on the rank. Similar to the Grey Relational method (GRA), an optimal solution was selected via manual method, where the differences were compared. Depending on the solution obtained by grey relational analysis and manual method, the
profits generated by utilizing the energy (selling electricity) which was stored in the storage spheres and the time taken to obtain these profits for both the methods, were calculated. The results prove that the submerged renewable storage system would be feasible, and the profits ranging from 15 Million Euro to 29 Million Euro can be achieved at the chosen location, towards the Swedish side of the Baltic sea. Although, unexpected maintenance and other costs could jeopardize the profits. In reality, it is assumed that only up to half of the profits obtained in the results would be achievable. Note that, to generate the profits obtained in the study, the inputs such as interest rates, increment in electricity price, tax exemption must be considered. Employing the new storage sphere arrangement, the Initial Capital Cost was reduced by approximately 25% for 5 spheres to 60% for 120 spheres. The reduction in cost was achieved by trying to reduce the number of spheres connected to the grid and thus reducing the grid connection cost. Depending on the project lifetime, the selection of optimal solution using GRA is preferred at depths greater than 1000 meters. This is because, the optimization completely focuses on the two-objective functions, while the project lifetime was not considered. Hence, the solution obtained results in lower or no profits at a lower depth, due to a high initial investment cost of the spheres employed.
Whereas, the manual selection method is preferred for depth lower than 1000 meters, to ensure greater profits and low payback period. This is because, the selection of number of spheres from the pareto front was chosen manually, with an emphasis on the project lifetime. Highest profits were generated when the Pump/Turbine had higher turbine efficiency and a lower pump efficiency.
While the increase in the round-trip efficiency due to the addition of a multistage
submersible pump would generally lead to better wind curtailment, higher power generation and profits, the costs involved for an additional multi stage submersible pump to reach that high round trip efficiency, makes it impractical. This would lead to higher ICC, LCC and lower profits. Hence, a Pump/Turbine is preferred over a Pelton wheel and a multi stage submersible pump, keeping the LCC costs low at higher depths and to produce competitive profits. The results also show that, the Pump/Turbine with a high turbine efficiency and lower pump efficiency, generated better profits, compared to a Pump/Turbine running with a higher pump efficiency and lower turbine efficiency.
The results obtained in the study gives an estimation of the profits that could be achieved by employing the submersible storage sphere system at the chosen location at the Swedish side of the Baltic Sea, for various depth and electric load conditions.
CONTENT
1 INTRODUCTION ...1 1.1 Background ... 2 1.2 Purpose/Aim ... 4 1.3 Research questions ... 4 1.4 Delimitation ... 4 2 METHOD ...53 THEORETICAL FRAMEWORK/ LITERATURE STUDY ...6
4 CURRENT STUDY ... 14
4.1 Storage unit deployment location ...14
4.2 Wind data and floating wind turbine ...15
4.3 Battery/Storage sphere ...17 4.4 Grid ...20 4.5 Operational Strategy ...20 4.6 Simulation ...21 4.6.1 Scenario 1 ...21 4.6.2 Scenario 2 ...21 4.6.3 Scenario 3 ...22
4.6.4 Sensitivity analysis of scenario 3 for different load profiles ...22
4.7 Multiple objective optimization using Genetic Algorithm ...23
4.8 Optimal population selection method ...24
4.8.1 Grey Relational Analysis ...24
4.8.2 Manual method ...25
4.9 Payback Period and Profits ...25
5 RESULTS ... 27
5.1 Cost of the spheres based on the new arrangement concept ...27
5.3 Results for the deployment site at the Baltic sea ...28
5.3.1 Scenario 1 ...28
5.3.2 Scenario 2 ...32
5.3.3 Scenario 3 ...35
5.4 Sensitivity analysis of Scenario 1, 2 and 3 for load 1 at various depths ...39
5.4.1 Results for rank 1 population in scenario 1, 2 and 3 at various depth using GRA ...40
5.4.2 Results for manual selection of population in scenario 1, 2 and 3 at various depth ...43
5.5 Sensitivity analysis of Scenario 3 for various loads ...46
6 DISCUSSION... 50
7 CONCLUSIONS ... 54
8 SUGGESTIONS FOR FURTHER WORK ... 55
LIST OF FIGURES
Figure 1 : Chosen deployment location (GOOGLE EARTH n.d.) ... 14
Figure 2 : Distance from the offshore location to the shore (GOOGLE EARTH n.d.) ... 15
Figure 3: Wind power curve ... 16
Figure 4 : Storage sphere and its components ...18
Figure 5 : Storage sphere arrangement concept ... 19
Figure 6 : Storage sphere with Pelton wheel and a multi stage submersible pump ... 22
Figure 7: Storage sphere cost curve for scenario 1 and 3 ... 27
Figure 8 : Charging and discharging of a storage sphere ... 28
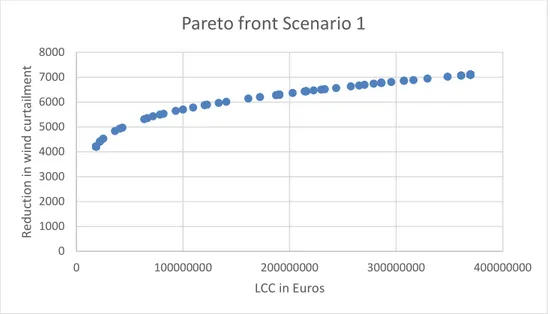
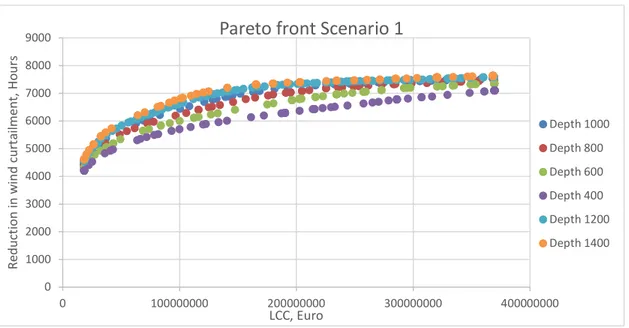
Figure 9 : Pareto front showing 100 of the most optimal solutions for scenario 1 ... 31
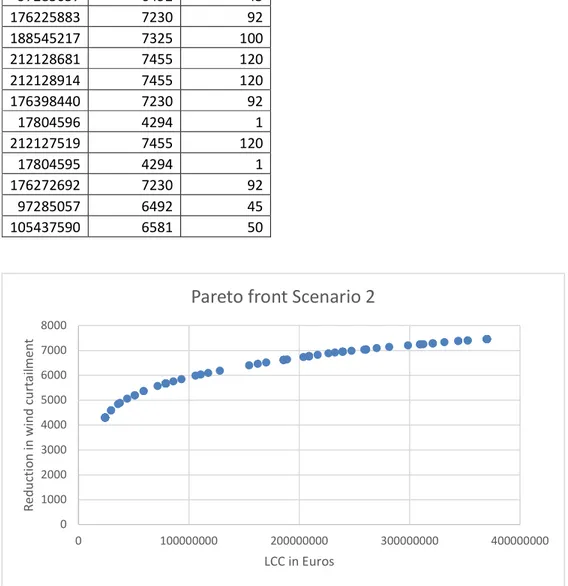
Figure 10 : Pareto front showing 100 of the most optimal solutions for scenario 2 ... 34
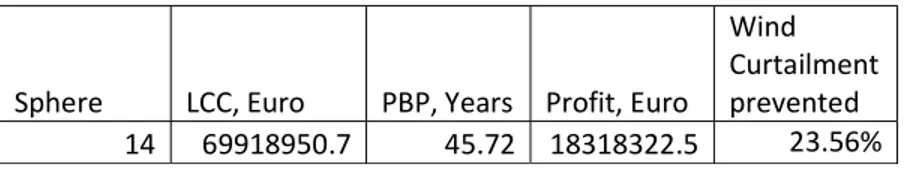
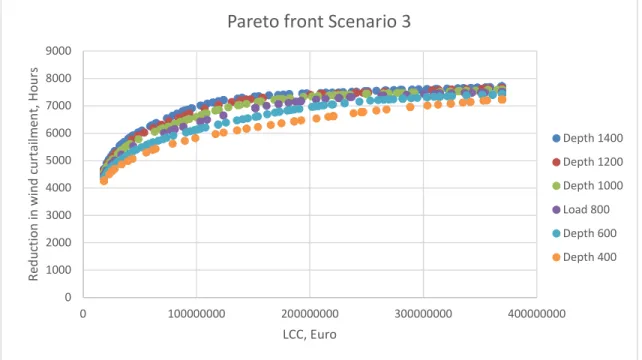
Figure 11 : Pareto front showing 100 of the most optimal solutions for scenario 3 ... 37
Figure 12 : Pareto front showing 100 of the most optimal solutions for scenario 1 at various depths at load 1 ... 39
Figure 13 : Pareto front showing 100 of the most optimal solutions for scenario 2 at various depths at load 1 ... 39
Figure 14 : Pareto front showing 100 of the most optimal solutions for scenario 3 at various depths at load 1 ... 40
Figure 15 : Most optimal rank 1 spheres based on GRA at various depth ... 41
Figure 16 : Reduction in wind curtailment depending on the number of spheres at various depth ... 42
Figure 17 : LCC for a number of spheres at various depth ... 42
Figure 18 : Payback period for several spheres at various depth ... 43
Figure 19 : Profit for several spheres at various depth ... 43
Figure 20 : Reduction in wind curtailment based on the 14 spheres at various depth ... 45
Figure 21 : LCC for 14 spheres at various depth ... 45
Figure 22 : Payback period for a fixed number of spheres at various depth ... 45
Figure 23 : Profit for a fixed number of spheres at various depth ... 46
Figure 24 : Pareto front showing 100 of the most optimal scores for scenario 3 at load 2 for various depth ... 46
Figure 25 : Pareto front showing 100 of the most optimal scores for scenario 3 at load 3 for various depth ... 47
Figure 26 : Reduction in wind curtailment for a fixed number of spheres at various depth and loads ... 48
Figure 27 : Payback period for a fixed number of spheres at various depth and loads ... 49
LIST OF TABLES
Table 1 : Initial capital cost for spheres ... 17
Table 2 : Reduction in ICC via new arrangement method ... 27
Table 3 : Optimal Scores and population for scenario 1 ... 28
Table 4 : Results for rank 1 population in scenario 1 using GRA ... 31
Table 5 : Results for manual selection of optimal population in scenario 1 ... 31
Table 6 : Optimal Scores and population for scenario 2 ... 32
Table 7 : Results for Rank 1 population in scenario 2 using GRA ... 34
Table 8 : Results for manual selection of optimal population in scenario 2 ... 35
Table 9 : Optimal scores and population for scenario 3 ... 35
Table 10 : Results for Rank 1 population in scenario 3 using GRA ... 38
Table 11 : Results for manual selection of optimal population in scenario 3 ... 38
Table 12 : Results for rank 1 population in scenario 1 at various depths using GRA ... 40
Table 13 : Results for rank 1 population in scenario 2 at various depths using GRA ... 40
Table 14 : Results for rank 1 population in scenario 3 at various depths using GRA ... 41
Table 15 : Results for manual selection of fixed number of spheres for scenario 1 at various depth ... 43
Table 16 : Results for manual selection of fixed number of spheres for scenario 2 at various depth ... 44
Table 17 : Results for manual selection of fixed number of spheres for scenario 3 at various depth ... 44
Table 18 : Results for scenario 3 for load 2 at various depth ... 47
Table 19 : Results for scenario 3 for load 3 at various depth ... 47
NOMENCLATURE
Symbol Description Unit
[F] [heat value of fuel] [MJ/kg]
[P] [Power] [W]
𝑣 Available Wind speed m/s
ur Wind speed at height zr m/s
zr Height i.e. 10 meters m
𝜌 Air density Kg/m3
𝑃𝑜𝑤𝑒𝑟 Rated power W
𝑣i Cut in wind speed m/s
Symbol Description Unit
𝑣r Rated wind speed m/s
A Area of rotor m2
Cp Co efficient of power
𝑉 Volume of the storage sphere m3
𝜌 Density of salt water Kg/m3
ƞ Turbine efficiency
g Gravitational force m/s
H Head/Depth m
𝐶 Charge capacity MWh
ƞ Pump efficiency
𝜎 Self-discharge rate on hourly basis
𝐸 Electric load Wh
𝐵 𝐵
Charging and discharging of the
storage sphere Wh
𝑊𝑖𝑛𝑑 𝑝𝑜𝑤𝑒𝑟 Wind power curtailed Wh/year
an Annual O&M costs Euro
S Salvage cost electric equipment Euro
N Project lifetime Euro
𝑊𝑃𝐶𝑢𝑟𝑡𝑎𝑖𝑙𝑚𝑒𝑛𝑡 Wind power curtailed without
storage spheres for year t Wh/year 𝑊𝑃𝐶𝑢𝑟𝑡𝑎𝑖𝑙𝑚𝑒𝑛𝑡 Wind power curtailed with
storage spheres for year t Wh/year ƞ Round trip efficiency of
pump/turbine
ABBREVIATIONS
Abbreviation Description LCC Life Cycle Cost ICC Initial Capital Cost PBP Payback Period kms Kilometre
Abbreviation Description
m Meter
GRA Grey Relational Analysis GRC Grey Relational Coefficient NPV Net Present Value
CF Cash Flow Annually
𝛾 Grade or Rank for all GRC values
DEFINITIONS
Definition Description
𝐻 Number of hours the wind turbine and the storage sphere prevent wind power curtailment in a year.
1 INTRODUCTION
The environmental concerns regarding climate change along with the uncertainty of prices in fossil fuels, have led to an increase growth and emphasis in renewable energy, especially wind energy (Foley et al. 2015). Moreover, a substantial rise in grid connected renewable energy has been witnessed in the last decade(Buhagiar 2017). Solar energy and wind energy along with other renewable energy sources are a form of clean energy readily available in
abundance, provided the sun shines and the wind blows. This intermittent nature of renewables like wind power generation would lead to difficulties in managing it. A good example of this would be, the low power demands during night time when the wind energy tends to be at its peak (Saadat, Shirazi, and Li 2015). Therefore, even if 100% of the power demand could be sufficed by renewable energy sources, a sufficient amount of back up generation is necessary(Buhagiar 2017). With the worldwide rise in wind power capacity, it is expected to reach 1 million MW by the year 2020 (Foley et al. 2015). In recent years, floating offshore wind turbines have been on the rise globally, due to minimal space restriction and the availability of higher wind speeds compared to on shore wind turbines (Wang et al. 2017). A study conducted on the U.S offshore winds by the National Renewable Energy Laboratory (NREL) predicted there is more than 2400 GW of wind potential at areas where floating wind turbines could be deployed I.e. at an average sea depth of 60 meters and wind speeds
averaging 7m/s. And overall there is more than 4000 GW of potential in U.S offshore wind (Slocum et al. 2013).
Large capacity wind turbines/farms connected to the grid has its disadvantage when the wind power has to be curtailed when the load is minimum and the thermal power plants are subjected to function at its least capacity (Foley et al. 2015). The wind turbines are subjected to curtailment, to minimize the congestion of transmission and to prevent oversupply of electricity into the grid (Balci and Grant 2016). A real-life example of wind curtailment would be what happened in Ireland. In the year 2012, Ireland witnessed curtailment of wind close to 119 GWh, which was estimated to be 8 million pounds in wholesale electric price (Foley et al. 2015). In the UK during the year 2015, out of 36153 GWh of electricity produced by wind energy, 1274 GWh of electricity was curtailed, which estimates to be 90 million pounds in electric price (Balci and Grant 2016).
In the past decade, integration of renewable energy systems to the grid has grown immensely (Buhagiar 2017). Especially, after the agreement that took place at the COP21 climate summit in Paris, the amount of electricity to be generated by renewable sources would only increase (Buhagiar 2017).
As with most renewable energy sources, wind energy available in abundance but intermittent in nature. Integration of wind power to the electric grid can be challenging due to uncertainty of wind speed (Saadat et al. 2015). Predicting and providing steady power can be achieved by
installing an energy storage system, which works by storing the excess energy and rendering it when required (Saadat et al. 2015). While energy storage technologies can be used to solve the intermittency problem of renewable sources, as with all good things it comes with a price tag depending upon the size and the type of technology implemented. Currently for off-shore wind turbines, the capacity factor is said to be less than 50%, which means that the system is not utilized to its full potential (Saadat et al. 2015). Size of the off-shore wind power plants are often a balance of plant cost. Hence the components in the wind power plant such as turbine, generator could be downsized by utilizing storage systems to store energy before electricity generation (Saadat et al. 2015).
For the purpose of back up generation, energy storage would be the top contenders due to their ability to provide load shifting, operational support, grid stability and
reliability(Buhagiar 2017). The problem of intermittency which is rampant in wind, can be overcome by use of energy storage system, which in turn minimises the impact of uncertain wind patterns (Slocum et al. 2013). Also, power plants could be assisted with load levelling capabilities with the help of a utility scale storage system i.e. a scale more than or equal to 10 MW(Slocum et al. 2013).
According to (Directorate-General for Research and Innovation (European Commission) 2001) the energy storage issue is usually overlooked and not taken seriously, but continues to be an important technical challenge. In the year 2003, the U.S department of energy
mentioned storage as one among the top five responsibility that must be undertaken, in order to achieve the “Grid 2030” goals (Foley et al. 2015).
In this study, a new arrangement concept is proposed to cut down the Initial Capital Cost. Whereas, modelling and simulating for the geographical and wind conditions at a chosen location in the Baltic sea, would give an estimation of the profits that could be generated and the feasibility of the storage system.
1.1 Background
According to the California Independent System Operator (CAISO), one of the three pillars that are required for the integration of renewable energy is energy storage(Slocum et al. 2013).
Even in the past, there has always been a necessity to store energy. Large battery energy storage devices can be traced back to 1930 in few for the European countries, where the largest battery storage device which had a capacity of 186 MWh was installed in Berlin (Directorate-General for Research and Innovation (European Commission) 2001).
Since, the submerged storage system is based on the principle of pressurised storage, some of the oldest and widely used form of pressurised storage technologies are mentioned briefly. It is said that pumped hydro storage system is robust and has a deep history of being used which dates back to during the 1890’s in Switzerland and Italy and in the 1930’s in Japan and the United States, where the pumped hydro storage usually operates at a round efficiencies of
70% to 85%(Slocum et al. 2013). The largest among the pumped hydro stations are Bath county pumped storage station in the U.S which has a capacity of 3003 MW and Huizhou pumped storage power station in China with a capacity of 2448 MW. The world’s first saline water pumped hydro storage was built in the year 1999 in Japan which had a capacity of 30 MW(Slocum et al. 2013). What’s fascinating is, during late 1970 a Japanese by the name Morishige, from Mitsubishi heavy industries in Tokyo, was the first to propose the concept of large bottom mounted structures for the purpose of pumped hydro storage(Slocum et al. 2013). A pumped hydro storage generally consists of an upper reservoir and a lower
reservoir. Water is allowed to flow out from the upper reservoir towards the lower reservoir, through a Francis turbine/pump, in order to generate electricity when the load or demand is at its peak. The exact opposite is done when the load or demand is at its minimum i.e. the water is pumped back up to the upper reservoir from the lower reservoir with the help of the Francis turbine/pump now acting as a pump. The capacity of the system to generate power is proportional to flow rate and the head I.e. the difference in height between the upper and the lower reservoir(Slocum et al. 2013). (Wang et al. 2017) mentions that, pumped hydro storage due to its immensely long payback periods I.e. usually 40 to 80 years and upfront capital investment, are becoming less attractive in an economic perspective (Wang et al. 2017). Compressed air energy storage (CAES) is another type of pressurised storage system, where air is the medium being compressed. Compared to pumped hydro storage, compressed air energy storage is a newer development, and currently there are only two compressed air energy storage plants in the world(Slocum et al. 2013). One of which is built in 1978 in Bremen, Germany, which has a capacity of 320 MW, 1.2 GWh and the other plant was the McIntosh Project in Alabama in the year 1991, which had a plant capacity of 110 MW, 2.9 GWh, and use underground caverns as storage place or accumulator (Slocum et al. 2013) (Pimm, Garvey, and de Jong 2014). Here, air is compressed into a storage unit via a compressor during low demands and when the load demand is high, compressed air is reheated and expanded in a turbine. Compressed air storage can be of constant pressure i.e. isobaric or constant volume i.e. isochoric (Pimm et al. 2014). It is estimated that the use of natural gas to pre heat the air before expansion can increase the efficiency to a good 71%(Slocum et al. 2013). Multilevel underwater compressed air energy storage system had been analysed by (Wang et al. 2016), where they concluded that the round trip efficiency of the multilevel compressed air storage system ranges from 62% to 81% at different working modes.
Another novel compressed air energy storage concept is being developed by Bright Energy Storage Technologies in Denver, USA(Energy n.d.). This storage concept uses a thin walled vessel, possibly made out of fabric, to store air. The vessel must be attached to the sea bed in order to overcome the buoyant forces acting against it. It works by pumping air and
compressing it in the storage vessel during minimum load and during high peak demands, and the air is allowed to flow back which is expanded in the turbine(Slocum et al. 2013). The hydro static pressure pressing against the storage vessel ensures the flow of air being
expanded, at a constant pressure.
(Slocum et al. 2013) brought in the concept of renewable ocean energy storage (ORES). Their journal provides an overall analysis of the concept of energy storage under the sea. According
to (Slocum et al. 2013) the immense hydrostatic pressure that the deep oceans contain, can be utilised by implementing economical utility scale concrete storage spheres in a calm and uninterrupted offshore environment. The ORES works by generating power while the pressurised water flows into the sphere via a turbine and the same pump/turbine is used to pump the water back to the ocean in order to store energy (Slocum et al. 2013). (Slocum et al. 2013) states that for the undersea storage system, 70% round trip efficiency is assumed if the turbine/pump system is of the best design and 65% round trip efficiency is assumed
otherwise.
1.2 Purpose/Aim
A new storage sphere arrangement concept was proposed to reduce the ICC and LCC of the storage spheres. Based on this arrangement, a mathematical model was developed to model the integration of the submerged storage system with an offshore wind farm. The aim of the study is to carry out simulations for the wind conditions of a chosen location in the Baltic Sea and to optimize the number of storage spheres required, for the given wind conditions, electric load and Sea depth. The feasibility of the most optimal number of spheres at the given location and conditions would be assessed based on the profitability and the payback period.
Sensitivity analysis will be carried out for various efficiencies, Sea depth and electric loads, to analyse the impacts on profitability and payback period.
1.3 Research questions
Could the initial investment cost of the storage sphere be decreased by implementing new arrangement concepts? And by how much would the costs vary compared to the old arrangement method?
How does the increase in round-trip efficiency of the system have an impact on the Initial investment cost, Life cycle cost and Profitability?
Based on the assumptions and costs considered in the study, would the storage system be feasible at a location for a depth of 400 meters in the Baltic sea?
What are the impacts on profits, when the turbine has higher efficiency than the pump and vice versa?
1.4 Delimitation
- The wind profile selected has been limited to a location at the Baltic sea. - CFD analysis is not considered for this study.
- A prototype or a working model is not considered due to lack of funds. - Offshore floating wind turbine costs and mooring costs are not considered.
2 METHOD
A literature review was carried out to identify the concepts, methods and the research that has been done with regard to ocean renewable storage spheres and its integration to renewable energy devices. Theoretically, a location in the Baltic sea with the highest depth was selected as a deployment site for the storage spheres. For the same location, an offshore floating wind farm was assumed to be deployed, and the wind profile data for 1 year was procured for the chosen deployment site. The procured wind data was for a height of 10 meters above sea level. Hence, the wind data was altered for a height of 80 meters, as the wind turbine hub was assumed to be 80 meters above sea level.
A new sphere arrangement concepts were proposed to reduce the ICC of the storage spheres. Based on the new arrangement concept, the integration of the storage system with a wind farm was modelled in MATLAB using and altering the OptiCE code (Campana and Yang 2017). Some of the input data such as screen system cost, sphere cost, Pump/turbine cost, efficiency etc, were taken directly from (Hahn et al. 2017). Some of the electric equipment capacity and costs were scaled up by 2 times to meet the new concept and electrical load assumptions.
Simulation were carried out for different scenarios i.e. for various turbine/pump efficiencies and cost, at a depth of 400 meters and the optimal number of storage sphere best suited for that depth were found using multiple objective Genetic Algorithm. The optimization of the storage spheres was done based on two objective functions i.e. Reduction in LCC and Reduction in wind curtailment. The optimal solutions obtained, were further subjected to selection by using Grey Relational method, where a single optimal solution was chosen based on the rank. Similar to the Grey Relational method, an optimal solution was selected via manual method, where the differences were compared. Depending on the solution obtained by GRA and manual method and the utilization of surplus wind power to storage energy, the profits generated by selling electricity and the time taken to obtain these profits, for both the methods were calculated. Sensitivity analysis were done for various loads and depths.
3 THEORETICAL FRAMEWORK/ LITERATURE STUDY
To explain the topic of integration, modeling, simulation, optimization and sizing of storage systems effectively, literature that is relevant to the topic is sorted according to the
subheadings below:
1. Novel concepts in energy storage systems.
2. Submerged energy storage or ocean renewable energy storage systems. 3. Selling price, investment costs and other economics.
4. Modelling, simulation and sizing a storage system integrated to a renewable energy generation system i.e. wind turbine or an off-shore wind turbine.
5. Methods to select a pareto optimal solution from the pareto front.
1. Novel concepts in energy storage systems.
The paper by (de Jong 2014) gives an insight on the benefits, factors and prerequisites necessary for the commercial scaling of energy storage in context to storage vessel
deployment depth, volume of the energy bag, structure and storage capacity of the energy bag. The study is based on the use of energy bags which is made up of a fabric vessel similar to that of a balloon and moored to the sea or lake bed, that is used to store compressed air energy underwater (de Jong 2014). As with any energy storage system, it is intended to store energy surplus and utilize it during high demand. (de Jong 2014) describes that the speciality of this method of storage is to utilise the passive pressure available in deep water acting on a vessel, in order to maintain the pressurization of the stored air inside the energy bag. This way, compressed air is expanded through the turbine when necessary. Due to the Deepwater pressure acting on the energy storage bag, the air pressure passing through the turbine inlet would maintain a constant pressure, hence the turbine is made to run at a standard pressure (de Jong 2014). (de Jong 2014) states that the energy storage capacity increases with the increase in storage depth.
Buoyant energy battery storage is a novel energy storage, where the system utilizes the buoyancy of an object in order to store energy through a force transfer mechanism which converts the linear motion of the float into rotational motion(Bassett, Carriveau, and Ting 2017). According to (Bassett, Carriveau, and Ting 2016) the paper emphasises on the underwater energy storage based on the Archimedes principle. The buoyant energy battery storage could be configured according for both offshore wind turbines or onshore wind turbines (Bassett et al. 2016). Tests were conducted and the results proved that the stored energy does not dissipate over time and amount of energy extracted depends upon the speed of the float (Bassett et al. 2016).
The proposed novel system consists of two chambers I.e. external or top gas chamber and bottom or accumulator chamber, which is connected by an umbilical connection. The two fluids I.e. compressed air and water which acts as a liquid piston, where the hydro static pressure of the sea is utilized (Buhagiar 2017). To observe the gas compression process such
as pressure fluctuations and temperature, a thermodynamic modelling of the system is done (Buhagiar 2017).
The paper (Saadat et al. 2015) proposes and models an open accumulator compressed air energy storage systems. Energy is stored in the accumulator based on the liquid air piston type (Saadat et al. 2015). The system consisted of a pneumatic compressor/ expander unit and a hydraulic pump/ motor unit.
2. Submerged energy storage or ocean renewable energy storage systems.
(Slocum et al. 2013) brought in the concept of renewable ocean energy storage (ORES). The paper by (Slocum et al. 2013) provides an overall analysis of the concept of energy storage under the sea. According to (Slocum et al. 2013) the immense hydrostatic pressure that the deep oceans contain, can be utilised by implementing economical utility scale concrete storage spheres in a calm and uninterrupted offshore environment. The ORES works by generating power while the pressurised water flows into the sphere via a turbine and once the concrete sphere capacity it reached, the turbine/pump is used to pump the water back to the ocean in order to store energy (Slocum et al. 2013). (Slocum et al. 2013) states that the storage system might provide renewable energy to the grid near base load economically and that the storage system would be beneficial to a floating wind turbines or any other energy harvesters, by acting as a anchor or a mooring point. The working principle of the system is “when the water gushes into the sphere, the turbine generates electricity. This process would be carried out when the electric consumption demand and cost were both high. Once the sphere is full, the process is reversed where the turbine now acts as a pump, which pumps the water out against the pressure outside the sphere” (Slocum et al. 2013). This process is achieved when the electric consumption and the cost are both low. A vent line is connected to the storage sphere in order to maintain atmospheric pressure. Although the storage system could work under vacuum(Slocum et al. 2013). Results from (Slocum et al. 2013) proved that power generated by the turbine decreased as the water level dropped and the pump needed more amount of power to pump the water out. The design doesn’t approve a full discharge of the water in the vessel, as at least 5% of the volume of the vessel is left with water to
submerge the pump. (Slocum et al. 2013) mentions that, for the fabrication of storage spheres the concrete used would be mixed with an immense amount of fly ash, which help form an artificial reef when left behind. This might in turn enhance the rate of repopulation of the fishes operating at that depth(Slocum et al. 2013). The concepts for a large scale deployment and production which were presented, were based on the fabrication and design of a small scale test unit(Slocum et al. 2013). The feasibility of the design was checked by testing a small-scale concrete sphere which consisted of a pump and a hydro turbine, which was placed at the bottom of a water tower to replicate a real life scenario. Results showed that the selection of a vane pump instead of turbine/pump, and improper pump deployment lead to a system efficiency of 11% which is quite low (Slocum et al. 2013). (Slocum et al. 2013) states that for the undersea storage system, 70% round trip efficiency is assumed if the turbine/pump system is of the best design and 65% round trip efficiency is assumed
otherwise. According to (Slocum et al. 2013) future work would be to develop the storage system in detail, construct, deploy and test a sphere that is 3 meters in diameter at about 40 meters deep offshore.
The new storage technology “StenSea” works by storing energy in concrete hollow spherical spheres in the sea (Hahn et al. 2017). The system which comprises of a pump turbine, inner cylinder and an additional pump inside a concrete hollow sphere would be installed on the sea bed, ranging at a certain depth and is connected to a wind or a PV system (Hahn et al. 2017). The system uses the static pressure of deep waters to generate electricity (Hahn et al. 2017)(Slocum et al. 2013)(Puchta et al. 2017). The paper by (Puchta et al. 2017) mainly focuses on the development and testing of an offshore storage concept, which could be utilised for storing energy that could be converted to electricity when necessary. The system which comprises of a pump turbine, inner cylinder and an additional pump inside a concrete hollow sphere would be installed on the sea bed, ranging at a certain depth (Puchta et al. 2017). In order to achieve this, an analysis and feasibility study was done, which involved factors such as construction of the pressure vessel along with logistics and manufacturing, design of the turbine and pump, integration of the system to the grid depending upon the load, market and economic feasibility calculations, and steps taken to implement it
technically (Puchta et al. 2017). For the analysis, the design of the system was 5 MW and the volume was 12000 m3. The results proved that there is an increase in power as the depth of
installation increases, where the overall energy for an installed system at a certain depth can be increased by increasing or scaling up the volume of the hollow vessel (Puchta et al. 2017). But increasing the size of the hollow vessel can have a logistical impact, and hence a number of smaller hollow spherical vessels are recommended (Puchta et al. 2017). After calculations, which were based on assumptions, the system resulted in a total efficiency of 73%, which includes the engine efficiency and the generator efficiency (Puchta et al. 2017). The system had a storage capacity of 18.3 MWh and some 4 hours charging and discharging time (Puchta et al. 2017). The hollow vessel should be designed such that, the gravitational force of the vessel surpassed the buoyant force of the vessel and the spherical vessel should withstand the ocean pressure (Slocum et al. 2013)(Puchta et al. 2017).
The paper (Wang et al. 2017) is based on the comparison of underwater compressed air energy storage and underground compressed air energy storage, where they propose these two integration methods in order to store the wind energy harvested by an off shore floating wind turbine. The results prove that, compared to the underground compressed air energy storage, the underwater compressed air energy storage tends to have a high exergy density and a higher round trip efficiency (Wang et al. 2017). Although the high exergy density and round trip efficiency tends to reduce beyond a certain storage pressure for both underground and underwater compression air energy storage (Wang et al. 2017).
3. Selling price, investment costs and other economics.
(Slocum et al. 2013) mentions that according to the analysis, implementing the storage system from a depth of 200 meters to approximately 1500 meters would be economically
feasible. From a depth of 200 meters to approximately 1500 meters, the storage cost per MWh would continue to trend downwards, whereas above 1500 meters the storage cost per MWh starts to increase (Slocum et al. 2013).
The paper by (Hahn et al. 2017) is based on the performance and economic analysis of a new storage technology. In the study, an economic simulation model which was developed by the association of German engineers, based on the annuity method, was used to obtain cost assessment results in the Stensea storage (Hahn et al. 2017). The results obtained for this technology was compared to other energy storage technologies such as compressed air storage and pumped hydro storage, based on cost, performance and capacity (Hahn et al. 2017). The results, for a farm which consists of 80 storage units with a capacity of 400 MW shows that, for an economic operation the price ranges from 4 euros ct kWh at 4000 hours to 20 euros ct kWh at 1000 hours per year (Hahn et al. 2017). Also, the cost of investment for 120 units which is 7800000 euros per unit, goes up to 9900000 euros per unit in a 5 unit farm (Hahn et al. 2017). The results show that, for the technology to function economically, it is highly dependent on the annual operation periods and the number of units in the farm (Hahn et al. 2017). The study shows that the cost of investment for pumped hydro energy storage ranges from 600 euros per kW to 3000 euros per kW along with the cost of power generation of 3 euros ct kWh to 10 euro ct kWh (Hahn et al. 2017). Similarly, the cost of investment for compressed air energy storage ranges from 300 euros per kW to 2500 euros per kW along with the cost of power generation of 7 euro ct kWh to 23 euros ct kWh (Hahn et al. 2017). Hence the study was concluded hinting that the Stensea technology was
competitive in cost compared to its counter parts technologies (Hahn et al. 2017). The study by (Hahn et al. 2017) states that, a storage farm consisting of several units would have an economical advantage compared to a single unit, because the investment costs depending on gird connection and permission costs can be distributed. For a farm with 400 MW, the price arbitrage required for the descent operation of the Stensea technology would be 4 euros per kW/h to 20 euro per kW/h, and hence the Stensea technology proved cost efficient compared to that of pumped hydro energy systems and compressed air storage (Puchta et al. 2017). An economical installation depth for the UWCAES (under water compressed air energy storage) would range from 400 meters to 700 meters (de Jong 2014). One among the few disadvantages to this technology is the heat produced during compression is lost due to heat dissipation to the surrounding (de Jong 2014). The other being the regulatory and safety aspects which hinder the commercial scale implementation of UWCAES (de Jong 2014). Finally, for the storage bag technology to be developed and to be economically feasible for commercial grid scale, it largely depends on the storage volume and the pressure needed to suffice requirements, which is the main aim, and the use of flexible fabric to develop energy bags benefits the UWCAES (de Jong 2014).
Simulations proved that the battery storage technology didn’t just reduce the curtailment of wind generation but also reduced the overall cost of planning. (Alanazi and Khodaei 2017) found that, curtailment of wind was immensely low for wind farms with capacity lower than 160 MW, and above this point, the increasing curtailment of wind was noticed. Results showed that, if the capacity of the wind farm is below 160 MW, then it wouldn’t be economically feasible or the cost would increase drastically, in order to install a battery
storage system (Alanazi and Khodaei 2017). Also, the optimal size of the battery storage system increased along with the increase in wind farm capacity (Alanazi and Khodaei 2017). Simulations revealed that the potential for revenue generation was $10337 per year, which is immensely low and hence the system is not yet viable financially if the revenue is generated only by the buying and selling of energy (Bassett et al. 2017). The energy storage system was tested in open waters to compare and validate the power level and the float speed
results(Bassett et al. 2017). It was mention that, losses in both the efficiency and power was a result of drag (Bassett et al. 2017).
4. Genetic algorithms, Modelling, simulation and optimal sizing a storage system integrated to a renewable energy generation system i.e. wind turbine or an off-shore wind turbine.
The literature paper by (Campana et al. 2017), articulates an open source code, which can be used to model and optimize clean energy technologies. The open source code is written in Matlab and uses genetic algorithm (GA) for optimization, in order to find the optimal solution based on the power sources, renewable power systems, backup sources, life cycle cost etc (Campana et al. 2017). According to (Campana et al. 2017), the model mainly covers area such as renewable energies, conversion of clean energy technologies, intelligent use of energy, mitigation technologies, sustainability and energy storage. The open source code could be modified in Matlab by the user.
A molecular simulation model of a PV battery system was developed by (Magnor and Sauer 2016), where genetic algorithm was used to calculate the optimal size of the system
depending on various boundary conditions and economic parameters, was articulated in their paper. According to (Magnor and Sauer 2016), the tool is preferred for the analysis of general correlations of battery PV system, instead of optimizing the non-integrated systems. (Alanazi and Khodaei 2017) carried out a study based around the reduction of curtailment of wind generation I.e. the drop in the generation of wind from the actual wind production, which involved the development and proposal of a battery energy storage model. Based on transmission network congestion, the developed storage model provided necessary data on the curtailment of wind generation along with providing an optimal battery energy storage system size (Alanazi and Khodaei 2017). The curtailment of the overall wind generation usually ranged from 1% to 4% and varied from some markets to other (Alanazi and Khodaei 2017). The paper by (Alanazi and Khodaei 2017) proposes a model for battery energy storage system in order to reduce the wind plants from generation curtailment, by consuming or storing energy during surplus electricity production and low demand. The exact opposite is done when there is lack of power generation and high demand. The model tries to minimize the cost of the battery storage system and the operating cost, by incorporating the annualized cost method (Alanazi and Khodaei 2017). The storage model was put to use by experimenting on the standard IEEE 118 bus test system for three cases, and this was done in order to compare the results and to know the usefulness of the model that was developed (Alanazi and Khodaei 2017). Results for the 1st case prompted that, almost 10% of the overall wind
generation was lost due to wind curtailment, and the results from case 2 showed that, implementing an optimal size battery storage system reduces the curtailment of wind to 99% and the planning cost by 3.7% (Alanazi and Khodaei 2017).
(Segurado et al. 2015) mentions that the islands electricity production is mainly based on wind power and fossil fuels, but the wind energy due to its intermittency wasn’t fully utilised, despite the abundant wind resources available. A study carried out by (Segurado et al. 2015) was based on the analysis of integration of water supply and energy in an island called S. Vincente in Cape Verde. The study emphasised on updating the H2RES model with the latest data pertaining to water consumption and energy, with the main objective of seeking a solution to minimise the annual water and energy costs, while maintaining the high wind penetration (Segurado et al. 2015). A H2RES model is a tool developed by analysing hourly data of hydrogen, water, electricity demands along with storage and energy resources, to carry out simulations, to enable the integration of hydrogen and other renewable energy sources to the energy systems of isolated locations including islands(Segurado et al. 2011) (Segurado et al. 2015). The results from (Segurado et al. 2015) stated that, it would be possible to achieve 36% of the production of electricity from renewable sources, with the desalination capacity plant and wind power currently installed, along with the addition of pumped hydro storage. This resulted in a 7% decrease in the cost that was forecasted for that particular year (Segurado et al. 2015). The results further hinted that, if the consideration to install more number of wind power and the capacity of desalination plants, then the
production of electricity from renewable sources could reach 72% i.e. pumped hydro at 21% plus wind power at 51%, along with an overall predicted cost reduction by almost 19% (Segurado et al. 2015). It is noted that the increase in size of the pumped hydro storage could add to the annual costs. Hence the strategy was to immediately allow the pumped water in the upper reservoir to flow back to the lower reservoir, thus keeping the size and the cost of the pumped hydro storage as low as can be (Segurado et al. 2015).
The paper (Bassett et al. 2017) focuses on integrating the buoyancy energy storage concept to a utility scale wind turbine, where a case study was made on the Canada based Ontario energy market. For the simulations, the size of the buoyancy energy system was considered for 1 MWh of electrical energy storage and wind generated power data from a 2.3 MW wind turbine was collected from the Ontario energy market in the year 2015.(Bassett et al. 2017). In the paper (Bassett et al. 2017), from previous data and a developed bi-diurnal program, the net revenue and the total revenue from the storage is calculated. The system is said to have an high efficiency theoretically i.e. 90%, although no experimental validation has been done (Bassett et al. 2017) (Bassett et al. 2016). Simulations revealed that the potential for revenue generation was $10337 per year, which is immensely low and hence the system is not yet viable financially if the revenue is generated only by the buying and selling of energy (Bassett et al. 2017). The energy storage system was tested in open waters to compare and validate the power level and the float speed results(Bassett et al. 2017). It was mention that, losses in both the efficiency and power was a result of drag (Bassett et al. 2017).
The paper (Liu et al. 2017) emphasises on the method used for the optimal sizing for hybrid power systems i.e. integration of battery storage to wind power and solar power, which is based on the trade-offs between the economic and technical factors (Liu et al. 2017). In order
to size the hybrid power system optimally, (Liu et al. 2017) used the fuzzy clustering algorithm which was further modified to extract necessary information from previous data, and markov model is used to calculate the load and the natural resources. A strategy based on power balance is used to guide the process of optimization with a genetic algorithm in order to achieve optimal configuration along with minimal cost (Liu et al. 2017).
The open source code covers the energy system areas such as clean energy conversion technologies, intelligent energy uses, sustainability, renewable energies, mitigation technology and energy storage (Campana et al. 2017). The paper (Campana et al. 2017) presents a code written in Matlab, which can be utilized or modified to simulate and optimize technologies which fall under the clean energy category. According to (Campana et al. 2017) the code was initially developed in order to optimize the renewable water pump system mainly used for irrigation purpose, and can perform design, simulation and optimization of on grid and off grid systems. The model developed by (Campana et al. 2017) utilized the generic algorithm for optimization, in order to find the best mix among storage systems, power sources and at the same time minimize life cycle cost. Two examples were considered in this paper and the results proved the importance of life cycle costs of an hybrid wind PV battery diesel system, hence proving the model can handle complex integrated energy systems (Campana et al. 2017).
(Segurado et al. 2016) proposes an optimization model to optimize the integrated renewable energy system i.e. pumped hydro storage and a desalination plant which is powered by wind power. The optimization is carried out for the island of S. Vicente, Cape Verde, where the integrate renewable energy systems are proposed (Segurado et al. 2016). For operational strategy and sizing of the integrated system that is proposed, Direct MultiSearch method is used (Segurado et al. 2016). The main aim of the paper was to cut down the overall annual production costs, reduce the curtailment of wind power and to maximise the involvement of renewable source in the power produced (Segurado et al. 2016). The results from the optimization model showed that, there was a 67% reduction in CO2 emissions, a 27% reduction in water and power production costs, while there was an increase in the penetration of renewable source power production by 84% (Segurado et al. 2016).
(Buhagiar 2017) in his paper proposes and models a novel hydro pneumatic energy storage device for offshore energy systems and in particular offshore wind turbines. The system is further simulated at different climate and weather conditions in order to observe the thermodynamics of the internal gas, which is influenced by the temperature of the external seawater (Buhagiar 2017). The results proved that 95% of the energy stored in such a system can be recovered and the electric round trip efficiency was similar to that of a near isothermal and adiabatic compression air energy storage (Buhagiar 2017).
The paper (Saadat et al. 2015) proposes and models an open accumulator compressed air energy storage systems. The accumulator was incorporated with a nonlinear controller, which operated on the energy based Lyapunov function, in order to manage the accumulator
pressure and to meet power demands (Saadat et al. 2015). Hence, the hydraulic unit tracks the power generated while the pneumatic unit maintains the liquid air pressure ratio (Saadat et al. 2015). In the system, the hydraulic components were sized for high power demand,
whereas the air compressor/expander unit were sized in order to achieve steady power (Saadat et al. 2015). Therefore, both features of the system could be utilized based on the power requirement.
5. Cost estimation
The study by (Aggidis et al. 2010) focuses on the estimation of mechanical and electronic equipment costs, and various types of turbine costs. (Aggidis et al. 2010) developed an empirical formula by statistically analysing the cost data procured from various turbine manufacturers, in order to have an estimation of the mechanical and electronic equipment and turbine costs, based on the site characteristics such as flow rate and head. The cost estimation results obtained by (Aggidis et al. 2010) where found to be realistic, compared to results based on other methodologies. (Aggidis et al. 2010) claims that the formula developed is only a first order estimation.
6. Methods to select a pareto optimal solution from the pareto front.
In an article published by (Wang and Rangaiah 2017), about 10 methods that could be used to select a pareto optimal solution from the pareto front were studied. The results proved that, out of the 10 best methods, grey relational analysis and simple additive weighting were the best methods that could be used to select a single pareto optimal solution from the pareto front (Wang and Rangaiah 2017). The grey relational method (GRA) is more attractive, as it does not rely on any input from the user, compared to all the other methods considered in the study (Wang and Rangaiah 2017).
4 CURRENT STUDY
A case study was carried out in order to check the feasibility of the renewable storage sphere integrated to a floating wind turbine at the Swedish side of the Baltic sea. The methods that were used for modeling the scenarios to carry out simulations and optimize the results are articulated in the steps below.
4.1 Storage unit deployment location
Theoretically, the region of deployment of the storage sphere is considered to be in the Baltic sea, preferable at a location where the sea bed is at its deepest. The deepest part of the Sea is preferred due to the increase in hydro pressure along with depth, which enhances the power production in the storage sphere (Slocum et al. 2013).
The Baltic Sea is a part of the Atlantic Ocean which is surrounded by countries such as Finland, Scandinavia, Poland, Germany, Latvia, Lithuania, Russia and Estonia. It is estimated that the Baltic Sea has a surface area of 349,644 km2 (Euroocean n.d.) and the
deepest part of the Baltic Sea is towards the Swedish side of the Sea, at an estimated depth of 459 meters.
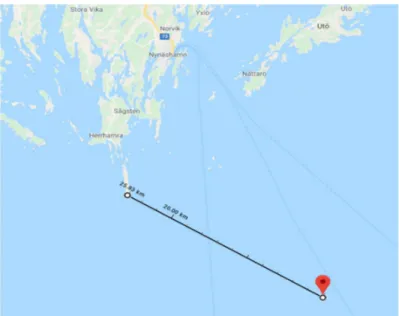
Figure 1 shows a location at approximately 58.62042954 latitude, 18.24277021 longitude, is estimated to be the deepest part of the Baltic Sea. The depth at the selected coordinates is calculated and validated by using Bathymetry testing tools such as NOAA (NOAA n.d.), Geoplaner (Geoplanner n.d.) and Google Maps (GOOGLE EARTH n.d.). Based on the depth calculated using bathymetric tools I.e. 435 meters, a depth of approximately 400 meters is considered for the calculations in the study.
Figure 2 : Distance from the offshore location to the shore (GOOGLE EARTH n.d.)
Figure 2 shows the distance from the deployment location to the nearest shore at Landsort, i.e. approximately 26 kilometers.
4.2 Wind data and floating wind turbine
For the study, 10 Vestas 3MW wind turbine, which has a hub height of 80 meters above sea level, were considered. It was assumed that the floating wind turbine farm could be deployed at the chosen location I.e. 58.62042954 latitude, 18.24277021 longitude, and could be moored to the storage spheres to reduce mooring costs. The wind data necessary for the calculations are obtained from Meteonom (Meteonorm n.d.), which is a global climate database and a weather forecasting tool.
The wind speed at the chosen coordinates are obtained for 1 year, at a height of 10 meters above sea level. The wind data obtained at 10 meters above sea level were used to calculate the wind speed at a height of 80 meters above sea level using the wind profile power law formula. A wind profile power law is used to estimate the wind speed horizontally at a height above ground level (Beychok 1994) (Touma 1977). The wind profile power formula is shown in Equation 1 Equation 1 𝑣 𝑢 = 𝑧 𝑧 α 𝑣 = 𝑢 ∗ 𝑧 𝑧 α
Where, 𝑣 is the wind speed in m/s at a required height z in meters i.e. 80 meters and ur being
Whereas, α is the exponent coefficient which is empirically derived and varies according to the stability of the atmosphere (Beychok 1994) (Touma 1977). For open waters an exponent of 0.11 is preferred.
To model the power output of the wind turbine calculated on an hourly basis, Equation 2 is used (Campana and Yang 2017) (Campana et al. 2017)
Equation 2 𝑃𝑜𝑤𝑒𝑟 = ⎩ ⎪ ⎨ ⎪ ⎧10 (𝑣 > 𝑣 & 𝑣 < 𝑣) 2𝜌 ∗ 𝐴 ∗ 𝐶 ∗ 𝑣 (𝑣 < 𝑣 < 𝑣 ) 𝑃𝑜𝑤𝑒𝑟 (𝑣 < 𝑣 < 𝑣 ) 0 (𝑣 > 𝑣 𝑣 < 𝑣)
Where, the density of air is 1.225 kg/m3, 𝑃𝑜𝑤𝑒𝑟 is the power produced by the
wind turbine at rated speed in Watts, for each 3MW wind turbine i.e. 3071519.96
Watts, 𝑣 , 𝑣 and 𝑣 are the cut in, cut out and the rated speed characteristics of the wind power curve in m/s, A is the area of the rotor in m2, 𝑣 is the available wind speed in m/s and
Cp is the coefficient of power.
The necessary values such as the rotor diameter, hub height etc. were rendered from the turbine manufacturers guide. The hourly power output of the wind turbine I.e.
𝑃𝑜𝑤𝑒𝑟 , based on the wind speed were obtained from the wind turbine
manufacturers guide. Based on these values a graph is plotted to obtain the wind power curve as shown in Figure 3
Figure 3: Wind power curve
A polynomial equation was obtained from the wind power curve, which was used to calculate the power output within the wind cut in and cut off range.
y = 0.0865383540x6- 3.9859448390x5+ 72.0349905168x4- 654.5476659442x3 + 3,199.8681411969x2- 7,878.5400681930x + 7,614.2227237820 y = 3075 0 500 1000 1500 2000 2500 3000 3500 0 5 10 15 20 25 30 W in d po w er , W at ts Wind speed, m/s
4.3 Battery/Storage sphere
The dimensions, components and cost of the storage sphere was taken from (Hahn et al. 2017). The total cost of the storage sphere including all its components are shown in Table 1.
Table 1 : Initial capital cost for spheres
Spheres (Includes cost of all the
components) ICC, Million Euro 1 15.14 5 38.27 20 126.83 40 265.60 80 506.69 120 774.69
The radius of the storage sphere was 14.3 meters. The volume of the sphere was calculated using Equation 3
Equation 3
𝑉 =4
3∗ 𝜋 ∗ 𝑟
Where, 𝑉 is the volume of the sphere in m3 and r is the radius in meters.
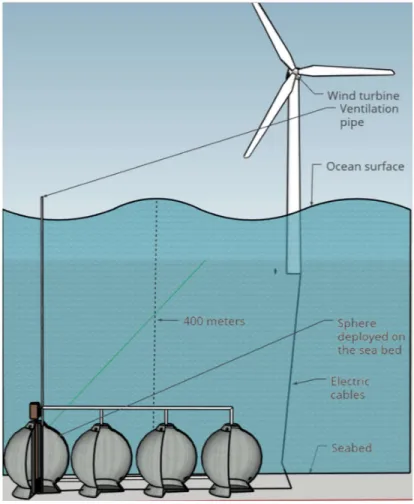
The major components of the storage sphere developed by (Hahn et al. 2017) is a pump/turbine, a hollow cylindrical column and a generator/motor. In order to keep the power generation constant, a vent line is connected to the storage sphere, which stretches all the way to the top of the sea surface, to maintain atmospheric pressure in the sphere.
Although the storage system could work under vacuum(Slocum et al. 2013). It is assumed that a ball valve is present inside the sphere to prevent water entering the ventilation pipe, once the sphere is full. A rough sketch of the storage sphere with a vent line is shown in Figure 4. The electric equipment is assumed to be mounted at the top of the sphere enclosed in a water tight box, to enable easy access during maintenance.
Figure 4 : Storage sphere and its components
The capacity of the storage sphere at a various depths can be calculated using the Equation 4 (Slocum et al. 2013)
Equation 4
𝐶 =𝜌 ∗ ƞ ∗ 𝑔 ∗ 𝐻 ∗ 𝑉 3.69 ∗ 10
Where, 𝐶 is the charge capacity in MWh, ƞ is the turbine efficiency, g is the gravitational force m/s, H is the head in meters, 𝜌 is the density of salt water in 1025 kg/m3 and 𝑉 in m3.
With a motive to theoretically reduce the Initial capital cost and Life cycle cost, an
arrangement concept was proposed. Electrical equipment including turbine/pumps in every sphere would increase the grid connection cost depending on the number of spheres. Therefore, rather than all the spheres, 1 sphere (parent sphere) would have the electrical equipment and components which can produce the maximum power output depending on the electric load requirement. Hence, the turbine/pump costs were scaled up twice the power capacity and cost mention in (Hahn et al. 2017). The other sphere would be connected to the main sphere via piping to increasing the battery capacity. The remaining sphere would have a
ventilation pipe connected to the main sphere. A rough sketch of the arrangement concept is shown in Figure 5
The storage sphere was assumed to be deployed at a depth of 400 meters, and the electrical equipment in the sphere could be connected to the floating wind turbine via cables, to reduce the mooring cost. Although, mooring cost or storm survivability measures of the wind turbines moored to the spheres are not taken into consideration in this study.
Figure 5 : Storage sphere arrangement concept
The battery or storage spheres were modelled in way that every sphere would have a minimum water level that had to me maintained i.e. 5% of the battery capacity, in order prevent dry running of the pump in the main storage sphere and to show that the water would remain in the sphere if the water level dips below the inter connection piping between the storage spheres.
According to (Hahn et al. 2017) the cost of the concrete sphere, pump/turbine, screening system, grid connection and planning approval decreased with the increased in the number of spheres. To calculate the new cost of spheres based on the new arrangement concept, the costs of the spheres obtained initially from (Hahn et al. 2017) were all modified, where some of the costs such as grid connection costs were eliminated. The costs for turbine/pump were scaled up twice, because thecosts obtained from (Hahn et al. 2017) had a pump/turbine power output of 5MW. This is because the maximum power output of the pump/turbine is set
at 15MW. Based on the new storage sphere cost results, a graph was plotted in excel and a polynomial equation was obtained. This resulting polynomial equation which was used in the mathematical model to calculate the ICC of the optimal number of spheres in Matlab.
4.4 Grid
The electric grid is simulated as a power rendering and backup power system for the grid connected hybrid system (Campana et al. 2017). The electricity that is exchanged with the grid is subjected to retail electricity prices when rendered from the grid (Campana et al. 2017). Similarly, the electricity exchanged is subjected to incentives when electricity is injected to the grid (Campana et al. 2017).
4.5 Operational Strategy
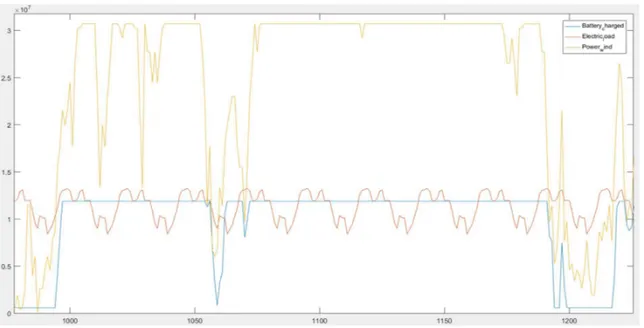
When the wind turbine generates power, which surpasses the electric load requirement. This excess power is called a surplus. This surplus power is utilized to charging the storage sphere or discharging the water from the storage sphere. Similarly, when the wind turbine does not produce sufficient power to meet the electric load requirement, the difference in power between the electric load and the wind power is then generated by the turbine in the storage sphere. During hours of low wind condition, when the turbine cannot produce enough power to match the electric load requirement, the storage sphere can continue to generate sufficient power to the grid, depending upon the battery capacity and the number of spheres, until the spheres are completely discharged or filled with water.
For charging the battery Equation 5 was used,
Equation 5
𝐵 (𝑡) = 𝐵 (𝑡 − 1) + [𝑃𝑜𝑤𝑒𝑟 (𝑡) − 𝐸 (𝑡)] ∗ ƞ For discharging the battery Equation 6 was used,
Equation 6
𝐵 (𝑡) = 𝐵 (𝑡 − 1) −[−𝑃𝑜𝑤𝑒𝑟 (𝑡) + 𝐸 (𝑡)] ƞ
Where, ƞ is the pump efficiency, ƞ is the turbine efficiency, t is the time step from which the parameter is calculated, 𝐵 and 𝐵 is the charging and discharging of the battery/sphere Wh, 𝐸 is the consumption of energy or the electric load in Wh and ƞ , ƞ is the efficiency of the pump and turbine.
When the storage spheres are completely charged, and the wind turbine still produces surplus electricity, and this surplus electricity is wasted or curtailed. To calculate the wind power that would be subjected to curtailment in Wh/year, Equation 7 was used
Equation 7
𝑊𝑖𝑛𝑑 𝑝𝑜𝑤𝑒𝑟 (𝑡) = (𝑃𝑜𝑤𝑒𝑟 (𝑡) − 𝐸 (𝑡)) − (𝐶 − 𝐵 (𝑡)) Where, 𝑃𝑜𝑤𝑒𝑟 (𝑡) and 𝐸 (𝑡) are the power generated by the wind turbien and the required electric load at time t. Similarly, 𝐵 (𝑡) is the charge in the battery at time t and 𝐶 is the maximum storage capacity of the sphere.
4.6 Simulation
The simulations were carried out in MATLAB using an open source platform called OptiCE, built for the optimization and simulation of energy storage and clean energy technologies (Campana et al. 2017), which was modified according to the study requirement. Using the formulas mentioned above, simulations were carried out for various scenarios.
According to (Slocum et al. 2013), various offshore platforms built from reinforced concrete in the North Sea have lasted way over 40 years. Hence, a life span of 50 years was considered in the simulations. It is assumed that the renewable storage sphere is exempted from
taxation. A fixed interest rate of 5% is assumed for the entire project lifetime. Similarly, the electricity cost per Wh is taken from (Pool n.d.). An increment of 5% is considered for the electricity cost every year for the whole project lifetime. Self-discharge from the storage sphere is assumed to be nil or negligible.
4.6.1 Scenario 1
The battery capacity and the components in the storage sphere mentioned above, remain the same for all the scenarios. The pump/turbine with a pumping efficiency of 89% during pumping mode and turbine efficiency of 82% during turbine mode was considered. Scenario 1 was simulated for load profile 1.
4.6.2 Scenario 2
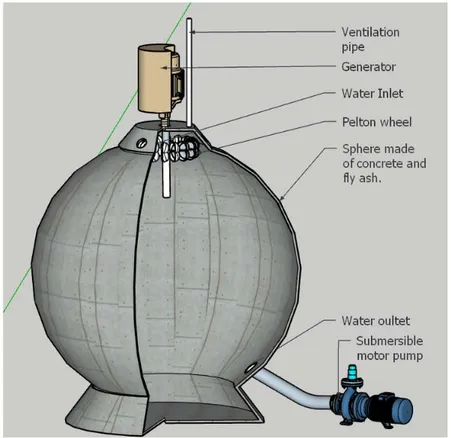
The load profile 1, sphere dimensions and sphere capacity remain the same as in scenario 1. But, instead of a cylindrical column and a pump/turbine, a Pelton wheel with an efficiency of 93% was considered. To pump the water out of the sphere, a multi stage submersible pump with an efficiency of 90% was considered. The cost of the Pelton wheel was assumed to be equal to the pump/turbine as in scenario 1. Whereas, the cost of the multi stage submersible pump which has a power capacity of 15MW was assumed to be 5 Million Euro. The cost was taken from (Almasi n.d.) and scaled up to meet the required power capacity. The cost of the submersible pump was added to the Initial investment cost. The pump is assumed to be placed on the seabed and connected to the storage sphere through a pipe. A rough sketch of storage sphere with all the components in scenario 2 are shown in Figure 6. Here, the simulations were carried out for a depth of 371.4 meters, as the Pelton turbine sits at the top of the sphere, compared to other scenarios where the turbine/pump was at the bottom. For
scenario 2, it is assumed that the sphere is equipped with a nozzle, spear and an actuator. The cost of the actuator was not considered.
Figure 6 : Storage sphere with Pelton wheel and a multi stage submersible pump
4.6.3 Scenario 3
In scenario 3 for a turbine/pump, pump efficiency of 82% during pump mode and turbine efficiency of 89% during turbine mode is considered. The efficiencies in scenario 3 are exactly the opposite to the efficiencies in scenario 1.
4.6.4 Sensitivity analysis of scenario 3 for different load profiles
Based on the simulations for all the scenarios at different depths for load profile 1, the best scenario or the scenario which produces the lowest Payback period and the highest Profits were chosen to be simulated again for different load profiles. Hence, scenario 3 was
simulated for load profile 2 and profile 3, where load profile 2 had an average electric load in Wh/year slightly greater than the average electric load Wh/year, of load profile 1. Similarly, load profile 3 had an average electric load Wh/year, lower than the average load Wh/year of load profile 1.