Master
's thesis • 30 credits
Environmental Economics and Management - Master's Programme
Degree project/SLU, Department of Economics, 1227 • ISSN 1401-4084 Uppsala, Sweden 2019
Pricing the Sun
-
a hedonic approach on the influence of
photovoltaic systems
on house prices in
Sweden
Pricing the sun
- a hedonic approach on the influence of
photovoltaic systems on house prices in Sweden
Axel Bolin
Supervisor: Ruben Hoffman, Swedish University of Agricultural Sciences,
Department of Economics Assistant supervisor: Tom Douglas, Vattenfall
Examiner: Jens Rommel, Swedish University of Agricultural Sciences,
Department of Economics Credits: Level: Course title: Course code: Programme/Education: 30 credits A2E
Mastert thesis in Economics EX0905
Environmental Economics and Management - Master's programme 120,0 hp
Course coordinating department:Department of Economics
Place of publication: Year of publication: Name of Series: Part number: ISSN: Online publication: Key words: Uppsala 2019
Degree project/SLU, Department of Economics 1227
1401-4084
http://stud.epsilon.slu.se
iii
Abstract
There is a growing concern regarding climate change and its potential damage on both ecosystems and human welfare. An increased production of renewable energy would enable a more sustainable lifestyle. Households that install solar panels to produce electricity from solar radiation are subsidized by the Swedish government to increase the production of renewable energy. However, it is still a relatively costly investment and households may therefore be hesitant to invest in solar panels. Knowledge on the expected influence on house prices by solar panels would enable households to make better informed decisions on whether to invest in solar panels or not. To investigate this hedonic regression is conducted using panel data on house sales in Sweden from 2012 to the end of 2018. The results strongly suggest that solar panels increase house prices, which makes it reasonable for households to expect an increased house price from the investment.
iv
Sammanfattning
Det råder en växande oro kring klamförändringar och dess framtida inverkan på ekosystem och människors leverne. En ökad produktion av förnybar energi skulle möjliggöra samhällen att vara mer hållbara. Hushåll som installerar solceller som producerar elektricitet från solstrålning subventioneras av den svenska staten för att utöka produktionen av förnybar energi. Trots detta så är solceller en relativt kostsam investering och därför kan hushåll vara tveksamma till att investera i dem. Kunskap om hur solceller påverkar huspriser skulle möjliggöra hushåll att fatta bättre underbyggda beslut om de ska köpa solceller eller inte. Därför undersöker den här studien hur huspriser påverkas av att ha solceller installerade. Detta görs genom hedonisk regressionsanalys med paneldata på husförsäljningar i Sverige mellan 2012 och 2018. Resultaten från denna studie pekar starkt på att solceller höjer huspriset, vilket talar för att det är rimligt för hushåll att förvänta sig att priset på deras hus kommer att gå upp om de installerar solceller.
v
Abbreviations
kWp – kilowatt-peak
Pvoltaic - Photovoltaic
vii
Table of contents
1 INTRODUCTION ... 1
1.1 Problem statement ... 2
1.2 Aim and delimitations ... 2
2 THEORETICAL PERSPECTIVE AND LITERATURE REVIEW ... 3
2.1 Literature review ... 3
2.2 Theoretical framework ... 5
2.2.1 Hedonic demand theory ... 5
2.2.2 Investment theory ... 7 3 DATA ... 9 Cost estimates ... 10 4 EMPIRICAL STRATEGY ... 11 4.1 Methodology ... 11 4.2 Descriptive statistics ... 12 4.3 Regressions results ... 13 4.4 Robustness checks ... 16
5 ANALYSIS AND DISCUSSION ... 18
6 CONCLUSIONS ... 20
REFERENCES ... 21
7 APPENDIX ... 23
7.1 Benefits of a Pvoltaic system ... 23
7.2 History of subsidies ... 23
7.3 Scatter plots on capacity of Pvoltaic systems (effect) and control variables ... 24
7.4 Scatter plots on house prices (soldPrice) with Pvoltaic systems installed and control variables ... 26
1
1 Introduction
There is a growing concern regarding climate change and its potential damage on both ecosystems and human welfare. International agreements such as the Kyoto protocol (UN, 1998), the Paris agreement (UN, 2018) and Agenda 2030 (UN, 2015) have been established to address this issue. These agreements states that the signatory countries bind themselves to cut future emissions of fossil fuels. These concerns as well as these agreements have led to increased interest for renewable energy sources such as biofuels, hydro, solar and wind power.
An expanding source of renewable energy is photovoltaics (This will henceforth be shortened to Pvoltaics or Pvoltaic) (Our world in data, 2019). A Pvoltaic system is a module that generates electricity from solar radiation (not to be confused with solar water heating systems). To incentivize households to invest in buildings with Pvoltaic systems (also called building applied Pvoltaic systems) some governments have implemented subsidies to cut the costs for installing the systems and hence make them more profitable.
There are many factors that would influence the decision to invest in Pvoltaic systems except for subsidies, such as the amount of electricity the system would produce, the price of electricity, willingness to establish a green profile in the community and reasonably whether the house price is being affected by the installation of the Pvoltaic system. See the Appendix for more information on the benefits of investing in a Pvoltaic system. If the house price would increase by having a building applied Pvoltaic system, households should be more prone to invest in Pvoltaic systems. This study investigates if building applied Pvoltaic systems increases the house prices in Sweden.
The impact of building applied Pvoltaic systems on house prices is a recent area of research, therefore, not many studies have investigated this. Most of the previous research that has been conducted investigated different parts of the United States and one sole study has been conducted in Perth, Australia. No previous study has investigated the impact on house prices of building applied Pvoltaic systems in Sweden or Europe.
Since there is a substantial gap in the literature this study is conducted to investigate this relationship in Sweden for three main reasons. The first is that renewable energy is demanded in Sweden and therefore it would be useful for policy makers to know how building applied Pvoltaic systems impacts households financially by its influence on the house price. The second reason is that privately owned Pvoltaic systems is a growing market in Sweden, which makes it relevant to households that have already invested in Pvoltaic systems and households that are considering investing in Pvoltaic systems. The third reason is that previous research has only investigated geographical areas that are better suited for Pvoltaic energy systems than Sweden due to higher amounts of solar radiation.
Additionally, a major question in empirical economics is how markets take information into account when prices are set. Therefore, how housing markets incorporate structural improvements such as Pvoltaic systems are of great concern in real-estate economics.
Three different methods have been implemented in the previous literature on the Pvoltaic impact on house prices. These are paired sales analysis, repeated sales analysis and hedonic regression. Paired sales analysis is a method that requires detailed information and knowledge in house valuation but not a large sample. Repeated sales analysis requires data on house sales
2
over time where the houses are sold repeatedly both with and without Pvoltaic systems and the estimated price increase is the difference between the sales. Hedonic regressions do not require data that spans over long periods of time, but instead requires large samples with suitable control variables. Even though these methods have their different strengths and weaknesses, when used in previous research they provide similar results. Based on this, the suitable method of choice depends on the expertise of the researcher as well as what data is available.
Since a paired sales analysis would require aid from professionals on valuation from all over Sweden to find houses that have been sold with Pvoltaic systems, this method is not a realistic option. However, Booli provides access to large amounts of micro data with control variables that covers house sales from 2012 to 2018. This time frame is too short for a repeated sales model, but it is suitable for a hedonic regression. The Swedish Energy Agency provides data on 8,668 installations of building applied Pvoltaic systems on privately owned houses that that are owned by households. Panel data with neighborhood fixed effects is used to estimate the impact of house prices by building applied Pvoltaic systems. This is a suitable method because the neighborhood fixed effects allow us to control for characteristics that are not available as control variables and the time fixed effects controls for macroeconomic differences over time.
Data on 51 484 single house sales is downloaded from Booli’s public API which cover all of Sweden except for Västerbotten and Norrbotten. This is merged with the installation data from the Swedish Energy Agency. 49 houses are found to have been sold with a building applied Pvoltaic system. These houses are regressed as a treatment group where the rest of the houses are used as a control group.
1.1 Problem statement
Households have the potential to increase the share of renewable energy production in Sweden by investing in Pvoltaic systems. As previously mentioned, the Swedish government subsidises these investments to cut the net costs for the households. The purpose of this policy is to increase the share of renewable energy that is being produced in Sweden. However, without knowledge on how the investment would impact the house price, households may hesitate to invest in building applied Pvoltaic systems. This study would provide households with information to make better informed decisions on whether to install Pvoltaic systems or not. Knowledge on this could also guide public decision makers to implement wiser policy to incentivize households to install Pvoltaic systems.
1.2 Aim and delimitations
The purpose of this study is to research the profitability of building applied Pvoltaic systems, specifically by the impact the investment would have on the house price. The research question is: “Does Pvoltaic systems increase house prices?”
The hypothesis of this study is that the influence on the house price from a Pvoltaic system should be in line with the net cost of installing a new system.
3
2 Theoretical perspective and literature review
2.1 Literature review
Not much research has been conducted on Pvoltaic system’s influence on house prices. Probably because building applied Pvoltaic systems is a relatively recent phenomenon. Some studies have been conducted in western countries that have warmer climates than Sweden such as the United States and Australia. These studies used hedonic regressions and other methods as well such as repeated sales models and paired sales analysis. Some of the studies investigated additional questions on e.g. solar water heaters impact house prices and whether people with a college degree pay more for a house with an installed Pvoltaic system.
Dastrup et al. (2012) used a repeated sales model in addition to a hedonic regression where panel data was used on houses that were sold between 1997 and 2010 in San Diego. They used a neighborhood fixed effect to control for socio-economic factors and yearly time fixed effects to control for differences over time. As control variables for constructional house attributes, they used a binary variable on whether the house had a swimming pool or not, area of the house, number of bathrooms, number of bedrooms, year of construction and which year the house had undergone a major renovation. In addition to these control variables, they also used number of public default notices that were associated with the property and an indicator variable on whether the house had a good view as controls. Lastly, the variable for the Pvoltaic system was a dummy on whether the house had a Pvoltaic system installed when the house was sold. They had data on 364,992 house sales and 329 of these houses had Pvoltaic systems installed. The results of the hedonic regression suggest that the house price is expected to increase 3.6% if the house has a Pvoltaic system installed. The repeated sales model provided similar results. The authors conclude that the house price in San Diego seems to increase by $20,000 based on the average house price at this time, which was $550,000. This should at least cover the costs of installing the system according to the authors.
Dastrup et al. (2012) also investigated whether house buyers that could be considered as environmentalists values the Pvoltaic systems more than other house buyers. They did this by regressing the share of Toyota Prius cars that had been registered in the neighborhood as well as the share of trucks that had been registered. The idea was that neighborhoods with a larger share of Prius owners should be considered as more environmentalist than the neighborhoods with a large share of trucks. From this they obtained statistically significant results that a large share of Prius cars increased the house prices with Pvoltaic systems installed, and the reverse as well, that a large share of trucks decreased the value of the systems. They also investigated if people with a college degree valued a building applied Pvoltaic system more than people with less education by regressing the share of college graduates in the neighborhood. The results were statistically significant and suggested that people with a college degree were willing to pay more for houses with Pvoltaic systems installed.
Qiu et al (2017) conducted a study on the house price impact by building applied Pvoltaic systems in the city of Phoenix, Arizona where the data on house sales was gathered from a randomly selected day in February 2014. The control variables where largely the same as the ones used by Dastrup et al (2012), such as number of bedrooms, number of bathrooms, area of the house, plot area, whether the house had a pool, which year the house was built and whether there was a good view from the house. The variable on Pvoltaic system was implemented as a
4
binary variable which means that the capacity of the system is not considered in the regression result. The results of the hedonic model suggested that house prices increased by $45,000 by having a Pvoltaic system installed and the authors states that it would cost $23,000 to install a regular system in Arizona in 2013. Based on this, it seems as if house prices increase substantially from having a Pvoltaic system installed in relation to the net costs of installing the system. They did not find house prices to increase from having solar water heating systems installed, which indicate that all house improvements are not necessarily reflected in the house price.
Unlike Dastrup et al. (2012), Qiu et al (2017) did not use a control variable on major renovations. If households that install building applied Pvoltaic systems make additional house renovations such as renovating the roof, this may cause a bias on the impact of Pvoltaic systems on house prices. Qiu et al (2017) did not use a neighborhood fixed effect, which would cause their study to not control for socioeconomic or environmental differences between the control group and the treatment group.
Ben Hoen has together with other researchers conducted multiple studies in the United States where hedonic regressions were used as well as a paired sales analysis (see Hoen et al 2011, Hoen et al 2013, Hoen et al 2015 and Hoen et al 2016). Unlike the previously presented studies, Hoen is emphasizing the importance of estimating the impact on house price per kilowatt-peak (kWp) of the system. In other words, how the house price is influenced by the Pvoltaic system’s capacity to produce electricity. This separates the smaller, cheaper systems from the bigger, more costlier ones and therefore provides more accurate results. Hoen uses similar control variables as Dastrup et al. (2012) and Qiu et al (2017). However, the most extensive study used only living area, plot area, number of rooms and construction year as control variables. The econometric model is basically the same as Dastrup et al. (2012) where panel data is used to control for homogeneity in the neighborhoods and yearly time fixed effects to control for differences that occur over time. The results of his studies suggest that house prices are being increased by 2.5% per kWp which would be in line with the net installation costs. The paired sales provided similar results as the previous hedonic regressions, which led Hoen to conclude that the research method should depend on what data material is available as well as the skillset of the researcher.
The only study that was not conducted in the United States was done in Perth, Australia by Ma et al (2015). Their study is similar to Dastrup et al. (2012) with respect to the econometric model as well as control variables, even though they are using spatial methods to control for neighborhood factors. The most substantial difference between these studies, is that they do not control for major renovations or quality of the house, which may be correlated with having a Pvoltaic system installed. The results suggest that house prices increase between 2.3% and 3.2% which corresponds to a monetary value of $16,000 to $22,000 which is more than the net installation costs in Australia at the time of the study.
Based on these studies it seems as if Pvoltaic systems increases house prices. However, it should be considered that publication bias may cause a misleading impression on previous research if only the studies with statistically significant results got published.
Researchers that conduct hedonic regressions vary in their use of control variables, this is probably because access to data differs between different regions. By going through articles presented in a literature review on hedonic regressions by Chau & Chin (2003) the following pattern on control variables is displayed. The most common variables for home and sight factors
5 are living area, plot area and the year of construction. Some control variables that are used more rarely would be swimming pool, number of bathrooms, number of bedrooms, garage and a quality variable of the house such as a need for renovation or whether a renovation has recently been done. Some researchers use panel data fixed effects to control for both environmental and socio-economic factors. Those who do not use panel data usually use variables on demography such as percentage of Catholics, blacks, college graduate’s unemployment and average income etc. Some studies implement spatial regressions as well with variables such as, distance to city center, distance to water and other amenities or inconveniences.
The control variables that are used in this study are living area, plot area, number of rooms and construction year. To control for neighborhood and environmental characteristics a neighborhood fixed effect is implemented. These controls could be considered as the minimum requirements for conducting a hedonic regression. A major problem is that there is no control variable for quality of the house. As a proxy for this, listing price is compared to the sold price. If the sold price differs a lot from the list price, it can be assumed that the house is highly demanded and therefore better quality. This is far from perfect since real estate agents might use low listing prices to draw attention to the object.
2.2 Theoretical framework
2.2.1 Hedonic demand theory
Hedonic demand theory or hedonic regression is a conventional theory that is applied to estimate the value of different attributes of products. The theory of hedonic attributes was established by Rosén (1974). Hedonic demand theory is commonly used in real estate economics as well as in consumer price index estimates where the theory is applied to control for improvements of a product over time into the index.
According to Boyle & Kiel (2001), when conducting a hedonic regression, it is assumed that the market price of the product reflects embodied characteristics valued by a range of implicit prices (also called shadow prices), where the implicit prices makes up the coefficients in the regression. Hedonic regressions are frequently used on the housing market to estimate the external costs related to environmental attributes such as living close to a nuclear power plant or the impact of air and noise pollution. The theory implies that house buyers are willing to pay less for a house in a polluted area ceteris paribus, and the difference in price make up the external cost by the pollution. Hedonic regressions are also used to measure the market price for positive externalities such as distance to recreational sites, the value having a good view such as a lake or a mountain and communications such as living close to a metro station. In the case of real estate economics, hedonic regression is suitable to use in real estate economics because the housing market consists, to the most extent, of heterogeneous products. It is assumed that the house can be decomposed into characteristics such as number of rooms, size of plot, distance to city center etc. Each attribute accounted for in the model reflects the shadow price of that specific attribute. Another assumption that is made when applying hedonic demand theory in real estate economics it that properties with better qualities demand higher prices compared to properties with lower quality.
A typical example of a hedonic regression is that you have two comparable houses that varies in price only because of different environmental conditions. The specific difference of that condition, ceteris paribus, would be the shadow price of that attribute. For example, if a nearby
6
industry would cause one ppm more of sulfur dioxide pollution, near one of the houses, the price difference of the two houses would be the external cost of one ppm sulfur dioxide. An example of an amenity could be a metro station that provides nearby communications for the house owner. The price difference in this case makes up the external value of having a metro station nearby.
A hedonic composition on the house market would be made from structural characteristics
S = (s1,s2,s3... sn) where s is a structural component, locality/neighborhood characteristics N = (n1,n2,n3...nn) where n is a locality/neighborhood characteristic and environmental
characteristics E = (e1,e2,e3...en) where e is an environmental characteristic. Structural characteristics would be living area, number of bathrooms, plot area, type of flooring etc. Neighborhood/locality would be the distance to city center, quality of roads, socio economic composition of the neighborhood such as percentage of different religious belonging such as Catholics, average income and unemployment rates. Environmental attributes would be air quality, noise pollution, distance to water and mountain view. The composite function of the house price is P = (S,E,N), where P is house price, S is structural controls, E is environmental controls and N is controls for the neighborhood attributes. A function that involves Pvoltaic systems would be P = (Pvoltaic,S,E,N), where the Pvoltaic system variable could be in the form of a dummy or a continuous capacity variable in terms of kWp
To implement hedonic demand theory on the housing market has several advantages as well as disadvantages. The first advantage of implementing such a model is versatility. This is because the theory takes probable interactions into consideration between i.e. environmental quality and socio economics status. The second advantage is that implementation of the theory provides valuation of attributes that is based on people’s actual valuation. The third is that real estate market is relatively efficient at accounting for information Chau & Chin (2003). The last advantage is that data property sales might be relatively available compared to other useful data sources.
However, the disadvantages of implementing a hedonic regression are also numerous. One is that large amounts of data needs to be collected and processed. The second is that everyone is assumed to have prior knowledge of the potential negative and positive attributes that is associated with purchasing the house, such as the damaging effect of particles in the air that would occur near a specific industrial site or a highway. This assumption is widely regarded as unrealistic. The third is that the availability of data affects the amount of time and expense that will be undertaken to carry out an application of the model. The fourth is that markets are more limited in practice than what would be assumed in the theory. For example, if a family wants to live in a big house with a big garden in the inner city and are willing to pay a lot of money for it, but houses are generally smaller and have smaller gardens in the inner cities, which means that there is no supply of big houses with big gardens. This may provide inaccurate results for the family preferences. The fifth is that the theory assumes that only attributes matter, but policies such as taxes and interest rate may impact demand for certain attributes. The sixth disadvantage is that correlations of control variables such as neighborhoods with little pollution are correlated with big houses, which can cause multicollinearity in the model. Lastly, it is assumed that markets will instantly account for changes in market price, however, in reality there is a lag in price changes.
7
2.2.2 Investment theory
The hypothesis of this study relies on basic financial theory as it is presented by Brealy et al (2011) which suggest that house owners would install Pvoltaic systems on their houses for several reasons. One is that the investment would increase net income over time. By installing a Pvoltaic system the household is not only a consumer of electricity, it becomes a producer and can sell electricity to the power grid. This means that the Pvoltaic system has the potential to not only be a cost reducing investment, it could also generate income for the household, depending on the amount of electricity the household produces respectively consumes.
Another reason to invest in a Pvoltaic system is that the risk preferences of the household make Pvoltaic systems a suitable investment compared to other opportunities. If the household would have 100,000 SEK that it wanted to invest it would have multiple options such as bonds, stocks or in this case, house improvements such as a Pvoltaic system. To put this in perspective, if a household is pessimistic about the stock market and bond issuers ability to pay back, a Pvoltaic system may be a reasonable option for the household. This is because it generates a monetary value by producing electricity, and potentially increase the house price. Which investment that would be most suiting for the household depends on the risk preferences as well as the household’s expectations on the future economy.
If a household would consider investing in a Pvoltaic system, it would be informed on the amount of electricity the system would be expected to produce over its lifetime as well as the cost of installing the system. As time goes by, the expected future electricity production decreases and therefore the intrinsic value of the system would decrease as well. The house price should not increase more than the household’s investment cost, and as the system gets older, the impact on house price is decreasing. This is because house buyers are willing to pay less for an old system since an identical system that is new would have more benefits to it.
If technological advancements increase the productivity of Pvoltaic systems and lowers the costs of producing them, the market value of older systems should decrease more because house buyers can purchase a similar house and install the Pvoltaic system that is made of better technology to a lower price. Another factor that could impact the market value of an already installed Pvoltaic system is public policy.
When analyzing costs and expenses from a policy perspective, some fundamental terminology must be clear. Since building applied Pvoltaic systems are subsidized by the Swedish government, the total costs of purchasing and installing the system are not the expenses of the private household. The cost of the household is referred to as net cost and the difference between the total costs and the net costs is the subsidy that the government provides. Based on the previously presented framework, a Pvoltaic system that is installed onto a house should increase the house price in line with the net cost, if it would be sold. Therefore, if public policy would change, ceteris paribus, the market value of a house with a Pvoltaic system would change as well. If the subsidies where to be increased, the market value of already installed Pvoltaic systems would decrease from their initial level, simply because house buyers can install it themselves cheaper.
Since the levels of subsidies have decreased as share of total cost over time in Sweden, technology has improved, and total costs have decreased, Pvoltaic systems should have been costlier to get at the time they were installed than they would be worth when the house is sold.
8
According to this framework, the increased price from installing a Pvoltaic system should not be higher than the net costs unless subsidies are decreased. An aspect that is not covered in this framework is that installing Pvoltaic might be associated with costs in terms of time and effort. The household would have to do research on which system is most suitable as well as hiring workers to perform the installation. If this would be the case house buyers may be willing to pay extra for not putting in time and effort into purchasing a Pvoltaic system and have it installed, which would lead to price increases that are higher than the net costs of installation.
9
3 Data
The data that is used in this study is from Booli and the Swedish Energy Agency (Energimyndigheten). Booli is a company that provides sale ads on property objects such as villas, apartments and cottages where they specify the attributes of the objects that are for sale and have been sold. Graciously, Booli provides a public API from which requests can be made to obtain specific data if you have an API key. The data from Booli is suitable to use because they provide vast amounts of data for free.
The database contains both listings and sales of objects as well as attributes such as county, municipality, neighborhood, number of rooms, living area, plot area and construction year. These attributes are used as control variables in this study, which is in line with previous studies. However, most of the previous studies have additional control variables as well such as number of bathrooms and whether the house has a swimming pool. Unfortunately, the data is unbalanced, which means that all control variables are not available for all objects and therefore some objects are dropped in the regression.
Since Booli uses ads from several real-estate agents, the “neighborhood” variable is usually narrow but inconsistent. For example, the neighborhood Ultuna in Uppsala may be named as “Southern Ultuna”, “Northern Ultuna” or just “Ultuna”. These three denominations are considered as three different areas in the area fixed effect. This inconsistency is not ideal as a fixed effect, but the assumption on socio-economic homogeneity is still valid. Booli has got data from all of Sweden from 2012 so the sales that this study uses is between the start of 2012 to the last of December 2018. The two counties Västerbotten and Norrbotten have been excluded due to few installations of Pvoltaic systems, but the rest of Sweden is covered in the study. 51,484 house sales have been received from Boolis API, where only villas were requested because most Pvoltaic installations have been done on villas and it is time consuming to extract data on each housing category from all of Sweden. A script in Python was implemented to download the data and the response code was in Json format. An online converter was used to get an excel file from the Json format.
The data that was provided by the Swedish Energy Agency concerns the subsidies of Pvoltaic systems that the Swedish governments has provided to households and contains 8,668 installations along with several variables. Those are county, municipality, property ID, date when the installation began, when the installation was finished, the amount of funding from the government, the area of the Pvoltaic module, street address and postal address. However, many of the street addresses are either missing or are carelessly written because the Swedish Energy Agency relies on property ID rather than addresses. Since Booli does not provide a property ID variable the matching process is flawed. To address this problem, a few steps are taken. Property numbers are googled to find the addresses on the internet. The addresses are checked through to see if there are any obvious misspellings. Addresses that are made up of two words are checked on sites like hitta.se and Eniro to see if the words are in the right order. Lastly, addresses without a number are checked to see if there if that is correct. The number of matches by street address and municipality is 49 when all duplicates with respect to address and municipality are deleted so that every house only occurs once in the material. The houses that had been sold more than once with a Pvoltaic system installed had all got the installation before the sales. It should be noted that all houses with Pvoltaic systems may not be matched in this data material due to the flawed matching process, but this should not be a problem because the control group is very extensive. It should also be considered that the data from the Swedish Energy Agency does not cover the houses with Pvoltaic systems that was installed before 2009
10
or the houses that did not request any subsidy from the government. This should not be a not be an issue for two reasons. The first is that few Pvoltaic systems were installed at 2009 and the number of installations has increased since, which indicates that the number of installations before 2009 must have been very few, especially since there were no subsidies at the time. Another reason is that the people who invest in Pvoltaic systems are people with good incomes that are engaged in their communities. Since the total costs of installing Pvoltaic systems are substantial, it is reasonable that these people would be aware that the government would fund them for installing it and they would be incentivized to accept funding for it.
Cost estimates
The installations costs are estimated based on the different levels of subsidies over time and the amount of subsidy that is given to each installation. To estimate the total cost of a Pvoltaic installation the amount of funding from the government is divided by the level of subsidy at the time. To get the net cost, the total cost is subtracted by the amount of funding. For more information on the history of subsidies, see the Appendix.
For example, if the level of subsidy is 20% at the time of installation and the amount that the government funded the installation is 40,000, then, 40,000/0.2 would be the total installation cost which is 200,000 SEK, and 200,000-40,000 is the net installation cost which would be 160,000 SEK.
11
4 Empirical Strategy
4.1 Methodology
Panel analysis is used in econometrics and statistics where multi-dimensional data is used to control for fixed effects as well as time fixed effects using multiple time periods and objects such as firms, countries or households. The purpose of using panel data is that unobservable characteristics of an object is being controlled for as well as differences that occur over time. This is suitable to implement in the housing market because characteristics of the neighborhood can be controlled for as well as macroeconomic differences that occur over time.
A panel data model is stated as follows
𝑌𝑖𝑡 = 𝛽1𝑋𝑖𝑡+ 𝛼𝑖+ 𝜆𝑡+ 𝜀𝑖𝑡
Where Y is the dependent variable, i is the object, t is the period of time, 𝛽1 is the coefficient
for variable X, α is a constant for object i, λ is a constant for time period t and ε is the standard error Stock & Watson (2014). Clustered standard error is used to control for autocorrelation.
The specific core model of this study is stated as follows.
𝐻𝑜𝑢𝑠𝑒 𝑝𝑟𝑖𝑐𝑒𝑖𝑡 = 𝛽1𝑋𝑖𝑡 + 𝛽2𝑃𝑣𝑜𝑙𝑡𝑎𝑖𝑐𝑖𝑡+ 𝛼𝑖 + 𝜆𝑡+ 𝜀𝑖𝑡
Where House price is the price that the individual house is sold for, i is the neighborhood, the control variables are included as X which are living area, plot area, number of rooms and construction year. Pvoltaic is a variable on Pvoltaic system, it can be a dummy or a continuous variable on capacity in terms of kWp. Clustered standard errors is used for the error term ε. In line with previous studies, House price is regressed in both linear and log form, also called linear and log-linear models. The time fixed effects are defined as yearly time dummies to control for differences that occur over time.
To control for unobservable neighborhood- and environmental attributes, area fixed effects is defined as the neighborhood variable that Booli provides. As mentioned in the Data section above, these are made from the neighborhood that real-estate agents use in their ads, which means that the area fixed effect is narrow but inconsistent. A positive aspect of this is that the group definition is narrow where neighborhoods such as Ultuna, Flogsta or Gränby are grouped together rather than cities or municipalities. The lack of consistency of the group variable is probably compensated by the large sample of sales in the control group.
The area fixed effect does control for some of the non-observable homogeneity in the areas such as socioeconomic factors and pollution from industries and highways. However, some examples of locational and environmental factors that the fixed effect is not able to control for are view from the house and distance to city center, which have been concluded as important in previous research. (Chau & Chin, 2003).
There is no “quality” variable on how well maintained the house is in Booli’s data material. As a proxy for this, the difference between list price and the sold price is used as a control variable. The idea of this proxy is that houses with better quality will be in higher demand and therefore there should be a higher gap between the list price and the sold price. This variable has its limitations since real-estate agents may list low prices to draw attention to the object.
12
The age of the Pvoltaic installation at the time the house is sold is also controlled for, but it turns out that all the systems are between seven and eight years old. This makes it impossible to estimate the impact on house prices by the age of the system and to use it as a control variable.
Booli provides a variable on the distance between the house and water, but because many of these variables are null it is not possible to use “distance to water” as a control variable.
4.2 Descriptive statistics
To obtain the main results all sales with more than 20 kWp are dropped which are three houses. Other houses are dropped as well where the control variables do not make sense such as the number of rooms is 0. All houses where plot area is less than 30 square meters, living area is less than 20 square meters and the construction year is less than 1 are dropped.
Table 1.1 Descriptive statistics on houses with Pvoltaic systems
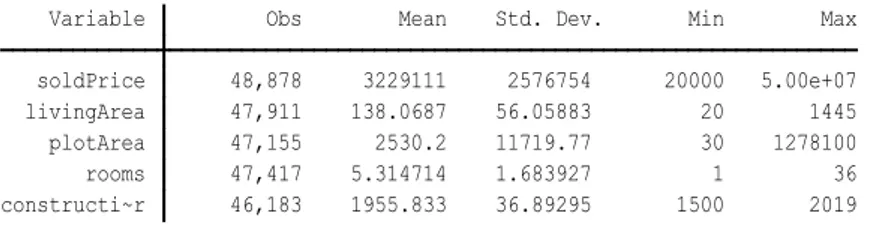
Table 1.2 Descriptive statistics on houses without Pvoltaic systems
Table 3.1 and 3.2 displays that the mean house price of houses with Pvoltaic systems is about 350 000 higher than houses without. The differences in living area and plot area also show that the Pvoltaic houses are in average slightly bigger than the other houses. The average plot area is slightly smaller among the houses with a Pvoltaic installation compared to the other houses. The Pvoltaic houses are also a little bit older in average. However, the houses without Pvoltaic installation have larger standard deviations for all variables except for the construction year. This suggests that the houses without Pvoltaic systems are more heterogenous in terms of size and plot area.
When the data is plotted as the kWp of the Pvoltaic system, there are no obvious trends that houses with more capacity on their Pvoltaic systems have more living area or more rooms than houses with less Pvoltaic capacity (See scatter plots in the appendix). There are neither any strong relationships between capacity of the Pvoltaic systems and plot area or the construction year of the house. In line with intuition, houses with a Pvoltaic system that have more living
constructi~r 42 1951.048 46.15613 1850 2013 rooms 44 5.659091 1.655761 3 10 plotArea 42 2253.048 2749.98 516 15433 livingArea 44 149.125 42.86554 68 257 soldPrice 45 3581556 1897764 750000 8000000 Variable Obs Mean Std. Dev. Min Max
constructi~r 46,183 1955.833 36.89295 1500 2019 rooms 47,417 5.314714 1.683927 1 36 plotArea 47,155 2530.2 11719.77 30 1278100 livingArea 47,911 138.0687 56.05883 20 1445 soldPrice 48,878 3229111 2576754 20000 5.00e+07 Variable Obs Mean Std. Dev. Min Max
13 area and more rooms also tend the house for a higher price as do newer houses. However, houses with more plot area do not have higher prices than houses with less plot area. This may be because rural houses might have more plot area and be cheaper than urban houses because land is less expensive in rural areas compared to urban areas.
4.3 Regressions results
Table 2 displays the results of hedonic regressions that are conducted by panel data.
Table 2: Hedonic regressions
(1) (2) (3) (4)
VARIABLES soldPrice soldPrice lnsoldprice lnsoldprice
solpanel 301,661.159** 0.140*** (146,886.205) (0.046) effect 43,212.313** 0.019** (20,097.607) (0.008) plotArea 5.919*** 5.918*** 0.000*** 0.000*** (1.160) (1.159) (0.000) (0.000) livingArea 11,940.901*** 11,941.702*** 0.003*** 0.003*** (583.613) (583.603) (0.000) (0.000) rooms 71,614.820*** 71,602.646*** 0.034*** 0.034*** (10,096.060) (10,096.243) (0.002) (0.002) constructionYear 3,140.578*** 3,140.195*** 0.002*** 0.002*** (308.784) (308.762) (0.000) (0.000) Year2012 -704,511.606** -702,271.231** -0.260** -0.259** (324,484.679) (322,837.709) (0.120) (0.119) Year2013 -593,982.889* -591,725.598* -0.228* -0.227* (321,787.176) (320,127.355) (0.121) (0.120) Year2014 -327,290.517 -325,007.308 -0.150 -0.149 (320,701.951) (319,021.284) (0.120) (0.120) Year2015 74,251.606 76,536.337 -0.033 -0.032 (320,441.796) (318,758.106) (0.120) (0.120) Year2016 391,841.857 394,117.781 0.043 0.044 (320,419.574) (318,736.241) (0.120) (0.120) Year2017 663,698.554** 666,102.777** 0.138 0.139 (321,088.908) (319,371.035) (0.120) (0.120) Year2018 567,252.670* 569,486.532* 0.130 0.132 (320,910.367) (319,231.738) (0.120) (0.120) Observations 44,053 44,053 44,053 44,053 Number of areanum 8,298 8,298 8,298 8,298 R2 0.327 0.327 0.336 0.336
Area and year fixed effects YES YES YES YES
Standard errors in parentheses *** p<0.01, ** p<0.05, * p<0.1
14
The first column provides result on a linear regression with a dummy for whether the house has a Pvoltaic system installed or not, as well as several control variables. The coefficient for
solpanel is 301,661 and it is statistically significant which means that having a Pvoltaic system
installed is expected to increase the price by 301,661 SEK.
The following column provides a linear model as well, but instead of a dummy for Pvoltaic system it provides a continuous variable named effect, which measures the expected price increase per kWp that the system can produce. The coefficient for effect in the second column is 43,212 and it is statistically significant, which means that the expected price increase is 43,212 SEK per increased capacity in kWp.
The third and fourth columns provides log-linear regressions with solpanel and effect as variables. The coefficient of solpanel is 0.14 with a statistical significance level of 1%, which means that expected price increase of having a Pvoltaic system installed is 14%. The coefficient of the effect variable is 0.019 with a statistical significance level of 5%, which means that the house price is expected to increase with 1.9% per kWp that the Pvoltaic system can produce.
In addition to this, all the coefficients on plot area, living area, rooms and construction year in Table 2 are statistically significant as well. The coefficients on living area and number of rooms suggest that bigger houses have a higher price than smaller houses. The coefficients on construction year suggest that newer houses have a higher price than older houses. However, the coefficient on plot area are all statistically significant, but they suggest that a relationship between plot area and house price is weak in the in the linear models and non-existing in the log-linear models.
Table 3 displays the same regressions as table 2 but with an additional control variable on the difference between the list price and the sold price which is named as pricediff in the table.
15 Table 3: Hedonic regressions with additional control variable
(1) (2) (3) (4)
VARIABLES soldPrice soldPrice lnsoldprice lnsoldprice
solpanel 282,913.839** 0.134*** (140,123.636) (0.042) effect 44,579.144** 0.020*** (18,437.778) (0.008) pricediff 0.682*** 0.682*** 0.000*** 0.000*** (0.083) (0.083) (0.000) (0.000) plotArea 5.702*** 5.701*** 0.000*** 0.000*** (1.098) (1.098) (0.000) (0.000) livingArea 12,094.879*** 12,095.674*** 0.003*** 0.003*** (592.491) (592.482) (0.000) (0.000) rooms 66,902.208*** 66,886.308*** 0.032*** 0.032*** (9,574.117) (9,574.127) (0.002) (0.002) constructionYear 3,525.246*** 3,524.939*** 0.002*** 0.002*** (311.854) (311.834) (0.000) (0.000) Year2012 -743,825.261** -741,951.675** -0.273** -0.272** (329,932.433) (328,448.079) (0.123) (0.123) Year2013 -676,253.276** -674,358.493** -0.254** -0.253** (327,208.190) (325,715.534) (0.124) (0.124) Year2014 -457,631.449 -455,738.535 -0.191 -0.190 (326,272.907) (324,760.626) (0.124) (0.123) Year2015 -149,760.940 -147,869.293 -0.103 -0.102 (326,412.236) (324,903.210) (0.124) (0.123) Year2016 145,720.857 147,607.012 -0.033 -0.032 (326,984.453) (325,477.980) (0.124) (0.123) Year2017 404,497.727 406,487.288 0.059 0.060 (327,175.010) (325,630.964) (0.124) (0.123) Year2018 429,221.318 431,065.492 0.088 0.089 (327,204.588) (325,697.815) (0.124) (0.123) Observations 43,777 43,777 43,777 43,777 Number of areanum 8,280 8,280 8,280 8,280
Area and year fixed effects YES YES YES YES
R2 0.368 0.368 0.376 0.376
Standard errors in parentheses *** p<0.01, ** p<0.05, * p<0.1
By adding the difference in list price and sale price as a control variable, the coefficients of
solpanel and effect are decreased in column 1, 2 and 3, but they are still statistically significant.
The effect coefficient in column 4 is slightly increased. Adding pricediff as a control variable influences the linear models to larger extent than the log-models
The coefficients on pricediff are positive in the linear models and 0 in the log-linear models. The linear models suggest that the houses where the sold price is higher than listing price have a higher price than houses where the listing price is the same as the sold price. The coefficients on plot area, living area, number of rooms are decreased by adding pricediff as a control variable while the coefficients on construction year are slightly increased. If pricediff would decrease
16
all other coefficents it would indicate that pricediff would control for some unobserved characteristics of the houses that separates the more expensive houses from the houses that are sold for a lower price. Since this is not the case, pricediff as a control variable may not be able to fulfill its purpose.
4.4 Robustness checks
Three outliers are dropped for the main results which are houses with Pvoltaic systems with a capacity to produce more than 20 kWp. As a robustness check, other houses are dropped as well to see how the results change. Pricedifference is not used as a control variable in the robustness checks because of its limitations as a control variable.
When all systems with capacity to produce more than 10 kWp, 7 houses are dropped which makes up around 14% of the houses with Pvoltaic systems installed. The level of statistical significance is the same but the Pvoltaic system’s impact on the house prices increases slightly for all the regressions. This is not in line with the hypothesis since the systems that are dropped are the systems with the most capacity, which should be costlier to install, ceteris paribus. However, this pattern continues as more observations are dropped. When all systems with the capacity to produce more than 5 kWp are dropped, half of the treatment group is still left. For the linear models, the statistical significance of solpanel is lost while it is decreased for effect a 10% level, but the coefficient is slightly increased. The coefficients of the Pvoltaic variables in the log-linear models are statistically significant on a 1% level and the coefficients are increased from the results of Table 2, where the effect coefficient is more than doubled. If all the systems with the capacity to produce 5 kWp or less are dropped, the statistical significance is decreased to a 10% or a 5% level and the coefficients are substantially decreased from the results of Table 2.
These robustness checks indicate that the systems with less capacity than 5 kWp are increasing the house prices more than the systems with a capacity to produce more than 5 kWp, which is not in line with the hypothesis given that systems with more capacity are also costlier. This relationship is displayed in graph 1 and graph 2. It is important to note that the regression results take neighborhood fixed effect into account while the scatter plots do not.
To get to the bottom of this relationship, outliers among house prices and control variables on Pvoltaic houses are removed to see if this relationship change. See the Appendix for scatter plots on control variables, house prices and capacity of the Pvoltaic systems. The following robustness checks are conducted on the houses with a Pvoltaic capacity to produce 5 kWp or less. The houses with more than 150 square meters of living area are removed. Houses with more than 6 rooms are removed. Houses that have been sold for more than 4 000 000 million SEK are removed. Additional adjustments are tested as well, but the impact of house prices from Pvoltaic systems with less capacity than 5 kWp still seems to be stronger than Pvoltaic systems with more capacity. Pvoltaic systems with a capacity to produce more than 8 kWp and the house is sold for less than 4 000 000 SEK are also dropped to see if systems with more capacity increases house prices more after these are removed. However, this is not the case. Overall, when these removals of outliers are conducted, some of the linear model’s loose significance while the log-linear models are robust. This indicate that the houses with a capacity to produce less than 5 kWp are driving the results in Table 2 and Table 3.
17 Graph 1.
The Y-axis displays the estimated net cost of installing Pvoltaic systems and “effect” is the capacity of the Pvoltaic system in kWp
Graph 2.
18
5 Analysis and discussion
The results in Table 2 and Table 3 and the robustness checks suggest that a Pvoltaic systems is expected to increase house prices. The results of the log-linear models may be more accurate since they are less sensitive to outliers, the linear models provide results of monetary impact on Pvoltaic systems. This is useful because a monetary value can be compared to the estimated average net costs. The results of the log-linear models are harder to put in relation to the net costs because the estimated percentual impact of a Pvoltaic system is derived from several areas in Sweden where house prices may differ a lot.
The robustness checks suggest that it is the Pvoltaic systems with lower capacity that are driving the results. This could be explained by several factors. The first is that markets may not take capacity of the systems into account, which could be supported by the fact that Dastrup et al. (2012) found that people who were environmentalists were willing to pay more for a house with a Pvoltaic system installed. This displays that house prices are influenced by non-economic factors since the economic benefits of a Pvoltaic system does not depend on the political sympathies of the household. The second explanation for this could be the inconsistencies of the neighborhood variable which would influence the fixed effects in these regressions. If some areas would be quite extensive, such as a “Uppsala” neighborhood, big houses in rural areas would be in the same neighborhood category as smaller houses that are closer to the city center. The bigger houses further away from the city center may install Pvoltaic systems with more capacity, but the house prices may be relatively low compared to houses that are closer to the city center. This would cause systems with more capacity to seem as if they do not influence house prices as much as systems with less capacity. A third factor is that there are different Pvoltaic systems where some systems are more efficient, better looking and more expensive than others. If houses that installs less capacity tend to install the costlier systems, this may be reflected in the house price where systems with less capacity would increase house prices more. A fourth reason is that there may be biases in the econometric model, this is thoroughly covered in a few sections below.
The average estimated net cost of installing a Pvoltaic system is 101,000 SEK in this study. The linear regressions suggest that house prices increase between 280,000 SEK and 300,000 SEK. All published articles find an increase of house prices by having Pvoltaic systems installed, as this study does as well. Qiu et al (2017) and Ma et al (2015) finds a price increase that is higher than the estimated net costs which is in line with the results of this study. Hoen et al (2015) found that the price increase is the same as the estimated net costs. These articles had a larger number of Pvoltaic houses and additional control variables, which would make their results more believable than the results this study.
Even though the results of this study indicate that house prices are being increased by having building applied Pvoltaic systems installed, some considerations must be done. The hypothesis of this thesis is that house prices increases in line with the net costs. It is not obvious that this would be the case since the regression results states that the increase is higher than the average estimated net costs of installation. The standard errors of these regressions are substantial however, which would suggest that the regression results should not be strictly interpreted as the price increase of Pvoltaic systems.
Another reason for why the hypothesis may still be valid is that there are no control variables on house renovations. If houses with Pvoltaic systems are systematically different from other houses in a way that is not controlled for in these regressions, a bias on the influence of Pvoltaic
19 systems on house prices would occur. Such differences may even be probable, e.g. house owners may make renovations that are associated with installing the system such as renovating the roof. There could also be other causes of biases such as houses with Pvoltaic systems have more bathrooms, newly renovated kitchens and so forth. Based on these problems, it would be naive to think that the impact of Pvoltaic systems on house prices would not be decreased if additional control variables were added in the regressions.
These problems raise a question on whether house prices are impacted by Pvoltaic systems at all. Even though this may be the case, the results of the capacity variable “effect” shows that Pvoltaic systems with more capacity increases house prices more than Pvoltaic with less capacity. This should eliminate some of the bias that would occur when comparing houses with Pvoltaic systems and houses without these systems, such as quality of kitchen or number of bathrooms. Therefore, the results indicate that house prices are being increased by Pvoltaic systems.
Another option is that the research hypothesis is not correct, instead, the house price increases even more than the net installations costs as Ma et al (2015) and Qiu et al (2017) found. If this would be the case, a potential reason for it may be that banks provide more credit to purchase houses with Pvoltaic systems installed. Since the house is usually used as a security for the loan, an installed Pvoltaic system may increase the valuation of the house and banks may therefore be willing to provide more credit for it. Another reason is that Pvoltaic systems cuts the monthly costs of living in a house. If banks recognize this, they may provide more credit to house buyers because the Pvoltaic system enables them to pay more in interest cost.
20
6 Conclusions
The research question of this study is “Does Pvoltaic systems increase house prices?” and the results of hedonic regressions using panel data suggest that house prices do increase by building applied Pvoltaic systems, and that systems with more capacity tend to increase house prices more as well.
The research hypothesis of this study is that the price should increase in line with the net installation costs as Hoen has found in several studies. However, the estimated price increase is higher than the average estimated net costs. This has been found in previous research conducted in the Arizona and Australia as well. Due to limitations of the data, this study is unable to prove beyond doubt that this would be the case in Sweden.
The purpose of this study is to research the profitability of building applied Pvoltaic systems, specifically by the impact the investments have on the house prices. Based on the results of this study, it would be reasonable for households to expect an increase of the house price if they would consider investing in a building applied Pvoltaic system. However, because of limitations of this study, it would be unadvisable to install a building applied Pvoltaic system with the sole purpose of increasing the house price before selling a house.
A finishing conclusion is that the few numbers of houses with Pvoltaic systems in the treatment group of this study exposes the fact that this is spear heading research on Pvoltaic systems and house prices in Sweden. Based on the data of installations over time, it is obvious that more houses will be sold with Pvoltaic installations in the coming years, which will provide better data for the future. Therefore, further research on this should be conducted and additional control variables should be added if possible.
21
References
Adomatis, S., Hoen B., 2016. An Analysis of Solar Home Paired Sales across Six States. The Appraisal Journal 84, 27-43
Boyle, M.A., Kiel, K.A., 2001. A Survey of House Price Hedonic Studies of the Impact of Environmental Externalities, Journal of Real Estate Literature 9 (2), 117-144
Brealey, R.A., Myers, S.C., 2011. Principles of Corporate Finance. Tenth edition. The McGraw Hill Series in Finance.
Chin, T. L., Chau, K.W., 2003. A critical review of literature on the hedonic price model, International Journal for Housing and Its Applications 27 (2), 145-165.
Dastrup, S.R., Zivin, J.G., Costa, D.L., Kahn, M.E., 2012. Understanding the Solar Home price premium: Electricity generation and “Green” social status. European Economic Review 56 (5), 961-973
Hoen, B., Wiser, R., Cappers, P., Thayer, M., 2011. An analysis of the effects of residential photovoltaic energy systems on home sales prices in California. Lawrence Berkeley National lab Report, LBNL-4476E (Available at https://emp.lbl.gov/sites/all/files/ lbnl-4476e.pdf).
Hoen, B., Cappers, P., Wiser, R., Thayer, M., 2013. Residential photovoltaic energy systems in California: the effect on home sales prices. Contemp. Econ. Policy 31 (4), 708–718.
Hoen, B., Adomatis, S., Jackson, T., Graff-Zivin, J., Thayer, M., Klise, G.T., Wiser, R.H., 2015. Selling into the sun: price premium analysis of a multi-state dataset of solar homes. Lawrence Berkeley National Lab Report (Available at https://emp.lbl.gov/sites/all/ files/lbnl-6942e.pdf).
Ma, C., Polyakov, M., Pandit, R., 2015. Capitalisation of residential solar photovoltaic
systems in Western Australia. Australian Journal of Agricultural and Resource Economics 60, 366-385
Our world in data. Renewable energy.
https://ourworldindata.org/renewable-energy (Hämtad 2015-05-16)
Qiu, Y., Wang, Y.D., Wang, J., 2017. Soak up the sun: Impact of solar energy systems on residential home values in Arizona. Energy Economics 66, 328-336
Rosén, S., 1974. Hedonic Prices and Implicit Markets: Product Differentiation in Pure Competetion. The Journal of Political Economy 82 (1), 34-55
Stock, J.H., Watson, M.W., 2014. Introduction to Econometrics, Update, Global Edition. Third edition. Pearson Educated Limited.
United Nations. Paris agreement
https://unfccc.int/process-and-meetings/the-paris-agreement/d2hhdC1pcy) (Hämtad 2015-05-16)
22
United Nations. Kyoto protocol
(https://unfccc.int/kyoto_protocol/background/items/3145.php) (Hämtad 2015-05-16)
United Nations. Agenda 2030
23
7 Appendix
[Include appendices if you have supplementary information that is helpful to the reader, but does not fit into the report. Note that the report needs to be complete and self-standing without the appendices – they are “extra” – but each appendix should be noted in the text. A single appendix is not numbered, only titled; multiple appendices are numbered and titles, with the number coming after the word Appendix.]
7.1 Benefits of a Pvoltaic system
What would the benefits of installing a Pvoltaic systems on a house be? According to Vattenfall the expected lifetime of a system is 30 years which means that you expect to produce a certain amount of electricity for 30 years. A system with a capacity to produce 5 kWp would produce 4500 kWp per year and Vattenfall will pay 1 SEK for 1 kWp if you do not consume that electricity yourself. The return from a Pvoltaic system is expected to be between 5-8% depending on the system size according to Vattenfall. This specific example is not necessarily historically accurate because older systems are generally more expensive, less effective and the Swedish government provided other levels of subsidies as well. In addition to the expected return of the investment, you would hedge against an increase of future electricity prices which means that it could be a suitable investment if you are risk averse.
7.2 History of subsidies
15th of May 2005 to 31 of December the subsidy was a 70% that only concerned public buildings.
Between the first of January 2009 and 30th of June there was no subsidies to photovoltaic systems.
From the first of July 2009 to 31 October 2011 it was 60% subsidy to households and small firms while big firms had a 55% subsidy.
1 of November 2011 to 31 of January 2013 there was a subsidy of maximum 45%.
First of February 2013 to 31 of December 2014 it was a 35% subsidy.
First of January 2015 to 31 December 2017 it was maximum subsidy of 30% to firms and 20% to households.
24
7.3 Scatter plots on capacity of Pvoltaic systems (effect) and
control variables
26