Analysis of the distribution of plant nutrients
in a biogas production system
– A look at VH Biogas, co-digesting manure from
several farms
André Johansson
Sveriges lantbruksuniversitet
Swedish University of Agricultural Sciences
Faculty of Natural Resources and Agricultural Sciences Department of Soil and Environment
Analysis of the distribution of plant nutrients in a biogas
production system
– A look at VH Biogas, co-digesting manure from several
farms
Analys av omfördelningen av växtnäring i ett biogasproduktionssystem
– En titt på VH Biogas, samrötning av gödsel från flera olika gårdar
André Johansson
Supervisors: Eva Salomon, RISE & Helena Aronsson, Department of Soil and Environment, SLU
Examiner: Holger Kirchmann, Department of Soil and Environment, SLU Credits: 30 ECTS
Level: Second cycle, A2E
Course title: Independent project in Biology – Master´s thesis Course code: EX0565
Programme/Education: Agriculture Programme – Soil and Plant Sciences 270 credits (Agronomprogrammet – mark/växt 270 hp)
Course coordinating department: Department of Soil and Environment Place of publication: Uppsala
Year of publication: 2019
Cover picture: VH biogas plant, photo by author, 2017
Title of series: Examensarbeten, Institutionen för mark och miljö, SLU Number of part of series: 2019:01
Online publication: http://stud.epsilon.slu.se Keywords: biogas, digestate, manure, nutrients
This study examined nutrient flows in a system where 20 farms deliver manure to a biogas plant for digestion, and then receive digestate back. Some other substrates were also anaerobically digested at the plant e.g. slaughter residues. The farms had different types of production: Organic and conventional dairy and conventional pig. The aim was to analyse the re-distribution of plant nutrients this creates. Biogas pro-duction is of interest since it has the potential to reduce the use of fossil fuels and potentially also greenhouse gas emission. The use of digestate as fertilizer has the potential for a more even distribution of plant nutrients across the landscape.
Data was taken from the biogas production plant and then analysed and organized to be able to see what the different types of farms contributed with in terms of plant nutrients. The results showed that there is a redistribution of plant nutrients between the farms and one type of farm can lose or gain nutrients compared to the other types of farms. The “winner” of the different types of farms seemed to be the organic dairy farms as they gained mineral nitrogen, whereas the others lost mineral N. The organic dairy farms lost phosphorous and potassium however, so it is dependent on each in-dividual farm what plant nutrient is valued the most. Conventional pig farms gained K whereas the dairy farms lost K. All types of farms lost P which was probably due to the solid fraction of the digestate being separated and not included in the digestate going back to the farms. The study also showed that the substrates other than manure had an influence on the plant nutrient content of the digestate. Slaughter residues stood for a lot of the total ingoing organic nitrogen to the biogas plant.
Keywords: Biogas, digestate, manure, nutrients
Denna uppsats undersökte flödet av växtnäring i ett biogasproduktionssystem där 20 gårdar levererar gödsel för rötning och tar tillbaka rötrest. En del andra substrat användes också i rötningen, exempelvis slaktrester. Gårdarna hade olika produktionsinriktningar: Ekologisk och konventionell mjölkproduktion samt konventionell svinuppfödning. Målet med uppsatsen var att analysera omfördelningen av växtnäring som skapas mellan gårdarna i detta system. Biogasproduktion är av intresse på grund av dess möjlighet att minska användandet av fossila bränslen och potentiellt även utsläpp av växthusgaser. Att använda rötrest som gödselmedel skapar förutsättningar för en jämnare fördelning av växtnäring i landskapet.
Data som togs från biogasanläggningen analyserades och organiserades för att skapa en bild av vad de olika produktionsinriktningarna bidrog med till systemet, i form av växtnäring. Resultatet visade att växtnäring omfördelas mellan gårdarna och att en typ av gård kan förlora eller tjäna växtnäring jämfört med en annan typ av gård. ”Vinnaren” bland de olika produktionsinriktningarna verkade vara de ekologiska mjölkgårdarna eftersom de tjänade mineralkväve medan de andra typerna förlorade mineralkväve. Gårdarna med ekologisk mjölkproduktion förlorade dock fosfor och kalium, och vilken typ av gård som kan anses tjäna på systemet var därmed subjektivt. De konventionella grisgårdarna tjänade kalium medan både ekologiska och konventionella mjölkgårdar förlorade kalium. Alla typer av gårdar förlorade fosfor vilket troligtvis berodde på att den fasta fraktionen i rötresten separerades och var inte inkluderad i den rötrest som transporterades tillbaka till gårdarna. Dessutom såldes en del rötrest till växtodlingsgårdar. Studien visade också att substraten utöver gödseln påverkade växtnäringsinnehållet i rötresten. Slaktrester stod för en stor del av den totala mängden organiskt kväve som inkom till biogasanläggningen.
Nyckelord: Biogas, rötrest, gödsel, växtnäring
Who’s the winner and who’s the loser when co-digesting
manure to produce biogas?
Conventional dairy and pig farms are giving valuable plant nutrients to or-ganic dairy farms in a biogas production system where animal manure is the main substrate. The plant nutrients studied were nitrogen, phosphorus and po-tassium, N, P and K. The biogas plant, situated in south-west Sweden, used a system where different types of farms delivered manure to the plant and then received digestate back. The study showed that organic dairy farms were the biggest winners and conventional dairy farms were the biggest losers.
Biogas production is a hot topic in Sweden, and Europe overall, due to the cli-mate change crisis we stand before. The question of how to replace fossil fuels with renewable energy sources has therefore rightly been in focus, and the production of biogas is no doubt an interesting alternative. What has been overlooked in public debate and research when it comes to biogas, is what’s in the leftovers – the digestate – and what to do with it. A common substrate in biogas production is manure. Ma-nure contains plant nutrients, including N, P and K but the concentrations of these may vary between animal species and production systems. So, in a system where you mix manure (and nutrients) from different types of farms and then send that blend back, you’ll end up with some farms gaining nutrients and some farms losing nutrients. That is exactly what a student at SLU decided to take closer look at in a thesis.
The study showed that organic dairy farms were winners of N, conventional dairy farmers were losers of all plant nutrients and the conventional pig farms lost N and P but gained K. This could pour fuel into the fire of the debate around the question if organic farming is dependent on conventional farming for its supply of plant nutrients, but it shines light upon a greater issue as well. Plant nutrients are
valuable, and most farmers wouldn’t happily give them away for free to others, which is why it is important to try and find out what nutrients are going where in a biogas production system using co-digestion of manure. The study made may pos-sibly lay the groundwork for a compensation system between the involved farms to make sure everyone is getting a fair deal.
One surprising find was that all farms were losers of P, and that was attributed to the fact that the biogas plant separated a solid fraction from the liquid one in the digestate. No analyses were made on the solid fraction as it was not sent back to farms delivering manure, but it seems likely that a lot of the P were bound to the organic matter contained within that fraction.
The results in the thesis was created by taking analyses of manure and digestate that was available via the biogas plant and running them with all the data of incom-ing and outgoincom-ing deliveries to see what the nutrient flows between the farms looked like.
List of Tables 6
List of Figures 7
1 Introduction 11
1.1 Objectives 11
1.2 Biogas production reduces the need of fossil fuels 11 1.3 The microbiology of biogas production 12 1.4 Anaerobic digestion of manure could lead to less eutrophication 13 1.5 Manure as a biogas production substrate 15
1.6 Biogas yield potential 15
1.7 Separation of digestate 16
1.8 The effect of anaerobic digestion on weed seeds, chemicals and pathogens 17
1.9 Greenhouse gas emissions 17
1.10 VH Biogas – a biogas production plant in Vårgårda, Västergötland 18
2 Method 21
2.1 Collection of data 21
2.2 Processing of data 22
2.3 Study visit to Västergötland 23
2.4 Statistics 23 3 Results 24 3.1 Time periods 25 3.2 Type of farm/company 28 3.2.1 Substrate 28 3.2.2 Digestate 30
3.3 Digestate-substrate difference for type of deliverer/receiver 37 3.4 Digestate – substrate differences for individual farms 41
3.5 Interview with organic dairy farmer 48
4 Discussion 49 4.1 Method 49 4.2 Results 50 4.2.1 Dry matter 51 4.2.2 Total Nitrogen 51 4.2.3 Potassium 52
Table of contents
4.2.4 Phosphorous 52
4.2.5 NH4-N 52
4.2.6 Weed seeds 53
4.2.7 Who is the winner? 53
4.2.8 Further improvements 54
5 Conclusions 55
Acknowledgements 57
References 58
Appendix 1: Digestate-substrate difference, dairy and pig farms only 61
Appendix 2: Fresh weight of substrate delivered to VH Biogas for each farm 63
Appendix 3: Weight and nutrient sums for each individual farm 64
Table 1. Potential methane yields in m3 per m3 of different kinds of substrates. From (Angelidaki & Ellegaard, 2003) and (Lehtomäki et al., 2008) 16 Table 2. The total amount of substrate delivered to VH Biogas by the conventional
dairy farms, organic dairy farms and conventional pig farms. The percentages stand for each farm’s share of the total fresh weight of
substrates coming in to VH Biogas. 63
Table 3. The sums of all weights and nutrients in the substrate delievered to VH Biogas by each individual conventional dairy farm. 64 Table 4. The sums of all weights and nutrients in the digestate received from VH
Biogas by each individual conventional dairy farm. 64 Table 5. The sums of all weights and nutrients in the substrate delievered to VH
Biogas by each individual organic dairy farm. 65 Table 6. The sums of all weights and nutrients in the digestate received from VH
Biogas by each individual organic dairy farm. 65 Table 7. The sums of all weights and nutrients in the substrate delievered to VH
Biogas by each individual conventional pig farm. 66 Table 8. The sums of all weights and nutrients in the digestate received from VH
Biogas by each individual conventional pig farm. 66
Figure 1. Illustration of the chemical processes involved in biogas production. From
Schnürer & Jarvis (2009). 12
Figure 2. Illustration of the different flows of substrates (arrows pointing towards the digestion chamber) to and digestate (arrows pointing away from the digestion chamber) from VH Biogas plant. 20 Figure 3. Monthly average fresh weight of outgoing digestate and incoming substrate
to VH Biogas plant. The average is calculated from the total amounts of outgoing digestate and incoming substrate during the time periods stated on the x axle. Positive values indicate influx to and negative values indicate outflux from VH Biogas plant. 25 Figure 4. Monthly average dry matter weight of outgoing digestate and incoming
substrate to VH Biogas plant. The average is calculated from the total amounts of outgoing digestate and incoming substrate during the time periods stated on the x axle. Positive values indicate influx to and negative values indicate outflux from VH Biogas plant. 25 Figure 5. The total fresh weight of all substrates delivered to VH Biogas plant per
year. 26
Figure 6. The total dry matter weight of all substrates delivered to VH Biogas plant
per year. 26
Figure 8 The total dry matter weight of all digestate going out from VH Biogas plant
per year. 27
Figure 7. The total fresh weight of all digestate going out from VH Biogas plant per
year. 27
Figure 9. Pie chart showing the share of the total fresh weight of substrate delivered to VH Biogas by each type of deliverer. The data is taken from 2015 and
2016. 31
Figure 10. Pie chart showing the share of the total N in all substrates delivered to VH Biogas by each type of deliverer. The data is taken from 2015 and 2016.
31 Figure 11. Pie chart showing the share of total amount of N-org in all substrates
delivered to VH Biogas by each type of deliverer. The data is taken from
2015 and 2016. 32
Figure 12. Pie chart showing the share of total amount of NH4 in all substrates delivered to VH Biogas by each type of deliverer. The data is taken from
2015 and 2016. 32
Figure 13. Pie chart showing the share of total amount of P in all substrates delivered to VH Biogas by each type of deliverer. The data is taken from
2015 and 2016. 33
Figure 14. Pie chart showing the share of total amount of K in all substrates delivered to VH Biogas by each type of deliverer. The data is taken from
2015 and 2016. 33
Figure 15. Pie chart showing the share of total dry matter weight of all substrates delivered to VH Biogas by each type of deliverer. The data is taken from
2015 and 2016. 34
Figure 16. Pie chart showing the share of the total fresh weight of digestate produced by VH Biogas, by each type of receiver. The data is taken from
2015 and 2016. 35
Figure 17. Pie chart showing the share of the total N in all digestate produced by VH Biogas, by each type of receiver. The data is taken from 2015 and 2016.
35 Figure 18. Pie chart showing the share of the total amount of N-org in all digestate
produced by VH Biogas, by each type of receiver. The data is taken from
2015 and 2016. 35
Figure 19. Pie chart showing the share of the total amount of NH4 in all digestate produced by VH Biogas, by each type of receiver. The data is taken from
2015 and 2016. 36
Figure 20. Pie chart showing the share of the total amount of P in all digestate produced by VH Biogas, by each type of receiver. The data is taken from
2015 and 2016. 36
Figure 21. Pie chart showing the share of the total amount of K in all digestate produced by VH Biogas, by each type of receiver. The data is taken from
2015 and 2016. 36
Figure 22. Pie chart showing the share of total dry matter weight of all digestate produced by VH Biogas, by each type of receiver. The data is taken from
2015 and 2016. 36
Figure 23. Diagram showing, for each type of deliverer/reciever, the difference between the amount of digestate (in fresh weight) received from VH Biogas minus the amount of substrate (in fresh weight) delivered to VH Biogas. The data is taken from 2015 and 2016. 39 Figure 26. Diagram showing, for each type of deliverer/receiver, the difference
between the amount of NH4 received from VH Biogas minus the amount of NH4 delivered to VH Biogas. The data is taken from 2015 and 2016. 39 Figure 25. Diagram showing, for each type of deliverer/receiver, the difference
between the amount of N-org received from VH Biogas minus the amount of N-org delivered to VH Biogas. The data is taken from 2015 and 2016. 39 Figure 24. Diagram showing, for each type of deliverer/receiver, the difference
amount of N delivered to VH Biogas. The data is taken from 2015 and
2016. 39
Figure 29. Diagram showing, for each type of deliverer/receiver, the difference between the amount of digestate (in dry matter weight) received from VH Biogas minus the amount of substrate (in dry matter weight) delivered to VH Biogas. The data is taken from 2015 and 2016. 40 Figure 28. Diagram showing, for each type of deliverer/receiver, the difference
between the amount of K received from VH Biogas minus the amount of K delivered to VH Biogas. The data is taken from 2015 and 2016. 40 Figure 27. Diagram showing, for each type of deliverer/receiver, the difference
between the amount of P received from VH Biogas minus the amount of P delivered to VH Biogas. The data is taken from 2015 and 2016. 40 Figure 30. Diagram showing, for individual farms, the difference between digestate
received from VH Biogas (in fresh weight) minus substrate delivered to VH Biogas (in fresh weight). The numbers on the x-axle anonymously indicate each individual farm and their production type is marked by the coloured bar at the bottom of the diagram. Farm 25 is both an organic dairy farm and a conventional pig farm. The data is taken from 2015 and 2016. 44 Figure 31. Diagram showing, for individual farms, the difference between total
amount of N received from VH Biogas minus total amount of N delivered to VH Biogas. The numbers on the x-axle anonymously indicate each individual farm and their production type is marked by the coloured bar at the bottom of the diagram. Farm 25 is both an organic dairy farm and a conventional pig farm. The data is taken from 2015 and 2016. 44 Figure 32. Diagram showing, for individual farms, the difference between the amount of N-org received from VH Biogas minus the amount of N-org delivered to VH Biogas. The numbers on the x-axle anonymously indicate each individual farm and their production type is marked by the coloured bar at the bottom of the diagram. Farm 25 is both an organic dairy farm and a conventional pig farm. The data is taken from 2015 and 2016. 45 Figure 33. Diagram showing, for individual farms, the difference between the amount
of NH4 received from VH Biogas minus the amount of NH4 delivered to VH Biogas. The numbers on the x-axle anonymously indicate each individual farm and their production type is marked by the coloured bar at the bottom of the diagram. Farm 25 is both an organic dairy farm and a conventional pig farm. The data is taken from 2015 and 2016. 45 Figure 34. Diagram showing, for individual farms, the difference between the amount
of P received from VH Biogas minus the amount of P delivered to VH Biogas. The numbers on the x-axle anonymously indicate each individual farm and their production type is marked by the coloured bar at the bottom of the diagram. Farm 25 is both an organic dairy farm and a conventional pig farm. The data is taken from 2015 and 2016. 46 Figure 35. Diagram showing, for individual farms, the difference between the amount
of K received from VH Biogas minus the amount of K delivered to VH Biogas. The numbers on the x-axle anonymously indicate each individual farm and their production type is marked by the coloured bar at the bottom
of the diagram. Farm 25 is both an organic dairy farm and a conventional pig farm. The data is taken from 2015 and 2016. 46 Figure 36. Diagram showing, for individual farms, the difference between digestate
received from VH Biogas (in dry matter weight) minus substrate delivered to VH Biogas (in dry matter weight). The numbers on the x-axle
anonymously indicate each individual farm and their production type is marked by the coloured bar at the bottom of the diagram. Farm 25 is both an organic dairy farm and a conventional pig farm. The data is taken from
2015 and 2016. 47
Figure 40. Diagram showing, for each type of farm, the difference between the amount of NH4 received from VH Biogas minus the amount of NH4
delivered to VH Biogas. The data is taken from 2015 and 2016. 61 Figure 39. Diagram showing, for each type of farm, the difference between the
amount of N-org received from VH Biogas minus the amount of N-org delivered to VH Biogas. The data is taken from 2015 and 2016. 61 Figure 38. Diagram showing, for each type of farm, the difference between the total
amount of N received from VH Biogas minus the total amount of N
delivered to VH Biogas.The data is taken from 2015 and 2016. 61 Figure 37. Diagram showing, for each type of farm, the difference between the total
fresh weight of digestate received from VH Biogas minus the total fresh weight of substrate delivered to VH Biogas. The data is taken from 2015
and 2016. 61
Figure 41. Diagram showing, for each type of farm, the difference between the amount of P received from VH Biogas minus the amount of P delivered to VH Biogas. The data is taken from 2015 and 2016. 62 Figure 42. Diagram showing, for each type of farm, the difference between the
amount of K received from VH Biogas minus the amount of K delivered to VH Biogas. The data is taken from 2015 and 2016. 62 Figure 43. Diagram showing, for each type of farm, the difference between the total
dry matter weight received from VH Biogas minus the total dry matter weight delivered to VH Biogas. The data is taken from 2015 and 2016. 62
1.1 Objectives
This study examined nutrient flows in a system where 20 farms deliver manure to a biogas plant for digestion, and then receive digestate back. The specific purpose was to analyse how the distribution of plant nutrients (organic and mineral nitrogen, phosphorus and potassium), as well as fresh weight and dry matter weight of the substrates and digestate to and from the different farms is affected. The overall aim was to assess the potential for resource-efficient utilization of plant nutrients in small to large-scale biogas plants.
Questions:
o Can digesting manure help to more evenly distribute plant nutrients? o Is there a risk of farmers losing plant nutrients that they would like to keep? o Do different kinds of farms (dairy, pigs, organic, conventional)
deliver/re-ceive different ratios and/or amounts of plant nutrients?
o Is there a seasonal difference in plant nutrient delivery (e.g. grazing period for dairy) to the biogas plant?
o How much do the added substrates (eg food waste etc) influence the plant nutrient content of the digestate?
1.2 Biogas production reduces the need of fossil fuels
Biogas is a renewable source of energy and in a world of increasing energy demands it is necessary to find valid alternatives to fossil-based fuels to reduce the anthropo-genic greenhouse gas emissions. The Paris agreement that has been signed by 195 countries states that the increase of the mean global temperature must be kept under 2°C (unfccc.int, 2017) and the emissions of greenhouse gases must be lowered in
order to reach that goal. One way of decreasing the use of fossil fuels is to increase biogas production. That would also create an opportunity to decrease the negative impact that management of waste and agricultural practices have on the environ-ment as of today (Börjesson & Berglund, 2007).
1.3 The microbiology of biogas production
Biogas is a mixture of gases, consisting mainly of carbon dioxide and methane, which is produced through anaerobic digestion of a substrate (Morgan & Pain, 2008). The microbial processes that together produce biogas is generally divided into four different steps (Fig. 1). These names vary depending on the literature but in this thesis, they will be called hydrolysis, fermentation, acetogenesis and meth-anogenesis after Angenent et al., (2004), Weiland (2010) and Zhang et al., (2014). A different group of microorganisms are responsible for each step and they are all somewhat dependent on each other (Weiland, 2010).
Figure 1. Illustration of the chemical processes involved in biogas production. From Schnürer & Jarvis (2009).
The first step, hydrolysis, consists of the degradation of organic substances like li-pids, proteins and carbohydrates (Weiland, 2010; Morgan & Pain, 2008). These sub-stances are broken down to monomers and oligomers such as long chain fatty acids, amino acids, sugars and some alcohols by enzymes produced by different types of microorganisms (Weiland, 2010; Schnürer & Jarvis, 2009; Morgan & Pain, 2008). This step enables microorganisms to directly absorb the nutrients and use as sub-strate. Different substrates take different amount of time for the microbes to hydro-lyse, proteins are for example broken down more rapidly than cellulose and hemi-cellulose (Schnürer & Jarvis, 2009)
The second step, fermentation, produces mostly organic acids, alcohols, CO2, H2 as well as ammonia. The amounts and ratios of these substances that are produced depends on both the substrate and what microorganisms are present in the digestion chamber (Schnürer & Jarvis, 2009). All of the products of the second step may be used as substrate for other groups of microorganisms in the third step: acetogenesis. In that step they are further oxidized to H2 and acetic acid. The other pathway in acetogenesis is the formation of acetate from H2 and CO2 (Angenent et al., 2004)
The fourth and last step, methanogenesis, is heavily dependent on the third step. Biogas is produced from acetate and from H2 and CO2 by Archea as opposed to the first three steps where bacteria are responsible for the decomposition of the sub-strates. The methanogenesis is dependent on the acetogenesis and vice versa because the acetogenetic bacteria will stop producing H2 whenever the concentration of it gets too high. The process of methanogenesis consumes H2 at a steady rate which creates the possibility of a steady production of it by the bacteria involved in the third step. If both the third and fourth step are in line with each other, an equilibrium may be reached where biogas is produced while the concentration of H2 is kept low. (Schnürer & Jarvis, 2009).
In conclusion, it can be said that the production of biogas is a complex process with several organisms involved that all need adequate living conditions. The pro-cess is also heavily dependent on the substrates used in the anaerobic digestion chamber.
1.4 Anaerobic digestion of manure could lead to less
eutrophication
Aside from the potential reduction of fossil fuel use when producing biogas, eu-trophication is an acknowledged issue in waters, as in for example the Baltic sea (Andersen et al., 2015) and the phenomenon is due to increased influx of nitrogen
and phosphorus into the sea (Gustafsson et al., 2012). Eutrophication leads to hy-poxic conditions in the water and it has been proven that the influx of nutrients to the Baltic sea is caused by anthropogenic activities (Carstensen et al., 2014). It has been seen that a significant portion of the leached nutrients stem from agriculture. (Humborg, 2016; Bonsdorff et al., 1997) point out that aqua- and agriculture are the two activities that first and foremost cause oxygen-deficient sea bottoms as a result of eutrophication. The Baltic Sea Action Plan states that changed agricultural prac-tices to reduce the flow of nutrients into the Baltic sea, are an objective towards the goal of striving for a healthy sea (HELCOM, 2007). All the countries around the Baltic sea are responsible for the influx of nutrients into it, but some countries, such as Denmark have shown a decrease in anthropogenic inputs from 1990-2010. Mean-while, other countries, such as Poland have instead shown an increase in nutrient inputs during the same time span (Humborg, 2016). Humborg (2016) also states that nutrient imbalances are usually connected to high densities of livestock. This is likely due to the fact that the manure is spread on a relatively small area. This thesis will focus on the possible environmental advantages of anaerobically digesting ma-nure from several farms, where digestate is redistributed to farmland after digestion as a valuable fertilizer. This might enable efficient use of plant nutrients due to, in theory, a lower N-org/NH4-N quota and the difference in physical properties be-tween manure and digestate. Moreover digestion of manure from different farms at one biogas plant may enable logistic networks for strategic spreading of digestate that might reduce leaching and nutrient load on the Baltic Sea. In order to be able to distribute the nutrients on an even larger scale, more regionally, some sort of con-centration of the digestate would be needed to make it economically sound to transport it further. This could perhaps be done through drying or filtering the nu-trients from the water.
In both countries mentioned earlier, Denmark and Poland, agricultural practises are bound to have changed in some way during 1990-2010 and that may act as an indicator that change can both be positive and negative in regard to leaching of nu-trients. It is therefore of interest to investigate how the anaerobic digestion of ma-nure from several farms affects the distribution of plant nutrients and if it may in-crease or dein-crease the leaching of them. Pig manure contains more phosphorus than dairy manure (Brown, 2008), so from a plant nutrient distribution perspective it should be positive to co-digest manure from different farms to get a better distribu-tion of phosphorus in the landscape.
1.5 Manure as a biogas production substrate
When constructing a biogas production plant there are many things to consider, not the least what to use as the primary digestion substrate. Using manure as a substrate comes with many advantages including its steady supply, in terms of that there is little variance in the volumes produced throughout the year, it being a waste product and that it contains many of the micronutrients that the anaerobic digestion microbes demands. If manure is not used as substrate, many of the micronutrients need to be added in order to achieve satisfactory production of biogas e.g. cobalt and iron (Weiland, 2010; Jarvis et al., 1997) There is also no shortage of substrate as 1578 million tonnes of manure is produced in the EU as of 2003 (Nielsen et al., 2007). It is also a substrate that requires little handling or pre-treatment before it can be put through the digestion chamber compared to for example a ley crop or municipal organic waste (Börjesson & Berglund, 2006). Thereby, little energy would be needed to make it a suitable substrate, which increases the net energy output. Fur-thermore, manure is produced regardless of it being used in biogas production or not which is not the case if for example ley would be produced for the purpose of biogas production. However, a biogas plant is generally a facility were wastes of different kinds are used and may act as a valuable step towards closing the circula-tion of nutrients between agricultural produccircula-tion and the consumpcircula-tion in cities. It is also possible that if a greater deal of the manure available were to be put through an anaerobic digestion chamber, it would be possible to prevent methane from leaking to the atmosphere due to spontaneous anaerobic digestion taking place at the liquid manure storage. If the energy stored in the manure could instead be gathered and utilized, a clean source of renewable energy has been found as well as a way to reduce greenhouse gas emissions. Anaerobic digestion also changes the properties of the manure. A review by Möller and Müller (2012) states that digestion of manure leads to higher NH4-N content and pH as well as lower content of organic matter, carbon and viscosity(Möller & Müller, 2012)
1.6 Biogas yield potential
The energy and nutrient contents of manure can vary greatly between different kinds of manure. Factors that influence are the species of animal, or rather more specifi-cally on how the digestive system of the animal is formed (Omnivore, ruminant, colon digester etc.) (Lukehurst et al., 2010), as well as the sex, age and diet of the animal (Lukehurst et al., 2010). The potential methane yield from manure is rela-tively low compared to other substrates (see table 1) but it has other advantages.
With a dry matter content typically around 5-9 % (Angelidaki & Ellegaard, 2003) it has a high content of water and may therefore act as a solvent for other substrates with a higher dry matter content. That facilitates practical issues on the plant regard-ing pumpregard-ing and treatment of the more solid substrates. Manure has also got a high buffering capacity, providing stability to the anaerobic digestion process which is sensitive to changes in pH (Angelidaki & Ellegaard, 2003).
Table 1. Potential methane yields in m3 per m3 of different kinds of substrates. From (Angelidaki &
Ellegaard, 2003) and (Lehtomäki et al., 2008)
Substrate Methane yield (m3/m3) Manure-pig 13,9 Manure-dairy 13,4 Manure-mixed with straw 28,5 Industrial waste-conc. sludge 50-70 Industrial waste-mo-lasse 190 Industrial waste-meat and bone fluor
325
Household waste 100-150
1.7 Separation of digestate
If the digestate is separated into a solid and a liquid fraction after going through the digestion chamber, it will affect the plant nutrients it contains. The solid fraction usually has high content of N and most of the total P will be allocated to the solid fraction (Möller & Müller, 2012). There are increased risks of N losses in the solid fraction due to ammonia volatilization, leaching and denitrification if it is not stored anaerobically. The same review by Möller & Müller (2012) states that the liquid fraction usually has a low dry matter and P content, but high N and K levels. They also state other advantages in terms of nutrient use efficiency of separating anaero-bically digested manure. These are for example:
o Practical improvements due to changed physical properties, e.g. more ho-mogenous, easier to spread, faster infiltration in soil for the liquid fraction o The liquid fraction will contain less P and heavy metals
o Increased plant uptake of N because of higher NH4-N/N-tot quotas and lower content of C in the liquid fraction, leading to less immobilization in the ground when applied.
1.8 The effect of anaerobic digestion on weed seeds,
chemicals and pathogens
When putting manure through anaerobic digestion it also seems to stimulate micro-bial activity and thus helping dissipating farm chemicals for example. It has been shown that digestate from manure increases dissipation of the herbicide atrazine (Kadian et al., 2008) and increases the microbial activity in soil contaminated with the insecticide chlorpyrifos compared to fresh manure (Kadian et al., 2012).
Weed seed viability is another important factor to consider when anaerobically digesting manure, especially where manure from different farms are being co-di-gested. The digestion process itself does substantially reduce the viability of weed seeds according to (Šarapatka et al., 1993) but (Allan et al., 2003) found no signif-icant differences before or after digestion. It seems there is no scientific consensus on the matter. However, the hygienization routines of substrate are likely to decrease weed seed germination.
Another concern when spreading manure and/or digestate on your fields are that the pathogens therein are also being spread, if there is no hygienization step. This is of special concern where manure from several different farms are being co-digested, and the digestate then being used on all of those farms. It is especially sensitive when spreading on fields where forage is grown, so as to not have the animals be-come infected through feeding. Studies show, however, that anaerobic digestion dramatically decreases the pathogenic bacteria present in manure faster than if the manure is being stored as is (Côté et al., 2006; Kearney et al., 1993). It could there-fore be seen as an advantage to each farm to anaerobically digest the manure, even if it means risking exposure to pathogens on other farms because they are likely to be eliminated in the digestion process anyway. All substrate going into the digestion chamber at VH Biogas plant, which was studied in this work, is hygienized which should reduce pathogen presence anyway.
1.9 Greenhouse gas emissions
Producing biogas from manure to reduce fossil fuel use seems like a step towards reducing greenhouse gas emissions, but it is important to take into account the dif-ference in emissions from manure and digestate. It has been shown that digestate have three times higher emissions of CH4 during storage than manure during sum-mer (Rodhe et al., 2015). The authors of that article recommends cooling or acidifying the digestate as an alternative to limiting storage during summer months and utilizing gas tight covers to collect CH4 during the warm months. They also point out that digestate cause more NH3 emissions during spreading than manure
does, due to higher pH. Rodhe (2018) lists in a more recent article several measures that can be taken to reduce greenhouse gas emissions from both manure and digestate derived from manure. These include: acidification, reducing temperature through installing white cover on storage or making the storage is shaded, having a long retention time for the substrate in the biogas production process and finally to make sure there is some form of crust on the manure/digestate (Rodhe et al., 2018)
1.10 VH Biogas – a biogas production plant in Vårgårda,
Västergötland
The biogas production plant from which the data used in this study was taken is situated in Sweden. The plant has many owners and none of them own more than 8 % of the company. Biogas production was started in October 2013. The main strate is animal manure which stands for about 85 % of the total mass of the sub-strates used. The other 15 % are mainly slaughter residues, industrial residues (grease trap grease, frying oil, iron filter sludge), ley and some food waste. The manure that is delivered to the plant is produced on farms that receive digestate in return, without any payment in-between. Both farms with organic and conventional production deliver manure to and receive digestate from the biogas plant. The farms that deliver manure have dairy, pork, and poultry production. The poultry manure is bought in and the poultry farmers do not receive digestate in return. Of the manure that is used for the biogas production, 80 % is produced in a 15km radius from the plant and the farm furthest away is located 30km away. The size of the farms and therefore the amount of substrate delivered from them, varied during the study pe-riod (Tables 2-7 in Appendix). The other substrates are purchased and are consid-ered valuable due to their higher biogas potential (Table 1.). In order to handle var-iation in influx of substrate and outflux of digestate (Fig. 3) the storage capacity at the plant was dimensioned for this. On top of the previous mentioned substrates, about 300-400 tonnes of iron filter sludge is added to the digestion chambers every year. This is not documented in the plants web-based data handling tool (DVTime), according to the manager, and added that it contains a lot of P which is seen as an advantage for the plant nutrient content in the digestate.
The biogas production plant is of the continuous stirred tank reactor type. The stirring system today is not adequate, according to the manager, and it is believed it impairs the biogas production. There is three propeller-stirrers in each chamber with a combined effect of 48kW. There are currently ideas of implementing a gas-bubble stirring system in the future to make digestion more efficient.
The end product at the plant is vehicle gas, a purified version of biogas contain-ing at least 97 % methane. The biogas collected in the anaerobic digestion chambers
have a methane content of about 65 %. The production of biogas in this facility starts with all of the substrates (around 250 m3 per day) getting mixed and then pumped through a hygienization chamber where the mixed substrate is heated to 70°C for one hour. From there, the substrate is pumped into the bottom of the digestion cham-bers where the temperature is kept around 39-40 °C. Solid substrates, like silage, are added from the top of the digestion chambers. The volume of the two chambers is 2500 m3 and 4500 m3 respectively. The plant is heated by a boiler fuelled by wood-chips and the heating system is automatic. The retention time in the digestion chambers is 34 days and then an additional three to four days in the unloading cham-ber. The unloading chamber as of today does not have a working gas collecting system but there are plans to build a new digestion chamber and use one of the old ones as a post-digestion gas collection chamber to maximize biogas output of the substrate. It is estimated that there is about 4 m3 of biogas left per wet tonne of digestate after going through the digestion chamber, a number that is figured to drop to about half when the post-digestion gas collection chamber is in place.
The digestate is also put through an auger press that separates a dry faction of about 30 % dry matter from the digestate. The dry faction contains mostly fibres and is sold as animal bedding to farmers.
Every day, 4700kg of purified vehicle gas is produced at the plant and delivered and sold to the company Svensk Fordonsgas via a 4km long pipeline. In the end, the gas is primarily used for fuel in public transport such as buses and municipality owned vehicles. No gas is stored at the plant leading to some of it being burned when Svensk Fordonsgas cannot receive and store any more. The total amount of gas burned adds up to only a few parts per mille. The purification is made through a dry-filtration followed by a process called membrane filtration which reduces CO2, H2, condense water, sulphuric gases and other unwanted substances.
The total methane emissions from the plant is about 0,2 – 0,3 %, which can be compared with the regulations stating that it must be under 0,5 %. The whole plant consumes about 200 000kW of electricity every month. No electricity is produced from the biogas produced at the site. The digestate is organically certified (biogodsel.se, 2018) and can be used as fertilizer in both conventional and organic crop production.
Many of the farmers that deliver manure and receives digestate do so in the belief that they receive a better fertilizer. Better in this case may be from a plant nutrient perspective, but also because of practical reasons. This will be discussed later in the thesis. The manager of the plant, and some of the stakeholders that do not deliver manure are solely focused on the production of biogas however and that is the main interest for them. Many of the farmers are also owners of the plant, aside from de-livering manure.
Figure 2. Illustration of the different flows of substrates (arrows pointing towards the digestion chamber) to and digestate (arrows pointing away from the digestion chamber) from VH Biogas plant.
In order to investigate flows of materials and nutrients from farms and other sources to the biogas plant and back to farms (Fig. 2), existing data from VH Biogas was used. This included collecting and analysing data available from VH Biogas, inter-viewing the manager of the plant as well as one of the farmers delivering manure to the plant. A literature review was also made in order to examine how manure as a biogas substrate might affect the nutrient balances on farms as well as balances on a more regional or national level.
2.1 Collection of data
The raw data were collected from a web-based tool called DVTime (Developed by Dataväxt) which is used to store data at VH biogas plant. All inbound deliveries of substrates, mainly manure, and all outbound deliveries of digestate are registered. In DVTime, the digestate was sometimes registered under the name bioslurry but in this report digestate will be the term used. Data from 2015 and 2016 were used in this study. The data stored in the tool consisted of, for example, net weight and analysis of plant nutrient content. Analyses of the manure was taken twice every year at every farm that delivered manure and the digestate produced in the plant was analysed four times every year. This means that every in- and outbound delivery was not individually analysed but rather the latest available analysis was applied for the substrate/digestate and therefore the values for plant nutrients and dry matter are based on the net weight of the delivery and calculated by DVTime. All the values that are present in DVTime have been manually typed in by the staff at the biogas plant or calculated by the tool from values manually typed in. All analyses had been made from samples that the staff at the plant sent in to Eurofins lab. One demarca-tion that was made for this study was to not include any micronutrients or heavy metals, so it is not known to what extent the distribution of those are affected.
The data that was available through DVTime was downloaded and pasted in Mi-crosoft Excel where it was arranged in such a way that it was suitable for statistical analysis. The statistical analyses were then made in JMP. Most of the work done in JMP consisted of sorting and organizing data as well as constructing tables. The data was sorted and grouped by different parameters which will be further ex-plained. They were:
o Grazing/non-grazing period o Category o Type of product o Substrate/digestate o Type of deliverer/receiver o Farm/customer
2.2 Processing of data
Grazing/non-grazing period: The data was divided in six different groupings accord-ing to year and whether the delivery had been made before, duraccord-ing or after the graz-ing period for a given year (2015 or 2016). The grazgraz-ing period was set as June, July and August. The intention of dividing the data by grazing/non-grazing period was to see if there were any differences between how much the dairy farms and the pig farms delivered to the biogas plant in terms of plant nutrients during the summer months compared to the rest of the year. The idea was to see if the dairy farms delivered less nutrients since the dairy were out on pasture and spread a portion of the nutrients on the pastures through urination and defecation.
Category: The categories concern how the biogas plant classified the different substrates taken into the facility as well as the digestate taken out of it. The different categories were digestate, manure, food waste, slaughter residues category 1 and 2 and other. The reason VH Biogas had for dividing the data into these groups was to see how much the different substrates contributed towards the plant nutrient content in the digestate. There were some inconsequence’s in how the plant had divided the different deliverers and therefore I chose to rename the categories according to Type of product in order to better explain what was included.
Type of product: This grouping was made by me and was intended to divide the different substrates into different categories so that it would be possible to trace from where the nutrients in the digestate came and what type of substrate was most valuable from a plant nutrient perspective. I identified four different kinds of sub-strates that would be interesting to analyse, and they were: manure, fats, slaughter residues and wheat processing residues (Lantmännen Reppe).
Substrate/digestate: A simple grouping based on whether the data concerned sub-strate or digestate.
Type of deliverer/receiver: This grouping was based on what type of farm or industry the substrates were delivered to the biogas plant from. They were divided into nine different categories. Conventional or organic dairy, conventional pig, con-ventional poultry, ley producer, circulation, food waste, other and receiver of diges-tate. The group called other is a collection of miscellaneous deliverers consisting of a ley producer, a cider brewery and two companies that process grains and deliver the rest product of that process.
Farm/customer: This category divided the data in 50 different groups. Each group was one farm/customer that either delivered substrate, received digestate or both delivered substrate and received digestate. By doing this, it was possible to analyse the flow of nutrients in and out from each farm.
2.3 Study visit to Västergötland
A study visit to the biogas plant was made where the manager showed me around and talked about some of the technical specifications and how the plant was run from a practical perspective. An interview with the manager was also conducted to get more information on how the staff uploaded the data to DVTime, possible errors and faulty data in the tool and other general information about the plant.
A visit was also paid to one of the organic dairy farmers that delivers manure and receives digestate were a short interview was made as well as a general discus-sion on his experiences about being involved in the project. The guide used in the interviews with the farmer and the plant manager can be found in the appendix. The interviews were made casually and through dialogue rather than question-answer, so the guides were not followed strictly.
2.4 Statistics
The data that was collected from DVTime was pasted into excel where it was coded according to the different categories named under the headline “collection of data”. The data was then pasted into JMP, where all histograms and statistical analyses have been made. In total, 7802 rows of data have been processed and 8246 rows of data was extracted from DVTime. Thus, 444 rows of data or 5.4 % of the total data have been excluded from statistical analysis. The unprocessed data is due to no nu-trient analysis being available or it being otherwise untrustworthy.
In general, the results sought to describe the different flows of substrates and diges-tate to and from VH Biogas plant according to figure 1. The cropland area of all of the farms receiving digestate are unknown, which is important to note when reading the results. All numbers are totals for each farm or company and it is not known what the average net gain, or loss, of plant nutrients is per hectare. However, the numbers in the tables in the appendix give an indication of the size of each farm as the amount of substrate delivered is likely related to the arable area of the farm. The farms described are all specialized in one type of production (organic or conven-tional dairy or convenconven-tional pig) except farm 25 which has both organic dairy and conventional pig production. Data for the different farms are available in Tables 3-7 in appendix. There were seven conventional dairy farms, ten organic dairy farms and four conventional pig farms (farm 25 is counted for both of the latter). The poultry farms only deliver substrate without receiving any digestate while all crop-ping farms only receive digestate without delivering substrate. The types of deliv-erers that are named “Fats”, “Slaughter residues”, “Food waste” and “Other” only deliver substrate. All the diagrams in the results are based on the combined data from 2015 and 2016 (unless stated otherwise). This is warranted due to the different years being very similar in terms of substrate delivered and digestate received by the farms.
3.1 Time periods
Figure 3. Monthly average fresh weight of outgoing digestate and incoming substrate to VH Biogas plant. The average is calculated from the total amounts of outgoing digestate and incoming substrate during the time periods stated on the x axle. Positive values indicate influx to and negative values indicate outflux from VH Biogas plant.
Figure 4. Monthly average dry matter weight of outgoing digestate and incoming substrate to VH Biogas plant. The average is calculated from the total amounts of outgoing digestate and incoming substrate during the time periods stated on the x axle. Positive values indicate influx to and negative values indicate outflux from VH Biogas plant.
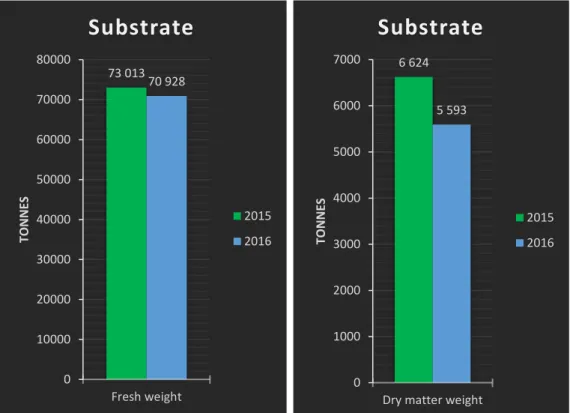
The fresh weight of substrates coming in to VH Biogas plant did not differ greatly between the selected time periods (Fig. 3) or between years (Fig. 5). More variation could be found in the outgoing digestate which had peaks in Sep-Dec in both 2015 and 2016 (Fig. 3). Regarding incoming dry matter weight of substrates, there were more variation between the selected time periods compared to the fresh weight of
-8000 -6000 -4000 -2000 0 2000 4000 6000 8000
jan-may -15 jun-aug -15 sep-dec -15 jan-may -16 jun-aug -16 sep-dec -16
TON N ES
Fresh weight
Digestate Substrate -400 -300 -200 -100 0 100 200 300 400 500 600 700jan-may -15 jun-aug -15 sep-dec -15 jan-may -16 jun-aug -16 sep-dec -16
TON
N
ES
Dry matter weight
incoming substrates (Fig. 4). The dry matter weight of substrates going in were con-siderably lower in 2016 compared to 2015 (Fig. 7). Taking that into account, to-gether with the fact that the fresh weight of incoming substrates was only slightly lower in 2016 than in 2015 (Fig. 5), it gives an indication that the substrates going in in 2016 had a lower dry matter percentage than in 2015.
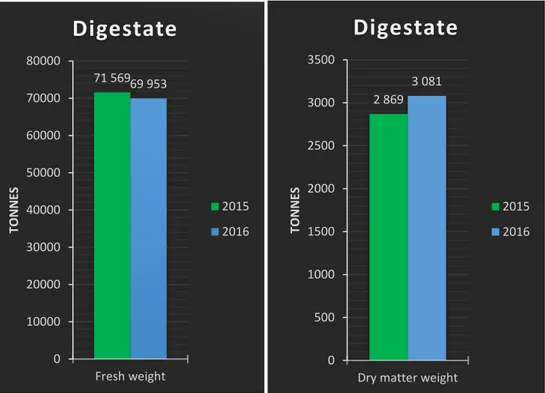
Both the fresh and dry matter weight of digestate going out showed similar varia-tions between time periods and they seemed to follow the ups and downs of the incoming substrates (Fig. 3 and 4). The total fresh weight of digestate going out from VH Biogas was slightly higher in 2015 than in 2016 (Fig. 7) whereas the dry matter weight was lower (Fig. 8). This indicates a lower dry matter percentage in the digestate that was produced in 2015.
6 624 5 593 0 1000 2000 3000 4000 5000 6000 7000 TON N ES
Substrate
2015 2016 73 013 70 928 0 10000 20000 30000 40000 50000 60000 70000 80000 TON N ESSubstrate
2015 2016Figure 5. The total fresh weight of all substrates de-livered to VH Biogas plant per year.
Figure 6. The total dry matter weight of all sub-strates delivered to VH Biogas plant per year.
71 56969 953 0 10000 20000 30000 40000 50000 60000 70000 80000 TON N ES
Digestate
2015 2016 2 869 3 081 0 500 1000 1500 2000 2500 3000 3500 TON N ESDigestate
2015 2016Figure 8. The total fresh weight of all digestate going out from VH Biogas plant per year.
Figure 7 The total dry matter weight of all diges-tate going out from VH Biogas plant per year.
3.2 Type of farm/company
3.2.1 Substrate
The different types of farms/companies were divided into groups as described in the methods. The types that stood for the greatest part of the fresh- and dry matter weights as well as most of the plant nutrients were the conventional and organic dairy farms, the conventional pig farms and slaughter residues (Fig. 9-15).
The organic dairy farms were the biggest contributor in all of the categories that was studied, except for phosphorous (Fig. 13) where both slaughter residues and conventional dairy farms delivered more to VH Biogas plant. Organic dairy farms delivered relatively little nitrogen (Fig. 10-12) compared to the fresh weight deliv-ered by them. Contrarily, they contributed with a huge amount of potassium (Fig. 14).
The conventional dairy farms were the second largest deliverer of fresh weight to the plant (Fig. 9), and they delivered a relatively larger share of the nitrogen com-pared to the organic dairy farms when comcom-pared with the fresh weight (Fig. 10-12), indicating that the manure from the conventional dairy farms have got a higher con-centration of N in it compared to the organic dairy farms. In terms of weight, they were the second largest deliverer of NH4-N (Fig. 12) and the third largest deliverer of organic N (Fig. 11). The conventional dairy farms also delivered the second most P, after slaughter residues, (Fig. 13) and K, after organic dairy farms, (Fig.14). The amount of P delivered by the organic and conventional dairy farms respectively was fairly similar whereas the K delivered from the conventional dairy farms was lower than the organic dairy farms, indicating that the manure from the organic dairy con-tained more K than the manure from conventional dairy. The conventional dairy farms deliver the second most dry matter to VH Biogas (Fig. 15)
The pig farms delivered the third most fresh weight of substrate to VH Biogas, but it was significantly less than both types of dairy farms (Fig. 9). The pig farms stood out since they delivered almost 18 % of the total NH4-N (Fig. 12) even though the total N they delivered only represented 11.63 % of the N delivered to VH Biogas (Fig. 10). The pig farms delivered only 6.8 % of the organic N and thus, the pig manure has a higher NH4-N/N-tot quota and contributed to an increased amount of NH4-N in the digestate. The pig farms’ deliverance of P (Fig. 13) and K (Fig. 14) was relatively low compared to the dairy farms. The dry matter weight delivered from the pig farms was under 7 % (Fig. 15)
Amongst the types of farms and companies that delivered substrate without re-ceiving digestate, the biggest ones in terms of fresh weight were slaughter residues and other. The other category seems to contribute with a miniscule amount of plant nutrients (Fig. 10-14). However, this was due to the fact that most of the nutrient analyses were missing from the raw data used in this study and the share that the other category contributed with is therefore unknown. Though it was likely a little bit higher than what is shown in figures 10-13 because the unknown data was set to 0.
Slaughter residues were only 9 % of the total fresh weight (Fig. 9) but stood for 20 % of the total N (Fig. 10). However, the overwhelming part of the N was organic (Fig. 11-12). Seemingly, the slaughter residues greatly boosted the total N-content of the digestate. Slaughter residues was also the biggest contributor of P out of all types of farms/companies (Fig. 13) whereas the contribution of K was minimal (Fig. 14). The slaughter residues were also a major contributor of dry matter weight at almost 15 % of the total (Fig. 15).
The poultry farms delivered only approximately 1% of the fresh weight (Fig. 9) but stood for over 4 % of the total NH4-N in the substrates (Fig. 12) and 3.6 % of the total N (Fig. 10) which indicates its value for the plant nutrient content of the digestate. It was also a significant contributor of P at almost 5 % of the total in the substrates (Fig. 13). The contribution of K was not as great at just over 2 % of the total (Fig. 14) and the dry matter weight from the poultry manure stood for 5.4 % of the total (Fig. 15).
The total weight in substrates of N-tot (Fig. 10) is 649.1 tonnes and the total weight in substrates of N-org (Fig. 11) plus NH4-N(Fig. 12) was
336.0 + 249.5 = 585.5 tonnes. The discrepancy was due to some analyses not specifying in what form the N was present. Thus, the pie charts shown in Fig. 11 and Fig. 12 might be slightly skewed.
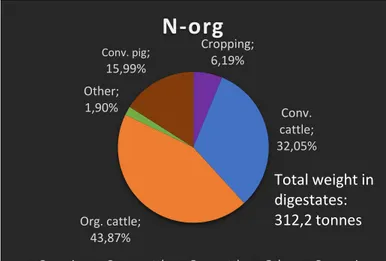
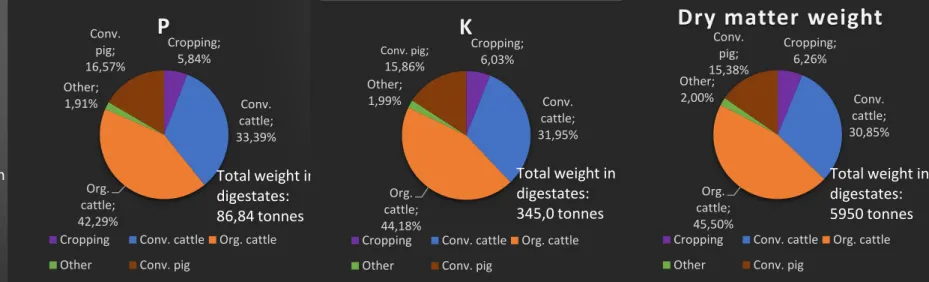
3.2.2 Digestate
The share was very similar between each plant nutrient as well as the fresh and dry matter weight that was delivered to the receivers (Fig. 16-22). This was because the digestate was relatively homogenous and that the receivers got digestate in relation to how much substrate they delivered.
The different receivers got approximately the following percentages of the weight and nutrients in the digestate (Fig. 16-22):
o Organic dairy – 43 % o Conventional dairy – 32 % o Pig – 16 %
o Cropping – 6 % o Other – 2 %
Substrate
Conv. cattle; 30,79%
Org. cattle; 37,18% Slaughter residues;
9,01% Food waste; 1,51%Fats; 1,14%
Other; 5,47% Poultry; 1,19%
Conv. pig; 13,70%
Fresh weight
Conv. cattle Org. cattle Slaughter residues Food waste Fats Other Poultry Conv. pig Total weight of substrates: 143900 tonnes Conv. cattle; 29,68% Org. cattle; 31,65% Slaughter residues; 20,21% Food waste; 0,97%Fats; 1,82%
Other; 0,43% Poultry; 3,60%
Conv. pig; 11,63%
N-tot
Conv. cattle Org. cattle Slaughter residues Food waste Fats Other Poultry Conv. pig Total weight in substrates: 649,1 tonnes
Conv. cattle; 28,54% Org. cattle; 29,31% Slaughter residues; 28,58% Fats; 3,02%Other; 0,72% Poultry; 3,01% Conv. pig; 6,82%
N-org
Conv. cattle Org. cattle Slaughter residues Food waste Fats Other Poultry Conv. pig Total weight in substrates: 336,0 tonnes Conv. cattle; 33,08% Org. cattle; 36,57% Slaughter residues; 7,09% Fats; 0,59% Other; 0,14% Poultry; 4,54% Conv. pig; 17,98%
NH4
Conv. cattle Org. cattle Slaughter residues Food waste Fats Other Poultry Conv. pig Total weight in substrates: 249,5 tonnes
Conv. cattle; 24,40% Org. cattle; 23,35% Slaughter residues; 29,57% Food waste; 4,09% Fats; 0,10% Other; 2,70% Poultry; 4,98% Conv. pig; 10,82%
P
Conv. cattle Org. cattle Slaughter residues Food waste Fats Other Poultry Conv. pig Total weight in substrates: 159,1 tonnes Conv. cattle; 36,32% Org. cattle; 49,67% Slaughter residues; 1,96% Fats; 0,03% Other; 1,82% Poultry; 2,24% Conv. pig; 7,97%
K
Conv. cattle Org. cattle Slaughter residues Food waste Fats Other Poultry Conv. pig Total weight in substrates: 444,2 tonnes
Conv. cattle; 28,75% Org. cattle; 33,27% Slaughter residues; 14,89% Food waste; 2,06% Fats; 1,60% Other; 7,22% Poultry; 5,40% Conv. pig; 6,81%
Dry matter weight
Conv. cattle Org. cattle Slaughter residues Food waste Fats Other Poultry Conv. pig Total weight in substrates: 12210 tonnes
Digestate Cropping; 5,84% Conv. cattle; 33,40% Org. cattle; 42,28% Other; 1,92% Conv. pig; 16,56%
Fresh weight
Cropping Conv. cattle Org. cattle Other Conv. pig Total weight of digestates: 141500 tonnes Cropping; 5,96% Conv. cattle; 32,89% Org. cattle; 42,90% Other; 1,92% Conv. pig; 16,34%
N-tot
Cropping Conv. cattle Org. cattle Other Conv. pig Total weight in digestates: 585,1 tonnes Cropping; 6,19% Conv. cattle; 32,05% Org. cattle; 43,87% Other; 1,90% Conv. pig; 15,99%
N-org
Cropping Conv. cattle Org. cattle Other Conv. pig Total weight in digestates: 312,2 tonnes
Figure 16. Pie chart showing the share of the total fresh weight of diges-tate produced by VH Biogas, by each type of receiver. The data is taken from 2015 and 2016.
Figure 17. Pie chart showing the share of the total N in all digestate produced by VH Biogas, by each type of receiver. The data is taken from 2015 and 2016.
Figure 18. Pie chart showing the share of the total amount of N-org in all digestate produced by VH Biogas, by each type of receiver. The data is taken from 2015 and 2016.
Cropping; 5,69% Conv. cattle; 33,83% Org. cattle; 41,79% Other; 1,94% Conv. pig; 16,75%
NH4
Cropping Conv. cattle Org. cattle Other Conv. pig
Total weight in digestates: 273,0 tonnes Cropping; 5,84% Conv. cattle; 33,39% Org. cattle; 42,29% Other; 1,91% Conv. pig; 16,57%
P
Cropping Conv. cattle Org. cattle Other Conv. pig
Total weight in digestates: 86,84 tonnes
Figure 19. Pie chart showing the share of the total amount of NH4 in all digestate produced by VH Biogas, by each type of receiver. The data is taken from 2015 and 2016.
Figure 20. Pie chart showing the share of the total amount of P in all digestate produced by VH Biogas, by each type of receiver. The data is taken from 2015 and 2016. Cropping; 6,03% Conv. cattle; 31,95% Org. cattle; 44,18% Other; 1,99% Conv. pig; 15,86%
K
Cropping Conv. cattle Org. cattle Other Conv. pig
Total weight in digestates: 345,0 tonnes Cropping; 6,26% Conv. cattle; 30,85% Org. cattle; 45,50% Other; 2,00% Conv. pig; 15,38%
Dry matter weight
Cropping Conv. cattle Org. cattle Other Conv. pig
Total weight in digestates: 5950 tonnes
Figure 21. Pie chart showing the share of the total amount of K in all digestate produced by VH Biogas, by each type of receiver. The data is taken from 2015 and 2016.
Figure 22. Pie chart showing the share of total dry mat-ter weight of all digestate produced by VH Biogas, by each type of receiver. The data is taken from 2015 and 2016.
3.3 Digestate-substrate difference for type of
deliverer/receiver
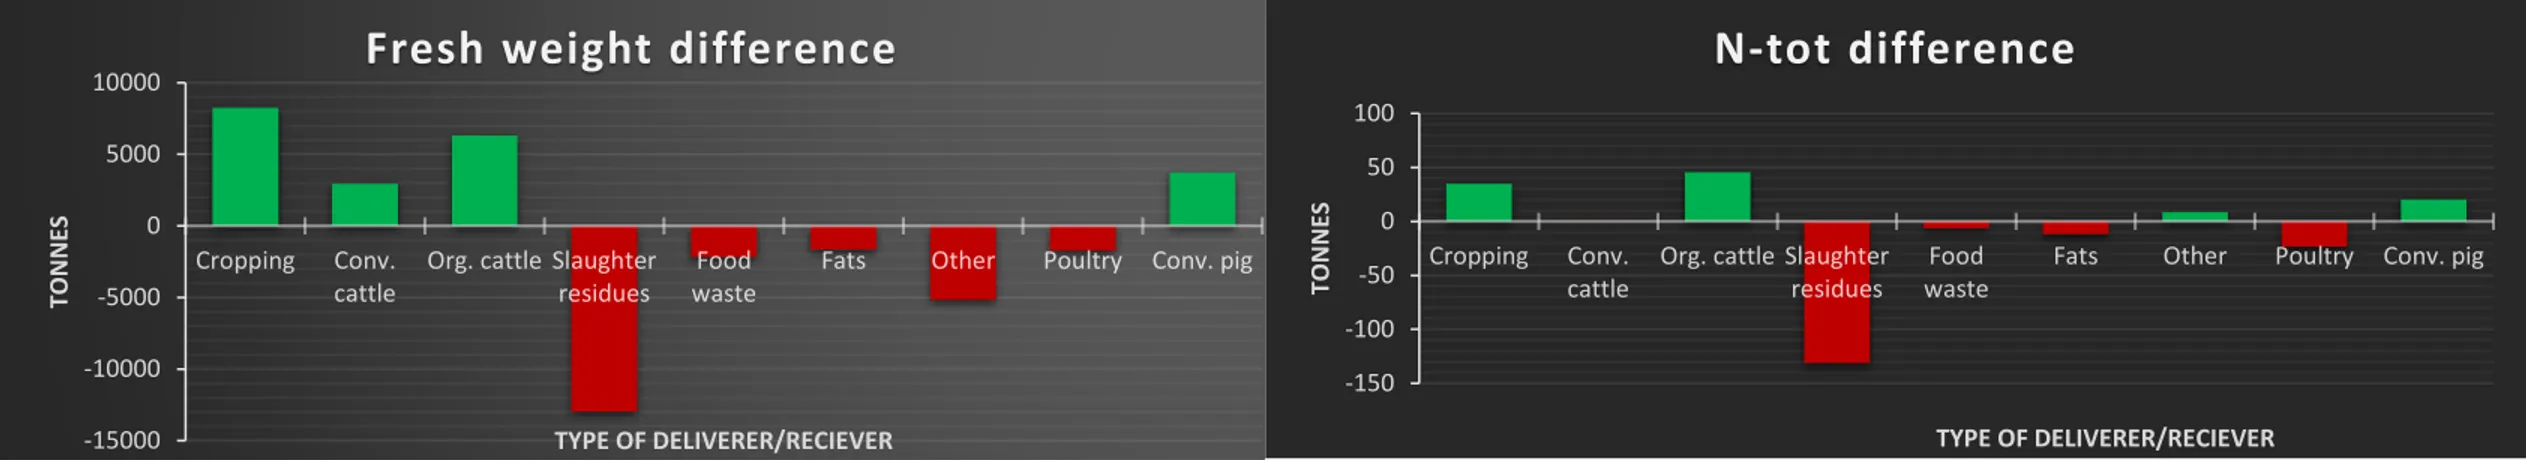
Diagrams with only the dairy and pig farms can be found in appendix. According to Fig. 28, there was a net loss of K when considering all types of deliverers and re-ceivers.
Cropping: The cropping farms that only received digestate without delivering
substrate had a net gain of all plant nutrients, fresh and dry matter weight (Fig. 23-29).
Conventional dairy: The conventional dairy farms received more fresh weight
than they delivered, as did the other types of farms that both delivered substrate and received digestate (Fig. 23). This was due to that the total fresh weight of the diges-tate was higher than the total fresh weight of the substrates and that there were more groups delivering substrates than there were groups receiving digestate. Conven-tional dairy farms as a group had a slight net loss of total N (Fig. 24), which was caused by the net loss of NH4-N that was found (Fig. 26) but offset a bit by the net gain of N-org (Fig. 25). Conventional dairy farms also had a net loss of P (Fig. 27), K (Fig. 28) and dry matter weight (Fig. 29).
Organic dairy: The organic dairy farms as a whole had a significant net gain of
fresh weight (Fig. 23), N-tot (Fig. 24), N-org (Fig. 25) and NH4-N (Fig. 26). They had an obvious net loss of K (Fig. 28) and dry matter weight (Fig. 29), and a slight net loss of P (Fig.27). This supported what the interviewed farmer said, as he de-scribed the digestate positively in terms of plant nutrients (mainly for the high con-tent of mineral N) but expressed some worries about feeling like he was losing P and K. He also commented that he thinks the dairy farms needed the K, whereas the pig farms did not.
Pig: The pig farms had a net gain of fresh weight (Fig. 23), tot (Fig. 24),
N-org (Fig. 25), K (Fig. 28) and dry matter weight (Fig. 29). They were the only type of farm that both delivered substrate and received digestate that had a net gain of K. The pig farms had a net loss of NH4-N (Fig. 26) and P (Fig. 27). It was worth noting the big difference between the gain of N-org and the loss of NH4-N, which indicates a high NH4-N/N-tot quota in the substrate delivered from the pig farms. Another interesting result is that the pig farms gained dry matter weight, and thus the dry matter percentage in the substrate delivered ought to have been lower than the dairy farms.
Other: The figures were not accurate for the “other” group except for fresh
weight (Fig. 23), since many analyses were missing for plant nutrients. It is likely that the slight net gains in N-tot (Fig. 24), N-org (Fig. 25) and NH4-N (Fig. 26) were
in reality slight net losses because the missing values from the analyses were set to 0. Within the same argument, the net losses in P (Fig. 27), K (Fig. 28) and dry matter weight (Fig. 29) were likely higher in reality than what was showed in these results.
Deliverers of substrate only: The types of farms/companies that delivered
sub-strate without receiving digestate (slaughter residues, food waste, fats and poultry), all displayed net losses of all plant nutrients, fresh weight and dry matter weight (Fig. 23-29). Out of these types, slaughter residues had the greatest net loss of fresh weight, dry matter weight and all nutrients (Fig. 23-27 and 29) except K where they were second behind poultry (Fig. 28). In regard to plant nutrients, the other types apart from slaughter residues were not very large contributors except for poultry, which displayed a marked net loss of NH4-N (Fig. 26) and dry matter weight (Fig. 29) as well as some P (Fig. 27) and K (Fig. 28).
Figure 23. Diagram showing, for each type of deliverer/reciever, the difference between the amount of digestate (in fresh weight) received from VH Biogas minus the amount of substrate (in fresh weight) delivered to VH Biogas. The data is taken from 2015 and 2016.
Figure 26. Diagram showing, for each type of deliverer/receiver, the difference between the total amount of N re-ceived from VH Biogas minus the total amount of N delivered to VH Biogas. The data is taken from 2015 and 2016.
-15000 -10000 -5000 0 5000 10000 TON N ES TYPE OF DELIVERER/RECIEVER
Fresh weight difference
-150 -100 -50 0 50 100 TON N ES TYPE OF DELIVERER/RECIEVER
N-tot difference
-150 -100 -50 0 50 TON N ESN-org difference
-30 -20 -10 0 10 20 TON N ESNH4 difference
Figure 29. Diagram showing, for each type of deliverer/receiver, the difference between the amount of P received from VH Biogas minus the amount of P delivered to VH Biogas. The data is taken from 2015 and 2016.
Figure 28. Diagram showing, for each type of deliverer/receiver, the difference between the amount of K received from VH Biogas minus the amount of K delivered to VH Biogas. The data is taken from 2015 and 2016.
-60 -40 -20 0 20 TON N ES TYPE OF DELIVERER/RECIEVER