Teknik och samhälle
Datavetenskap
Examensarbete
15 högskolepoäng, grundnivå
Web Application for Modeling and Simulation
Webbapplikation för Modellering och Simulering
SIMON BERGGREN
Web Application for Modeling and Simulation
Simon Berggren
Faculty of Technology and Society Malmö University
Malmö, Sweden
Simon.andre.berggren@gmail.com
Abstract— Humans often use graphs, diagrams and 3D-models to
visualize complex systems, in order to comprehend them better. While this kind of software does exist, it is not easily accessible via mobile devices. This thesis will explore and explain the design process of developing a web application for visualizing and creating complex systems, natively supporting handheld devices. The innovative nature of this thesis calls for a suiting research process, which we will describe together with what design decisions led to satisfying functionality.
Keywords— modeling; simulation; mobile; web application
1. INTRODUCTION
The human mind is ill-equipped for comprehending and assessing complex systems and dynamic processes. Many of today’s dynamic systems, such as vehicles, aircrafts and bridges, are too complex for us to fully grasp and understand (Bossel et al., 1994). Because graphical visualization gives us better understanding than showing textual descriptions (Schulze et al., 2014), we often use graphs, diagrams, 3D-models and simulations to better understand these complex systems.
Carson et al. states that visual representations help us, not only by understanding these complex systems better, but also allowing more natural and concrete thinking by removing the need of having to mentally decompose systems into smaller components. By minimizing abstract thinking, fewer errors are made, leading to a more productive development process (Carson et al., 2005).
This paper reports on design science research in close collaboration with a company working with software for modeling and simulation of dynamic systems. The company has identified a need of a tool to help create and edit models, diagrams and graphs of dynamic systems. Similar software for creating visual representations are available1, but they are more restricted as they require downloading, installation and configuration on a computer. Examples of these programs are described and discussed in section 2, Related Work.
The following scenario gives further background to this thesis: Imagine a future where you are sitting in your self-driving car on your way from work. You are thinking of today’s work, getting new ideas to a current project involving modelling. You want to test a simulation or make a quick
1 OnShape, Dymola, Playmola (Elmqvist et al., 2015)
change to an existing model from the only device you have accessible from the driver seat: your smart phone. In order to solve the scenario problem for many different kinds of devices, the solution needs to be a web application.
Making the application available from the web, as well as supporting handheld devices, would help making modeling and simulation more accessible. While making it easier for people to access and use the application, it is important that the design is thoroughly tested and user-friendly to relevant users. The design decisions we will investigate are not focused on the visual aspect, but rather on the functional aspect; what functionality and behavior are users expecting of a web application of this sort?
This paper describes the development of a tool with higher accessibility and responsiveness, aiming at being able to run from any platform, anywhere, at any time. If a tool can help responding to changes more rapidly, it would in a sense also increase the productivity at a company because of the decreasing time it takes to integrate the change. Furthermore, it enables easier presentations of what is being built, giving stakeholders a better overview of current status and progress of the product.
The method used in this paper, discussed in section 2, is based on an iterative research process, while focusing on the development of an artifact. To further be able to focus on developing the artifact and its’ design decisions, we used the algorithm Klay JS (Schulze, 2014), as a tool for automatic graph layout. It calculates the positioning of components and routing connections between them. Icons used to represent the components in diagrams are from the Modelica Libraries, a collection of about 30 image libraries, visualizing components of different categories such as electronic, mechanical, magnetic and fluid components (Modelica Libraries, 2017).
2. RELATEDWORK
Because this paper explores the development process of designing feature, and the problem is based on the needs identified by a company, the related works are based on applications solving similar issues. These tools’ functionalities are compared and explained, regarding why they do not satisfy the identified needs.
OnShape is a similar web application, build with cloud based functionality in mind. It is focused on 3D modelling,
without the diagram view and thus not satisfying the needs of the company as they require both modes.
Dymola is payment-based computer software supporting both diagram and 3D views, as well as simulation and animation. Because there is no support for mobile devices, it does not solve the problem.
Playmola is a gamified physics tool, built as a web application. It is possible to build 3D models, as well as simulate physics and animate the models in the environment. However, the Application lacks the ability to build 2D models, and the gamified approach taken makes the application feel less professional and is therefore not what the company seeks.
3. LIMITATIONS
This thesis explores the innovative nature of web development, making limitations harder to define. The limitations should not be made in order to constrain the application, but rather to define what may not be possible to handle regarding interaction. It is for instance not possible to bind actions to the keyboard of a mobile device as it is not always displaying.
Another limitation would be the small screen and the graphical capabilities; it is not possible to display as advanced and heavy graphics as on a PC. This means that large systems with many components or a complex 3D visualization may be difficult to display on a mobile device.
4. METHOD
In a paper by Hevner et al., design science research (DSR) is described as research seeking to extend the boundaries and organizational capabilities by creating new and innovative artifacts (Hevner et al., 2004). It also suggests a way of conducting, evaluating and presenting design science research via a set of guidelines, while focusing on designing and developing an artifact. However, Peffers et al. argues that even though Hevner et al. successfully integrated design as a major component of research, little design science research was consequently published (Peffers et al., 2006).
According to Peffers et al., the DSR presented by Hevner et al. was lacking models, or templates rather, for researchers, readers and reviewers; a conceptual model for researchers, displaying how to conduct design science as a research method, as well as a mental model for the readers and reviewers, displaying how to recognize the DSR as well as how to evaluate it.
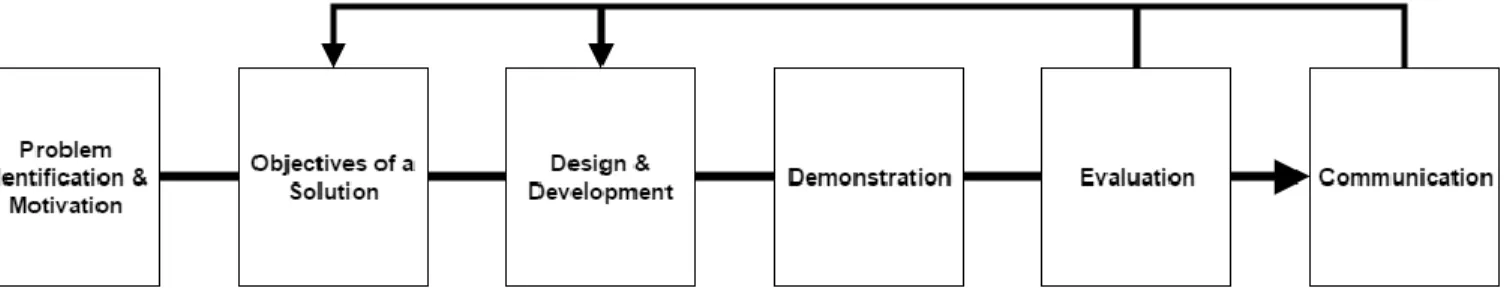
Hoping to further clarify the DSR, as well as provide a formal process for conducting DSR, Peffers et al. presented a model (See figure 1), by extracting common elements among 7 representative papers following the DSR guidelines.
Figure 1: The Design Science Research Process developed by Peffers et at. (2006)
4.1. THE DESIGN RESEARCH MODEL
As every paper examined by Peffers et al. initialized their research by identifying and defining a research problem through various processes, and as suggested by Hevner et al., Problem Identification & Motivation is a natural first stage of the Design Science Research Model. Also noted, was that researchers sometimes explicitly converted the research problem into a set of objectives, as well as discussing a final solution as part of the initial stages of the research. However, this conversion was implicit in the guideline proposed by Hevner et al.
Design & Development was, as Problem Identification & Motivation, a component shared by all researchers, as this is the core of Design Science. The output from Design & Development varied. One group of researchers demonstrated their artifact, while a second group chose a more formal evaluation, as well as a third group both demonstrating and evaluating. As most research output some kind of knowledge,
both Hevner et al. and Peffers et al. suggested the need of communicating results.
After an analysis of the Design Science Research Model Gross et al. concluded that the original model was not optimal for their research. Because their development process was conducted on-site at a company, they considered it “more practical to incorporate the Design & development, and Evaluation phases with the Demonstration phase”, see figure 2. Because they have continuous access to feedback, allowing them to demonstrate more often and in a larger scale, as well as their choice to work in iterative sprints, the Design & Development and Evaluation is included within the Demonstration context
Our situation was similar to Gross et al., though the research (i.e. the development of the artifact) was not conducted on site at the company. The company requesting this artifact was highly involved with the process and daily contact with the project manager was established. The daily testing of new features and feedback sessions, led to small and quick iterations, almost instantaneous responds to changes,
equivalent to Gross et al. constant access to feedback. One important aspect of this comparison is that all testing was not supervised; it was not always possible to observe how the tester interacted with the application. To approach this, we used tools for screen-sharing (TeamViewer, 2017) and VoIP (Skype, 2017).
We expected frequent changes to this research’s objectives and the artifact’s design, because of the continuously heavy testing and feedback loop with the company. Design decisions taken during development may not align with the company’s view of a solution. Potential recurring adjustments, as well as
the fact that agile processes handle change well (McConnel, 2009), led to this agile approach.
Additionally, this format is similar to the format developed by Gross et al. as they followed a structure of sprints, helping them with planning and prioritization. Noteworthy is that their design and evaluation iterations did not actually follow these sprints. In fact, their design issues were iterated when they felt it necessary.
Figure 2: The Design Science Research Process developed by (Peffers et at., 2006), modified by (Gross et al., 2012).
Evaluation data was collected from both formal and informal, unsupervised testing. Formal testing was conducted in a way where the tester was assigned a specific task, observed while performing the assignment, and later questioned about their experience using the application and potential ideas for improvement. Tasks assigned depended on what needed testing. Initial test sessions were primarily focused on trivial matters such as camera controls and the general workflow of the application. Informal testing was simply letting the tester use the prototype to do whatever they want, letting them discover and use features by themselves. This testing structure led to continuous and thorough quality assurance.
The geography situation of this paper made it difficult to have formal test sessions over some periods, leading to additional informal and unsupervised testing needing to be an alternative. This means that the tester instead communicated their experience and any suggestions of improvement.
Because collected feedback was controlling the general heading of the prototype, it was analyzed by writing down bullet points on what the tester was satisfied with, and what they proposed to develop during next iteration. Current status of the application, i.e. how satisfying the features were to the user, together with the amount of time it would take to implement a feature, decided what to focus on next during development. Observed tests gave the opportunity for us to notice small missing features, such as shortcuts or controls, often overlooked by the user because they had a specific task to perform.
5. PROTOTYPE
The prototype is a web-application, developed using WebGL (Web Graphics Library) together with a JavaScript-library called Three JS. Its’ main use is to create, edit and display models of systems and diagrams. It is presented in a 3D virtual environment, because it enables the user to
simultaneously display different models or parts of a greater complex system, as can be seen in Figure 3.
Three JS provides a JavaScript interface for WebGL. It contains a custom class hierarchy to more easily create a 3D scene containing visible objects and lights. The objects in a scene can easily be manipulated, in the sense of changing properties such as scale, position or color. Three JS also allows loading and displaying of 3D-models by parsing existing models in well-known formats such as json and obj.
Figure 3. A model representing a four poster designed for testing vehicles, simulating the surface of the road and the forces exerted on the wheels.
6. DESIGN PROCESS
Design decisions taken has been carefully considered and discussed because of the weight of wrongly taken decisions, i.e. the weight of wasting time on designing and implementing features that is not wanted. Initial design decisions were taken, i.e. design that was tested and evaluated first, was taken according to literature as well as personal experiences and preferences (Bossel, 1994). This section will describe the iterative process, mentioned in section 3. Design decisions taken will also be examined and explained.
6.1. CAMERA
The first and foremost design decision was what type of camera we want to use. The goal of the prototype is to encourage creativity and make a natural environment. An orthographic camera view would display 2D-models well, as it does not affect the size of objects based on their distance to the viewer. A camera using a projection view would give a more natural look to the scene, as well as allowing more complex, hierarchical solutions.
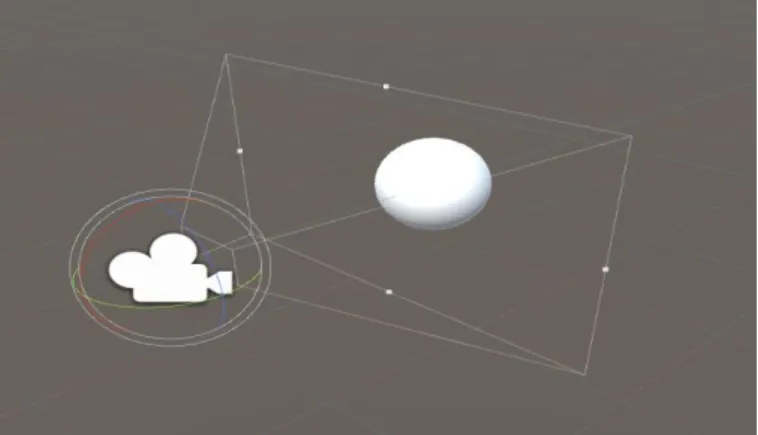
Because the application’s purpose is to make modeling and representations of complex systems easier, and the diagrams and models is presented in a virtual environment in 3D perspective, an important part of the design process was developing and testing intuitive camera controls. It is important that the controls is not a distraction and frustration to the user, making him focus on how to navigate instead of being productive. The first camera design decision was taken with our own preferences in mind, developing a camera that is controlled by using both keyboard and mouse, typical for movement in games and general 3D environments (Christie et al., 2008), (Janowski et al., 2014). This type of controllers is visualized in Figure 4. This design decision also made great sense, as the environment was intended to resemble a workshop where the user could move and look around, while feeling as they are in a productive environment.
Figure 4. Representing the point where the camera rotates around. This can be viewed as a first-person camera, meaning rotation is around the camera itself.
Although testing quickly proved that the controls was not as intuitive as we believed. The tester reported that he became disoriented and feeling as though he did not have control over what was happening to the camera or in the scene. This was due to the way the camera rotated, enabling it to rotate around the z-axis which, for humans, translates to leaning the head on a shoulder. Feeling like not being in control can hinder development, as is mentioned by (Bossel, 1994).
Further observations however, still showed that the user was not accustomed to the way the camera moved and rotated, and therefore not using the controls as intended. Only the mouse and scroll-button was used to navigate, making it hard to move around naturally in the scene. Because this was far from the intended use, the camera controls was completely overhauled. The new design, which can be seen in Figure 5, was inspired by the controls used in another editor already used
and understood by the tester. The redesigned camera orbits around a point of the scene, as well as allowing panning in 2D, i.e. moving horizontally and vertically around the scene. It also allows the traditional dollying, i.e. moving along the camera’s line of sight, which can be compared with zooming in and out. These controls also allow the user to easier focus on individual parts or areas in the scene, by panning the camera and then orbit around the specific part (Tan, 2001).
Figure 5. Representing camera orbit controls. Rotation now occurs around a point, at which the camera always is facing.
Additional feedback was gathered, which would result in making the camera static, giving it a fixed position and rotation. Instead, the user would rotate and move the actual objects in the scene. The reason to this is because of the directional light in the scene, making the objects appear different and misrepresented in different camera angles, visualized when comparing Figure 6 and 7. Another solution would simply be to have more lights in different angles.
Figure 6. A model representing how pistons work and move in a V6-engine. Together with animation, this is a quick and easy way to explain how parts of a V6-engine works.
Figure 7. Displaying the rear view of a model of cylinders in a V6-engine, making it harder to distinguish the depth and structure of the model.
6.1.1. MOBILE
Support for mobile devices was always considered, however we first wanted to establish what type of camera controls was best fitting. When the orbit controls were tested and satisfied the users, we configured the controls to support mobile devices. The camera’s three types of controls, orbiting, panning and zooming, was controlled by dragging one, two or three fingers across the scene. Making a pinching gesture, i.e. moving two fingers, is generally considered a zoom operation, making the testing focus on the other two operations. The users felt that one finger would make the camera pan in 2D, thus leaving three fingers to control rotation. Accidental screen touches also proved to be easier to handle with one finger controlling panning, as it was easier for the user to reset the positioning of the camera rather than the rotation.
When developing for mobile environments, a big issue can be the small screen space, as well as the lack of a keyboard allowing shortcuts (Bossel, 1994). One issue caused by the small screen is the way the application handles picking (selection of components or connections). The technique used to select components is called ray casting, which creates an invisible ray from the position on which the user has clicked, towards the camera’s facing direction. This way we can easily tell which objects the user has clicked on. Ray casting works well when the user has a cursor to aim with. With mobile devices, there are no cursors and no indication of where the user is about to click, other than the following action depending on the point where the user touched the screen. In our case, a miss with a mobile device would not only mean that the intended action was not performed, but should the user also not hit any object in the scene at all, any selected component will be deselected. A possible solution to this would be to require a double-tap on an empty area to deselect objects.
6.2. DIAGRAM
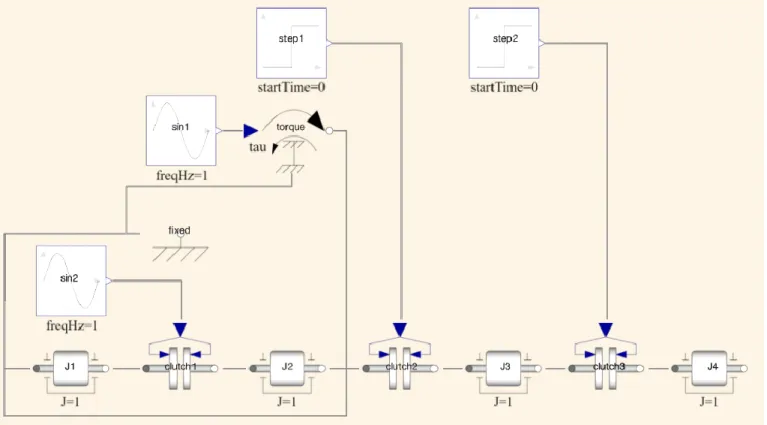
The next steps of the process involved some of the application’s most fundamental mechanics: to generate a visual representation of a given diagram. This is divided in several parts, due to the diverse design and development complexity of each part. In figure 8 and 9 respectively, you see a scene where we display components and their associated visualization (i.e. their icon), as well as the lines between them representing the connections.
For displaying a diagram, a powerful layout algorithm named Klay JS is used as tool, taking diagrams without positioning as input, returning diagram with positioned components and routed connections. This led to additional focus could be spent on design and development of the actual editing features, instead of generating a viable layout for diagrams. Important development iterations was displaying the output of the algorithm, as well as making the components compatible with the required object notation used by the graphical library.
Making the application able to handle editing of existing diagrams is very important, because of the (often) dynamic nature of development and modelling. The possible ways of editing a diagram is many, leading to certain features being implemented and tested prior to other. The supported editing features includes transforming, cloning, deleting and coupling components and the prioritization order of these features was based on how important they were to the application and company needs. Their development process will be further explained below.
Figure 9. Displays a recalculated model version of Figure 7, when J1 and fixed is connected and repositioned.
6.2.1. TRANSFORMING
Transforming components and models were found to be the most needed feature to be implemented. When presenting a diagram during testing; dragging, rotating and scaling components were the first thing many tried. Initial design decisions regarding translation included how to select a component and how to translate, without much mobile support in mind. A simple external library, developed to more easily handle translation in THREE JS was used and configured to fit the needs of this prototype. Configurations made to the library regarded which axis the user was able to translate components in. Allowing translation on all axes brought some irritation to some users at first because they accidentally moved the component along the z-axis. It was made clear this could not be featured while viewing diagrams and we created a modified version of the library without the possibility to move along the z-axis.
6.2.2. CONNECTING COMPONENTS
To understand the idea of connecting components, we explain the meaning of a port; A port is a part of a component or a subsystem where different forms of data can flow, such as power or voltage. Each component or subsystem can, through one of their ports, be connected to another component or subsystem (Karnopp et al., 2000). Creating a connection between two components (couple) was one of the last stages during development, and proved to be a challenge to design and develop. Simply making a connection was not the issue, but making the process natural and intuitive for both computer and mobile usage was. Because the company previously worked much with computer software, their idea of connecting
included click and drag. This however made the mobile controls hard to grasp. Touch and drag on mobile could potentially mean two operations; transforming the component or moving the camera. If the touched point misses a component, the camera starts moving along the finger movement, causing distractions to the user. Therefore, we created a coupling process which starts with tapping on a port of the selected component, simultaneously clearly displaying all available ports in the diagram. When the user then taps on one of the now visible ports, a connection is made. This would make most sense for mobile devices. To keep consistency, we implemented this feature across all platforms.
6.2.3. AUTOMATIC AND MANUAL MODE
When working with automatic layout algorithms, small changes to the system being presented can cause a complete readjustment of positions and layout, confusing the user (Misue, K et al., 1995). Comparing the difference of Figure 8 and Figure 9, the only technical difference between them is a new connection between “J1” and “fixed” which can be found in the leftmost part of the figure. The visual difference however is substantial, meaning that should users experience this sudden change in visualization, as also was proved during testing, their own mental representation of the system would become inaccurate. This would make the user spend additional time on recreating their understanding of the visualization, thus slowing down development.
Manual mode means that the application simply ignores the automatic layout step, letting the user work as they want. Components can be moved around, with the connections following them. Being able to switch between these two modes
was a desired when the user made changes to a diagram, such as connecting or moving components, in a way that made it less understandable.
6.3. MODELLING AND ANIMATION
Modelling not only includes diagrams in its data representation. For displaying complex systems, 3D-models were also used, built in various formats, parsed by Three JS. 3D-models are used together with animation, bringing additional concrete visual representation of complex systems, such as how their different parts moves and work together. This allows us to see changes in real time, making it easier to comprehend additional or modified data. Simulating a movement or process on a model may also broaden the audience which benefit from this prototype, because it gives the user another view of the system. It can also open and broaden the viewer’s perspective, allowing them to think about a problem in a different way (Schulze, 2014).
6.4. FEATURE SUMMARY
In this section, we will describe the final prototype and what features it involves.
The development has focused on user experience, and implementing features that the collaborating company requests. We started with camera controls, as they must feel natural and intuitive in a 3D environment, or any tool, to not cause distractions. The resulting controls is a camera that orbits around an objects, while still allowing panning, i.e. movement along the x- and y-axis only. It can be controlled with both mouse, using two buttons and scroll, as well as with a touch device, utilizing different number of fingers for different operations.
Diagrams need to exist in predefined json-files. If automatic mode is selected, diagrams are parsed by the algorithm Klay JS which automatically calculates the positions and routes the connections. Should manual mode instead be selected, the web application simply reads the file contents and displays the diagram accordingly.
The operations available on components within a diagram are: selecting, translating, rotating, scaling, connecting, cloning and deleting. They are bound to keyboard shortcuts for a more natural experience on a PC, but as mobile devices to not have this option, the operations are also available through buttons on the webpage.
3D models can be displayed through the visualization mode. That mode takes advantage of Three JS’s parsers of common object notations such as json or obj. Animation data can either be part of the file, or loaded separately. The controls of animations include, but are not limited to; playing, pausing, and changing the speed of the animation.
7. CONCLUSION
This paper has explored and explained the development of an application for modelling and simulating complex systems. To properly address the problems defined in section 1, we have used a research model designed for enabling more time to be spent on developing an artifact. Thus, this paper is focused on
the design and evaluation process, and we consider the detailed description of the development process, taken design decisions and feedback received as part of our contribution.
Because the design of the prototype is so heavily dependent of user experience, continuous and thorough testing was required. Tests were conducted in formal and informal ways, where the formal testing is led by a specific set of tasks to be performed by the tester while being observed. Informal testing was unobserved tests, performed by the company as often as they could, supplying us with valuable information about what they thought and ideas on improvement.
During the continuous testing and evaluation, additional features and ideas of improvement were found. Because the development of the artifact will not end with this paper, further work was always considered and these ideas were written down as possible future development. An example on future work involves the ability to share a loaded model or diagram live with a specific URL, much like Google Drive functions today, making it easier to share work and visions in a team and thus also making communication easier. Being able to create components and form a diagram from scratch was highly requested, making it a priority during later development. This would also make manual mode more useful, enabling users to quickly make a diagram without thinking much about the layout, later sending it to the algorithm for positioning.
7.1. REFLECTION AND DISCUSSION
The goal of this prototype is to create a tool easily accessible from anywhere, using any device. That goal has been partially fulfilled, because of some constraints in Apple’s iOS making it unable to run on iOS devices. During the development of this prototype, we have realized that generalizing user experience is difficult. It is not simply a matter of making the tool more accessible and easy to use, it has to look appealing and inviting, while still being intuitive, easy and fun to use. Meeting these requirements means testing as much as possible, because of the wide variety in what people find important and relevant, what they are used to and thus looking for in a modelling tool.
The design science research model we followed puts emphasis on iteratively developing and demonstrating the artifact (Hevner et al., 2004, Peffers et al., 2006). The fact that much of this study was not always conducted on site at the company, made us think about testing more carefully. For example, demonstrating the prototype’s current status often needed a use case to be carried out in order to accurately test the newly implemented feature, or to make the user focus on what is relevant during the testing. The visual feedback provided by users during testing, such as where they click and what keys they press, were of more help compared to verbal feedback when developing camera and object controls. We believe this was the case because of our previous background in gaming - these types of controls are a recurring subject within game development. To simulate a formal test and keeping to the research model’s guidelines, we used screen sharing and VoIP communication. This also enabled us to take part of the use case process in a more participatory way. Because the company’s clear view of the product, verbal
feedback was of much help regarding design decisions of features involving more advanced features such as coupling.
The relationship between the server and the client is an important aspect with any web application. In our case, application was hosted by server hotel, Github Pages (Github Pages, 2017), thus removing our access to the server configuration. This way, we could focus on the client, and the user experience.
It is possible to argue for a custom server if the application would need to support a cloud file system, making existing models available directly from the web application. However, that would require more time to be spent on additional planning and development, as well as more security in order to block unauthorized user access. We chose to let the users provide the data.
A future server solution planned by the company is to enable compilation of Modelica. Modelica is an object-oriented modeling language, used to simulate complex systems. (Modelica, 2017). The compiler takes a given system built by the user, and plots the physics of the components, allowing real time simulation.
Gamification is defined as “a process of enhancing a service with affordances for gameful experiences in order to support user’s overall value creation” (Huotari, K et al., 2012). We came to realize that gamification has influenced the design because our background with developing and designing games and previous gamification prototypes. Some gaming features were transferred to this, more professional, web application. Features involved the camera controls, mainly when moving with keys and looking around with the mouse, typical for camera controls in games. Additional features unintentionally influenced by gamification is modelling and animation, in a way that entire environments could be loaded when viewing graphs or 3D models, such as a city with streets giving better visual context to a car simulation. This approach has also been taken in Playmola, a gamified physics tool (Baldwin et al., 2015).
7.2. FUTURE WORK
Because the exploratory and innovative nature of this thesis there exists numerous opportunities to further develop and extend the work.
One possibility could be to follow the example presented by Baldwin et. al. and compare the interface with similar software’s interfaces and examine their user experience (Baldwin et. al. 2015).
Another example would be to generalize the tool, meaning to analyze and support more complex and specialized graphs and diagrams, such as hierarchical coupling charts, state machines or class diagrams. Another example could be to further use the third dimension, for diagrams where the described system has a natural 3d-layout such as mechanical flow systems. Another extension made by 3d, is animating dynamic variables time behavior in a 2d-diagram.
An interesting angle would be to investigate virtual or augmented reality. One possibility here would be to use the
term digital twin and explore how to provide a way to create a digital comparison of a physical object. This can be used to view current status of an object, such as its properties, states, posit ion and motion. A great possibility here would be to use Microsoft’s HoloLens (Microsoft HoloLens, 2017) to overload the visual appearance of physical objects, animating their dynamic parts.
8. ACKNOWLEDGMENTS
We would like to thank Dr. Hilding Elmqvist for his close collaboration and feedback throughout this thesis, as well as Olle Lindeberg for his guidance and support.
9. REFERENCES
9.1. BOOKS
Bossel, H. (1994). Modelling and Simulation 2nd Edition. Wellesley: A K Peters, Ltd.
Martin, R.C. (2008). Clean Code: A Handbook of Agile Software Craftsmanship. Boston: Pearson Education, Inc. McConnell, S. (2009). Code Complete: A Practical Handbook of Software Construction 2nd Edition. Redmond, Washington: Microsoft Press.
Karnopp, D.C, Margolis, D.L, Rosenberg, R.C (2000). System Dynamics: Modeling, Simulation, and Control of Mechatronic Systems. Wiley-Interscience.
9.2. PAPERS
Carson, J.S. (2005). Introduction to Modeling and Simulation. Proceedings of the 2005 Winter Simulation Conference, December 4 - 4, 2005, pp. 8-16. Marietta, GA, U.S.A.
Christie, M., Olivier, P., Normand, J.M. (2008). Camera Control in Computer Graphics. Computer Graphics Forum, 27(8), pp. 2197 - 2218. doi: 10.1111/j.1467-8659.2008.01181. Tan, D.S. (2001). Exploring 3D navigation: combining speed-coupled flying with orbiting. Proceedings of the SIGCHI Conference on Human Factors in Computing Systems, 31 March - 5 April 2001, pp. 418 - 425. doi: 10.1145/365024.365307
Elmqvist, H., Baldwin, A.D., Dahlberg, S. (2015). 3D Schematics of Modelica Models and Gamification. Proceedings 11th International Modelica Conference, Versailles, September 21-23, 2015, pp. 527 - 536. doi: 10.3384/ecp15118527
Elmqvist, H., Mattsson, S.E., Otter, M. (1999). Modelica - A language for Physical System Modeling, Visualization and Interaction. IEEE International Symposium on Computer Aided Control System Design, pp. 630 - 639. doi: 10.1109/CACSD.1999.808720
Galitz, W.O. (2007). The Essential Guide to User Interface Design: An Introduction to GUI Design Principles and Techniques 3rd Edition. Indianapolis: Wiley Publishing, Inc. Gross, J., Aspman, K.H. (2012). Negotiating Complexity in Test Automation Tool Support (Bachelor Thesis, University of
Gothenburg, Chalmers University of Technology. Department of Computer Science and Engineering, Göteborg, Sweden). Retrieved from http://hdl.handle.net/2077/30039
Highsmith, J. and Cockburn, A. (2001). Agile software development: the business of innovation. Computer, 34(9), pp. 120 - 127. doi: 10.1109/2.947100
Huotari, K. and Hamari, J. (2012) Defining Gamification: A Service Marketing Perspective. MindTrek ’12 Proceeding of the 16th International Academic MindTrek Conference. pp. 17–22. doi: 10.1145/2393132.2393137
Klauske, L.K. (2012). Efficient editing of Simulink models using a specifically customized layout algorithm (Ph.D. thesis), Technical University Berlin, Germany. Retrieved from http://dx.doi.org/10.14279/depositonce-3379
Janowski, J., Hachet, M. (2014). Advances in Interaction with 3D Environments. Computer Graphics Forum, 34(1), pp. 152 - 190. doi: 10.1111/cgf.12466
Larkin, J.H. and Simon, H.A. (1987). Why a Diagram is (Sometimes) Worth Ten Thousand Words. Cognitive Science, 11(1), pp. 65-100. doi: 10.1111/j.1551-6708.1987.tb00863.x Lindvall, M., Basili, V., Boehm, B., Costa, P., Dangle, K., Shull, F., Tesoriero, R., Williams, L. and Zelkowitz, M. (2002). Empirical Findings in Agile Methods. Proceedings of the Second XP Universe and First Agile Universe Conference on Extreme Programming and Agile Methods - XP/Agile Universe, August 4 - 7, pp. 197-207. Chicago, IL, U.S.A. Misue, K., Eades, P., Lai, W., Sugiyama, K. (1995). Layout Adjustment and the Mental Map. Journal of Visual Languages & Computing, 6(2), pp. 183 - 210. doi: 10.1006/jvlc.1995.1010 Peffers, K., Tuunanen, T., Rothenberger, M.A. and Chatterjee, S. (2007). A Design Science Research Methodology for Information Systems Research. Journal of Management Information Systems, 24(3), pp. 45 - 78.
Protsko, L.B., Sorenson, P.G., Tremblay, J.P. and Schaefer, D.A. (2002). Towards the automatic generation of software diagrams. IEEE Transactions on Software Engineering, 17(1), pp. 10 - 21. doi: 10.1109/32.67575
Schulze, C.D., Spönemann, M., von Hanxleden, R. (2014). Drawing Layered Graphs with Port Constraints. Journal of Visual Languages & Computing, 25(2), pp. 89 - 106. doi: 10.1016/j.jvlc.2013.11.005
Sugiyama, K., Tagawa, S., Toda, M. (2007). Methods for Visual Understanding of Hierarchical System Structures. IEEE Transactions on Systems, Man, and Cybernetics, 11(2), pp. 109 - 125. doi: 10.1109/TSMC.1981.4308636
Tamassia, R., Di Battista, G., Batini, C. (2002). Automatic graph drawing and readability of diagrams. IEEE Transactions on Systems, Man, and Cybernetics, 18(1), pp. 61 - 79. doi: 10.1109/21.87055
9.3. COMPUTER SOFTWARE
Dymola (2017) Retrieved from http://www.dymola.com
(Accessed 2017-04-20)
Github Pages (2017) Retrieved from https://pages.github.com (Accessed 2017-06-20)
Modelica (2017) Retrieved from https://www.modelica.org (Accessed 2017-05-12)
Skype (2017) Retrieved from https://www.skype.com/ (Accessed 2017-05-10)
TeamViewer (2017) Retrieved from
https://www.teamviewer.com/ (Accessed 2017-05-10)
Three JS (2017) Retrieved from https://threejs.org/ (Accessed 2017-06-06)
OnShape (2017). Retrieved from https://www.onshape.com/ (Accessed 2017-06-07)
Microsoft HoloLens (2017) Retrieved from https://www.microsoft.com/en-us/hololens (Accessed 2017-05-10)