The Core Driving Forces of
Carbon Dioxide Emissions in
Swedish Municipalities
Master thesis within Economics
Author: Anna Kjellberg
Tutors: Martin Andersson
Mikaela Backman
Viroj Jienwatcharamongkohl
Master Thesis in Economics
Title: The Core Driving Forces of Carbon Dioxide Emissions in Swedish Municipalities
Author: Anna Kjellberg , 860419-5928
Tutors: Martin Andersson Mikaela Backman
Viroj Jienwatcharamongkhol
Date: May 2011
Key words: Carbon dioxide emission, Swedish municipalities, Panel data, Environmental Kuznets Curve, STIRPAT model
Abstract
The purpose of this thesis is to investigate the economic and socio-economic factors affecting the amount of carbon dioxide (CO₂) emissions in Swedish municipalities. A panel analysis of the 290 municipalities in Sweden for the years 2005-2008 is undertaken, using a pooled ordinary least square regression. To identify and analyze the factors determining the emissions this thesis follows the framework of the Environmental Kuznets Curve (EKC) and the relatively unknown STIRPAT model. The findings is in line with a number of previous global studies and identifies population has one of the major driving forces. Gross regional product, (GRP), per capita and industry structure is also found to have a positive relationship to CO₂. A quadratic form of GRP per capita is furthermore investigated and the results support the existence of an EKC in Sweden, suggesting that the emissions eventually diminish after a certain level of GRP per capita. In addition, population density is identified to have a negative relationship to CO₂ and explanations of the two latter findings are based on arguments put forward by modernization theory. As industrialization and the subsequent economic growth eventually mature, a structural transformation shifts economic activities to a less energy and pollution intensive production. Urbanization is furthermore suggested to encourage an environmentally friendly technology progress. Finally, preferences are also subject to change and results in an increased demand for environmental quality. In terms of Swedish policy actions, the greatest concern is the impact of the population and the actions of human individuals should hence attract the most attention.
Acknowledgement
I would like to thank my supervisors Martin Andersson, Mikaela Backman and Viroj Jienwatcharamongkohl for their helpful guidance in the process of writing this thesis. I would also like to thank my dear classmates for their support during the past 4 years of studies and the final semester of master thesis writing. Finally, I will also give a special thanks to my dear boyfriend and family for always encouraging me.
Table of Contents
1
Introduction ... 1
2
The economic nature of environmental problems ... 3
2.1 Carbon dioxide emissions and the Swedish regions ... 3
3
The foundation of the STIRPAT model ... 5
4
Core driving forces of CO₂ emissions ... 7
4.1 Economic growth ... 7 4.2 Population ...10 4.3 Urbanization ...11 4.4 Economic structure ...12 4.5 Human capital ...13
5
Empirical study... 15
5.1 Methodology ...155.2 Data and variable specification ...15
5.3 Model specification ...17
6
Empirical results and analysis ... 19
6.1 Descriptive statistics ...19
6.2 Regression results ...20
6.2.1 Regression results, CO₂ per capita...23
6.2.2 Regression results, EKC ...24
6.3 Validity and limitations ...25
6.4 Policy implications ...26
7
Conclusion ... 27
Figures
Figure 1 CO₂ (tons) in respective municipality ... 4
Figure 2 Environmental Kuznets Curve (Panayotou, 1992) ... 7
Figure 3 Economic development and its relation to environmental degradation ... 8
Table 1 Variable description ...17
Table 2 Descriptive statistics...19
Table 3 Regression results, equation 4 ...20
Table 4 Regression result, equation 5...23
Table 5 Regression results, equation 6 ...24
Appendix
Appendix 1 Correlation matrix ...32Appendix 2 Variance Inflation Factor ...33
Appendix 3 Residual Scatterplot LnCO₂ ...33
Appendix 4 Residual Scatterplot LnCo₂ per capita ...34
Appendix 5 Histogram LnCO₂ ...34
Appendix 6 Histogram LnCO₂ ...35
Abbreviations
CO₂ = Carbon dioxide
EKC = Environmental Kuznets Curve GDP = Gross domestic product GRP = Gross regional product GHG = Greenhouse gas
IPAT = Impact, Population, Affluence and Technology IPCC = Intergovernmental Panel on Climate Change SEK = Swedish Krona
STIRPAT = Stochastic Impact Regression on Population, Affluence and Technology EPA= Environmental Protection Agency
1
Introduction
The last decades have been subject to an intensive debate concerning the environment and the effects of economic development on the increasing concentration of greenhouse gases in the atmosphere. The terms climate change and global warming have been frequently used and climate change is referred to “any extended alteration of the Earth’s climate produced by natural factors, human activities or a combination of the two” (Bova, p.255, 2010). According to many scholars, the currently most vital climate threat is the global warming, the observed increase in the Earth’s average surface temperature (Bova, 2010). The contribution of human activities is discussed and the Intergovernmental Panel on Climate Change1, (IPCC), (2007) argues that the anthropogenic (human induced) emissions are very likely the reasons for most of the increased temperature since the mid-20th century. The major human activity claimed to contribute to the global warming is the emission of greenhouse gases, (GHG’s), and especially the emission of carbon dioxide (CO ) (IPCC, 2007). The emissions are due to the burning of fossil fuels, such as oil and coal from industrial production, households and transportation (Kahn, 2005).
Since the consequences of the increased temperature are argued to be severe, the subject is motivational to investigate. In order to achieve a sustainable development, an appropriate assessment of policy actions in response to the increasing temperature is required. In turn one has to understand the drivers of the global warming and identify the underlying factors of the anthropogenic CO₂ emissions. The purpose of this thesis is to investigate the economic and socio-economic factors affecting the amount of carbon dioxide emissions in Swedish municipalities. By using cross-regional data, collected from Statistics Sweden and the Swedish Environmental Protection Agency (EPA), a panel analysis of the 290 municipalities in Sweden will be presented. Due to the lack of data, the empirical study only includes the years 2005-2008.
The international character of the global warming makes it subject to a number of problems, problems that global agreements such as the Kyoto protocol2 has been developed to solve. One setback is the problem of free riding countries that emit a lot of pollution and still benefit from other countries contributions to reduce the emissions (Bova, 2010). In contrast, Sweden has one of the lowest levels of GHG emissions per capita among the developed countries (Swedish EPA, 2011). Furthermore, Sweden has also showed that it is possible to combine a reduction of GHG’s and economic growth. Between the years 1990 and 2008 Sweden managed a 12% reduction of emissions together with an increased GDP of 50% (Miljödepartementet, 2010). This provides an incentive to particularly examine the determining economic and socio-economic factors of CO₂ emissions in Sweden, and
1 IPCC is an intergovernmental panel that was established 1988, by United Nations Environment Program
(UNEP) and World Meteorological Organization (WMO), to compile and update the world with objective scientific research concerning climate change and its impact on the environment (IPCC, 2007).
2 The Kyoto protocol is a global agreement, ratified by 168 countries, concerning the national reduction targets
of emissions. It was established 1997 as an update of the United Nations Framework Convention on Climate Change, and went into action 2005 (Ibid).
especially investigate how economic growth and GDP are related to the quantity of emissions.
In contrast to many global and cross-national studies this thesis uses a regional approach. There are only a few local studies made and the driving forces of CO₂ have, as far as the author is aware, never been investigated in Sweden before. Investigating regions within a country has advantages in terms of homogeneity, as they all belong to the same economic entity, with the same legal and institutional background. It can furthermore be assumed that
the regions have the same cultural setting and ethical perceptions when it comes to the environment. A local approach has moreover advantages when it comes to identify appropriate abatement strategies. As they often are of local character a narrower approach is
hence a desired complement to global studies.
To identify and analyze the factors determining the CO₂ emissions in Swedish regions this thesis follows two different frameworks. The first one is, in environmental economics, the most established hypothesis, the Environmental Kuznets Curve (EKC). The EKC hypothesis argues that the GHG emissions eventually decrease as the economy grows. It hence suggests a non-monotonic relationship and it is expressed as an inverted U shaped curve (Panayotou, 1992). A number of studies; Panayotou (1992) and Shi (2003) confirms the EKC and have found evidence that some of the GHG emissions decreases after a certain level of GDP. This thesis also follows the relatively unknown STIRPAT model, developed by Dietz and Rosa (1997). In addition to GDP the model also employ factors such as population and technology, identified as some of the core driving forces of carbon dioxide emissions (Stern et al, 1992). In this thesis are a location quotient index, representing the industry structure in the different municipalities, population density and human capital investigated as well. The findings are to a large extent in line with previous global studies that have identified a positive relationship between GDP per capita, population and manufacturing industry and CO₂ respectively. Moreover, results show that population density has a negative relationship to the emissions and furthermore suggest the existence of an EKC, as GRP per capita has a non-monotonic relationship to CO₂. Explanations are based on modernization theory, arguing that a structural transformation of the economy and a shift in how and what we produce eventually decreases the emissions of GHG’s.
This thesis is outlined as follows. The next chapter presents the economic background of the climate change as well as an overview of the CO₂ emissions in Swedish municipalities. Chapter 3 provides a description of the STIRPAT model and the proceeding chapter depicts the principle driving forces of CO₂ emissions, based on the EKC and the STIRPAT framework. Furthermore, chapter 5 presents how the empirical study has been carried out and the following chapter presents the empirical findings and analysis. The final chapter concludes the thesis.
2
The economic nature of environmental problems
The free market system, and the concept of the invisible hand leading to a socially efficient allocation of resources as individuals maximizes their own welfare, is widely adopted among the world’s economies (Kahn, 2005). In spite of that, the market system is not perfect and it only works well under specific circumstances. The instances when the market fails to allocate the resources efficiently enough to produce the optimal equilibrium are referred to market failures (Mankiw, 2008). They occur when the market is not complete and the private and social costs/benefits diverge. One example of market failures is externalities, unintended spillovers, and a typical negative externality is pollution. It is a cost not only affecting the emitter but the society as a whole and makes the emitter produce more than what is optimal (Hacket, 2006).
Another market failure deals with the concept of public goods, goods that are consumed collectively without anyone’s consumption affecting another’s. In relation to environmental economics, a typical public good is clean air (Brännlund & Kriström, 1998). The market fails to provide the socially optimal amount of clean air and it is subject to the free rider problem as it is impossible to exclude anyone from consuming it. The benefits from reducing emissions are available to everyone, even the worst emitters (Varian, 2006).
Both these market failures are related to cases where property rights are not well defined. The significance of property rights in economic theory has been discussed by the economist Ronald Coase and has resulted in the Coase theorem. Coase argues that, under specific circumstances, if there are well-defined property rights, negotiations will lead to an optimal socio-economic equilibrium (Brännlund & Kriström, 1998). According to Brännlund & Kriström (1998) is the Coase theorem, due to its restricted assumptions, not that applicable when it comes to environmental economics. The character of the environmental problems of externalities, such as emission of pollution, makes them affect a large number of people and hence violate important assumptions, such as low transaction costs. Define property rights for a common resource like the atmosphere is impossible (Brännlund & Kriström, 1998). The result of an unregulated commonly available resource that are beneficial for everyone individually to use but ends up being overexploited, as no one takes responsibility to protect, is subject to the phenomenon of the “tragedy of the commons”(Hardin, p.1244, 1968). Garret Hardin (1968) established the concept in the 60’s and the environmental problem of increased emission of GHG’s in the atmosphere is according to Bova (2010) a case in point.
2.1
Carbon dioxide emissions and the Swedish regions
This thesis focuses on carbon dioxide which is one of a number of gases that are referred to greenhouse gases. CO₂ has received far the most attention and it is the most prominent one since it represents about 80% of the total amount of GHG emissions (IPCC, 2007). The GHG’s are to some extent necessary in the atmosphere as they absorb infrared radiation, heat (Pleijel, 2009). However, IPCC (2007) argues that the human induced global emissions of CO₂ have increased rapidly since the 17th
century. The accumulated concentration of CO₂ is claimed to increase the surface temperature, and in Sweden it is projected to increase by
2, 5 - 4, 5° C, compared to levels in 1961-1990 (Swedish EPA, 2011). The claimed effects3 of the increased temperature are furthermore argued to not only differ globally, but also within countries.
In relation to this and to get an overview of Sweden and the CO₂ emissions in the municipalities, figure 1 is showing a map of Sweden. Sweden is divided into 21 counties and
each county is furthermore divided into municipalities, where the total number of municipalities is as mentioned before, 290 in total. In terms of that and the fact that Sweden
stretches over a fairly large area, makes the municipalities heterogeneous in many senses. Although the regions have the same institutional and political settings, they have different industry structure and different infrastructure in terms of roads and public transport. Furthermore, the Swedish municipalities consist of both rural and urban areas and exhibit relatively different demographic characteristics. For example such as different population density. The largest metropolitan municipalities are Stockholm, Gothenburg and Malmö, in respective order. The municipalities and their neighboring areas are depicted more narrowly in the figure below. The figure shows the quantity of carbon dioxide emissions in the different municipalities and the scale is ranging from approximately 8932 and 4300827 tons. As evident, Stockholm, Gothenburg and Malmö are in the top but also more northern parts of Sweden have relatively high amounts of CO₂.
3 The claimed effects of the increasing temperature are for example changed precipitation patterns and increased
storms and heat waves (US. EPA, 2010)
3
The foundation of the STIRPAT model
Stern et al (1992) identifies, in a summation of a wide range of studies, five different classes of possible causes of anthropogenic impact on the environment and climate change. They illustrate a composition of variables from a social, political, economic, technological and cultural framework and Stern identified the core driving forces as (i) Population growth, (ii) Economic activity, (iii) Technological change, (iv) Political & Economic Institutions and (v) Attitudes & Beliefs (Stern et al, 1992).
Due to the regional approach used in this thesis, the fourth and fifth driving force are of less interest because of the assumed homogeneity among the Swedish municipalities. A regional approach is furthermore, as previously argued, desired in addition to cross-national studies. A
local approach is a valuable supplement not only due to the relation to local abatement strategies, but also since some of the driving forces may be of a local character and possibly
be discounted in a process of a larger scale (Angel et al, 1998). Moreover, Angel et al (1998) argue that regional studies also improve the tractability of the analysis, as an investigation of the causal relationship is a complex process.
The first three variables, identified as the key determinants of CO₂, were already adopted in a more analytical framework in the early 1970s’. Ehrlich and Holdren (1971) and Commoner (1972) formulated a simple accounting identity, known as the IPAT identity. IPAT is an acknowledged tool for analyzing the environmental impact of anthropogenic emissions in relation to economic and socio-economic factors (York et al, 2003) (Chertow, 2001). The IPAT equation specifies the key driving forces of environmental Impact as Population size, Affluence, (measured as income per capita) and Technology (York et al, 2003). In this framework, environmental impact, measured for example by the emissions of CO₂, is referred to the impact of human activities and it is a multiplicative product of the proposed driving forces. P and A is used to solve for the technology factor, T, and it was originally modeled as a residual, representing the environmental impacts of all variables other than population and affluence. T hence represents the impact per unit of production/consumption, i.e. economic activity. Its strength is, according to York et al (2003) that the impact of the drivers is interdependent and no factor is solely responsible for the environmental effect. On
the other hand, critics of the IPAT identity argues that, due to its accounting equation character, it lacks the possibility of making hypothesis tests and it assumes a monotonic and
proportional relationship (York et al, 2003). Furthermore, while the IPAT formula has been modified a number of times and Waggoner and Ausubel (2002) have developed a revised version of the IPAT identity, the ImPACT identity, it still has the same limitations (York et al, 2003). The purpose of the identities is to find the principle drivers of emissions to be able to assess appropriate policy actions to reduce their environmental impacts (York et al, 2003).
In response to the criticisms of the IPAT and ImPACT equations, and the lack of an appropriate model to investigate the determinants of environmental degradation and emissions, Dietz and Rosa (1997) derived a stochastic model from the IPAT equation, the
STIRPAT4 model. It is a refined version of the IPAT identity in the sense that it allows for a
quantitative analysis and empirical hypothesis test of the individual impact of the emission driving factors. The model was initially specified as showed in equation 1,
=𝛂
(1)
where the constant α and the exponents β, γ, and δ are the parameters to be estimated. An error terms is furthermore added to make the model stochastic and the subscript i denotes that P, A, T and e vary across the observations. The majority of variables, Ii, Pi, Ai, have the same
interpretation as in the IPAT equation, however the interpretation of the technology variable, Ti, differs. The original STIRPAT model includes the technology factor in the error term as
well, but attempts have been made to disaggregated T and define it, for example in terms of urbanization and industrialization (Martinez-Zarzoso, 2008, York et al, 2003). York et al (2003) has moreover refined the STIRPAT model and included the concept of ecological
elasticity (EE), with the aim of increase its utility as an analytical tool to investigate the driving forces. Ecological elasticity refers to the responsiveness of changes in individual driving forces to the environmental impact, here CO₂ emissions, holding all other driving forces constant. Adopting the concept of EE allows for an exact interpretation of the effects of the proposed core driving forces (York et al, 2003).
Due to the fact that there are only a few well-established models in the field of environmental economics, as mentioned before, the use of the STIRPAT model is hence based on the circumstance that it is the most appropriate model available. A number of studies have been
made to try to understand the underlying factors of carbon dioxide emission, and environmental degradation in general. However, most of them have used a qualitative approach or field studies, through both an accounting and decomposition framework (Ang and Zhang, 1998, Dietz and Rosa, 1997). In contrast, the advantage and motivation for using the STIRPAT model is based on the fact that it allows, as pointed out earlier, for a quantitative regression analysis and individual impact assessment of the driving factors.
4
Core driving forces of CO₂ emissions
This chapter presents some of the key determinants of carbon dioxide emission that are
suggested by theory and previous literature, including (i) GDP, (ii), Population, (iii) Urbanization (iv) Industry structure and (v) Human capital. The relationship between
GDP and CO₂, in context of the EKC and the relationship between economic growth and environmental impact, is presented in more detail. Furthermore, the relevance of the suggested driving forces and their application to the empirical analysis in the case of Sweden and its regions is also discussed.
4.1
Economic growth
The projected effects of the global warming, such as the change of precipitation patterns and hence shifts in agriculture patterns, will alter the living conditions for a lot of people around the world, particularly in the developing countries (Sida, 2010). In addition to a need of a healthy environment, the need for economic growth in the developing countries is extremely important as well. To achieve sustainable development the theory argues that the three pillars, economic growth, society and the environment need to be combined and reinforce each other (Hacket, 2003). However, it is often argued to be a tradeoff between economic growth and environmental quality and the question whether a mutual achievement is actually possible has been widely debated in decades (Pasche, 2002).
Economic growth, represented by the development of income per capita, is signifying the level of affluence and is hence one of the factors identified as one of the core driving forces of environmental degradation (Stern et al, 1992). A number of studies have been made to try
to understand the relationship between economic development and environmental degradation and the results differ (Cole et al, 1997, Shi 2003, Dietz and Rosa 1997). While
some extreme arguments suggest that rapid economic growth is the solution to environmental problems, others argue that economic growth is the evil behind them. One
thing is nevertheless agreed upon, income and the level of economic development is to some extent affecting the environment (Grossman and Krueger, 1995).
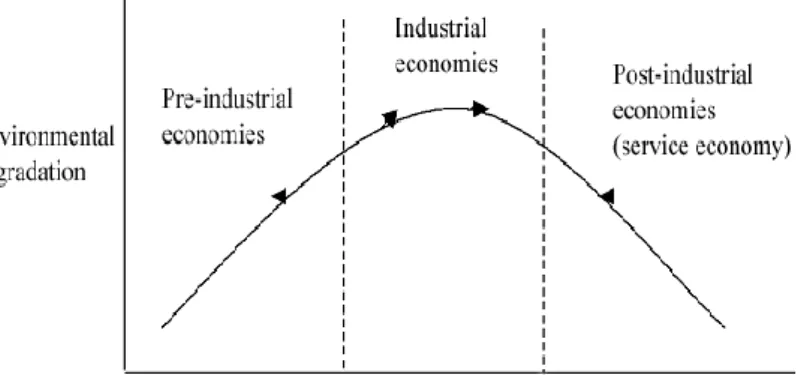
Several studies has been done within the framework of the Environmental Kuznets Curve hypothesis, suggesting an inverted U shaped relationship between income per capita and pollution, as an indicator of economic degradation, as displayed in figure 2 (Pasche, 2002).
The concept has been developed by Radetzki (1990) and Panayotou (1992) and is influenced by the income-inequality relationship recognized as the Kuznets Curve hypothesis (Kuznets, 1955). According to Panayotou (1992) the EKC suggest a non-monotonic relationship between GDP per capita and level of pollution, where the emissions subsequently diminishes after a certain level of income.
The explanations for a positive relationship between economic growth, GDP per capita, and emissions is rather straight forward. Industrialization and rapid economic growth increases the pressure on the environment in terms of heavy production and increased demand for energy and transportation. Furthermore, increased affluence is argued to increase the level of consumption and hence production and subsequent generate more waste and more emissions. These arguments hence suggest a monotonic relationship between GDP per capita and CO₂ emissions (Panayotou, 1997).
On the other hand, a more optimistic view exists and opponents argue that economic development in fact can reduce the impact on the environment and decrease emissions. This view is, as mentioned, supported in a number of EKC studies as a non-monotonic relationship has been identified. The reasoning behind this relationship originates from modernization theory, arguing at the other extreme that the best way to solve environmental problems is through increased economic growth. Modernization theory argues that production functions are limited before industrialism and carbon dioxide emissions are low, due to more simple technologies and agriculture as the major economic activity (Shandra et al, 2004). The economic development and the proposed relation to environmental degradation, here referred to the emissions of CO₂, is showed in figure 3. As countries grow, energy intensive production increases and the industrial process subsequently increase the emissions of carbon dioxide. Finally, as the industrialism matures the emissions and environmental degradation diminishes.
The major argument behind a non-monotonic relationship is based on a structural transformation and a change in how and what we produce. According to Pasche (2002) the
reasons for the supporting evidence of an EKC is (i) the shift of economic activities to a less
energy and pollution intensive production and (ii) the growing environmentally friendly technological progress. Underlying reasons is that countries in the mature phase are subject of
a structural shift to a more service and information based economy and increasing innovation of more energy efficient technologies. Moreover, a further explanation for the relationship between GDP per capita and environmental degradation is linked to preferences. The reasoning is based on positive income elasticity, and a shift in demand, towards higher environmental quality, as a country gets wealthier (World Bank, 1992). An additional explanation is that countries at higher levels of income outsource heavy industry production
and instead import energy intensive goods from less developed countries (Panayotou, 1992). The proposition that economic growth eventually results in decreased emissions is confirmed for a number of environmental indicators, such as carbon monoxide and sulfur dioxide in a number of cross-national studies (Grossman & Krueger, 1995), (Seldon & Song, 1994). Results show that the relationship is non-proportional in contrast to the findings of the IPAT identity. As mentioned previously, this suggests that emission levels are not fixed along a countries development path. The threshold or turning point of emissions, at a certain level of income, differs in the studies and for different indicators of environmental degradation. There are however many critics to the EKC, Cole et al (1997), Heenrink et al (2001) and
Coondoo and Dinda (2002), have found evidence of a monotonic relationship between income and emission. Furthermore, the anticipated turning points are in many studies not realistic to be attainable. Another major critic of the EKC is that although it has been identified for a number of greenhouse gases, it tends to have a weak application to the most
prominent greenhouse, CO₂. Carbon dioxide is one of the environmental indicators associated with an unattainable turning point (Panayotou, 1992). However, in the case of Sweden, an EKC is argued to exist and there is a trend of decreasing emission of carbon dioxide along with economic growth (Lundström, 2008).
Although the effect of economic growth and affluence diverges, the literature suggests that GDP to some extent determine and influence the level of environmental pollution in a country. Hence is GRP per capita regarded as a relevant variable to be included in the proceeding study investigating the factors determining CO₂ emissions in Swedish municipalities. The relationship is expected to be positive and an increase in income per capita will increase the emissions of CO₂. The relationship is furthermore expected to be approximately proportional, however is a non-monotonic relationship expected to prevail. In line with the EKC hypothesis, the level of emissions is expected to decline as the regions gets wealthier, indicated by a negative sign of GRP per capita². Carbon dioxide emissions are furthermore suggested to be explained by the level of population and the relationship is discussed in the next section.
4.2
Population
The rationale behind the inclusion of population, as a variable affecting the amount of emissions of carbon dioxide in Swedish regions, are based on the old Malthusian view of population growth and most importantly because, it is widely acknowledged as one of the core driving forces of economic degradation. Furthermore, as population is one of the three key determinants in the original IPAT identity, it is generally included in studies investigating the underlying driving forces behind anthropogenic emissions (Dietz and Rosa, 1997).
The significance of population growth and its impact on the environment was early realized by the British economist Thomas Malthus who argued that environmental quality in terms of natural resources would be exhausted as the population grows (Malthus, 1768). This focus on
shortages has according to Shandra et al (2004) been extended, in more modern neo-Malthusian theory, to argue that population dynamics is also contributing to economic
degradation in general, including emissions of carbon dioxide as well.
A number of studies Dietz and Rosa (1997), Cropper and Griffiths (1994) and Cole and Neumayer (2004) has recognized a relationship between population and carbon dioxide emissions, as well as other indicators of environmental quality. All these studies found a monotonic relationship and the majority of them assume that the elasticity of emissions of CO₂ is unitary with respect to a change in population (York et al, 2003). However, some studies, for example Shi (2003) found that the emissions have increased more than proportionately to population growth the last decades. Shi (2003) studied the relationship for
countries with different level of development and found specifically evidence of increased emissions due to population growth in less developed countries.
The explanations for a positive relationship between population and environmental degradation is summarized by Birdsall (1993) in two mechanisms, (i) the pure arithmetical effect on GHG’s emissions as more people demanding fossil fuel intensive energy and (ii) the impact of a growing population on deforestation. The first one simply argues that increased population, at a given level of per capita income, results in increased burning of fossil fuels due to the increased demand for energy, both in industry production, in households and for transportation purposes. The increased burning of fossil fuels in turn emits more carbon dioxide. The second mechanism, deforestation, refers to the complete removal of forests, without any replanting, and is one of the key contributors to the greenhouse effect. Birdsall (1993) argues that CO₂ emissions increase as the population grows due to the need of land for crops, houses and for the burning of wood. Deforestation is especially a serious problem in developing countries where poverty, lacking land security and poor government policies is more present.
On the other hand, as in most cases there are critics to the proposed relationship, and the effect of population on the amount of CO₂ emissions are in a few studies argued to be negative. Seldon and Song (1994) argues that population growth has a negative relation to environmental degradation in the sense that increased awareness, due to expansion over the
landscape, leads to more pressure on environmental regulations. The suggested explanation for the positive implications of a growing population is based on findings that urbanization,
by increased technological progress, will decrease the amount of emissions. This finding suggests population density as an additional variable and it is presented in more detail in the next section. Population is however expected to have a positive relationship to CO₂ in this study. An increase in population is anticipated to significantly increase the emissions and the relationship is furthermore expected to be approximately proportional.
4.3
Urbanization
As mentioned before, the original technology factor represented a residual of all other factors with environmental impact, other than population and affluence. However, attempts have been made in recent studies to incorporate the factor in the model. Suggested variables range from industry structure, climate and urbanization. The latter is discussed in this section as an additional variable affecting the CO₂ emissions in Swedish regions.
In addition to the increased level of population, urban migration is another demographic change with an observed accelerating trend worldwide and with a possible negative impact on CO₂ emissions. The original IPAT identity assumes identical contribution of the whole population regardless of their locations. It is however argued that population living in rural areas, with agriculture as the major economic activity, is less fuel intensive and emits a low quantity of CO₂. Whereas the population working in the industry sector in urban areas is argued to emit a much higher amount of carbon dioxide, due to a more fossil fuel intensive production (Auffhammer et al, 2004).
Although it is a rather recent approach, a number of studies have incorporated a variable representing urbanization, to determine the level of environmental degradation Auffhammer et al (2004), York et al (2003) and Martinez-Zarzoso (2008). It is in some studies represented in terms of population density but also percentage of urban population is a commonly used measurement. In addition, Cole and Neumayer (2004) investigate if the emissions are differing across age groups, due to different consumption patterns. Furthermore, Martinez-Zarzosa (2008) studies the relation between CO₂ emissions and urbanization by
investigating the percentage of urban population in countries with different income levels. In this thesis urbanization is represented by population density. However, due to the small number of studies, specifically investigating the CO₂ emissions, as the environmental indicator, and population density as the measurement of urbanization, expectations and explanations is interpreted in the frame of urbanization in general.
Previous studies suggest that a higher level of urbanization has a positive impact on carbon dioxide emissions, as well as other indicators of environmental quality. The reasoning behind this is based on the fact that population in generally is argued to be positively related to economic degradation, through its association to per capita impact of the environment. Hence, as the per capita impact is also a function of not just the size but also the density of the population, urbanization is argued to have a positive relationship to CO₂ as well (Shi, 2003). Urban migration is therefore argued to, as in line with the population size and growth effects, increase the demand for energy and fossil fuel intensive products, due to different
behavioral patterns. Furthermore, urbanization is argued to increase the transportation of agriculture products (Cole and Neumayer, 2004).
However, Martinez-Zarzosa (2008) found that although lower income countries have positive relationship between urbanization and carbon dioxide emissions, more developed countries have a negative relationship. Explanations for a negative relationship are, as in the case of the negative relation to GDP per capita and the EKC, based on modernization theory. The theory argues that as the society develops and modernize, urban agglomeration increases and the increased population density encourages technological innovation towards less energy intensive production (Shandra et al, 2004). Furthermore, Shandra et al (2004) suggests that urbanization can be beneficial and decrease energy intensive consumption, particularly in terms of improved transport efficiency. In addition, some theorist argues that a similar hypothesis underlying the EKC is, instead of an inverse U shaped relationship to economic growth, prevails for urbanization (York et al, 2003).
Population density is nevertheless expected to be positively related to carbon dioxide. However, as indicated before, the specific relationship has not been investigated in a large extent and the outcome is therefore uncertain. The proportionality is hence hard to speculate in as well. Continuing in the modernization track, urbanization and economic growth is both
based upon and related to industrialization. To further try to comprise the effect of industrialization, an additional factor representing the economic structure is presented in the
next section.
4.4
Economic structure
Economic structure or more specifically, industry structure is the next variable that is investigated. The reasoning behind the inclusion of the variable is also based on modernization theory, as argued before. As industrialism is the starting point of economic
growth and urbanization, and these factors is argued to be of significance when determining the level of CO₂ emissions, a variable representing the industry structure is hence justified. As mentioned before, the technology factor in the original IPAT and STIRPAT model was modeled as a residual term and represented the impact per unit of economic activity from all factors other than population and affluence. In the section above, T was disaggregated to include an additional variable, representing urbanization. To further capture the effect of exogenous technology, T has been extended to represent the share of industry out of economic activity in a number of studies, York et al (2003), Shi (2003) and Auffhammer et al (2004). Services as % of GDP have also been included as an additional explanatory variable of CO₂ emissions. Furthermore, to capture the structural effect Fan et al (2006) and Shi et al (2003) has more specifically measured manufacturing as a percentage of economic activity. Auffhammer et al (2004) uses, in a similar matter, an industry composition variable in their regional study of CO₂ emissions in Chinas provinces. The variable is defined as the share of heavy industry out of total output, GDP.
In accordance with these previous studies, the focus in this thesis is the manufacturing sector and to capture the effect of the industry structure in Swedish regions, a location quotient (LQ) index is used. The LQ index represents the weight of manufacturing industry in the respective municipality compared to the weight of the industry in Sweden as a whole. The computation and the interpretation of the industry structure variable are further developed in more detail in the methodology chapter.
York et al (2003) argues that it is not only the size of the economy but the structure as well that affects the carbon dioxide emissions. The two are although interrelated and this section is hence related to the arguments, put forward by modernization theory, in the section describing the relation between carbon dioxide emissions and economic growth. Growing and more industrialized countries is argued to have a higher level of CO₂ emissions, due to a more fossil fuel intensive production but as the industry matures the activities shifts to more service and information based economic activities. This suggests that depending on in what stage an economy is in, is determining the quantity of CO₂ emissions. This can further be interpreted as, a larger share of industrial activity increases the carbon dioxide emissions. Due to the fact that it only exists a few regional studies, previous studies has not much to say about the expected impact of industry structure within a country. Auffhammer et al (2004), as mentioned above, investigates the industry structure in Chinese regions and found their variable, % of heavy industry, to be positive related, but insignificant. Empirical studies on a global level has, however, found that more industrialized economies have higher levels of carbon dioxide emissions, in contrast to less developed economies (York et al, 2003). On the other hand, Shi et al (2003) found that, in accordance with modernization theory, countries with a higher share of manufacturing of GDP has higher emissions than countries with a larger share in services. In this view is the inclusion of economic structure justified.
The location quotient index is expected to be positively related to the quantity of carbon dioxide emissions. A higher number of employees in the manufacturing sector in the municipality, compared to the country level, are anticipated to increase the amount of CO₂. However, as in the case of population density, the outcome is uncertain since no previous study has used this particular specification of industry structure.
4.5
Human capital
In relation to the industry structure in a country and here in the different municipalities, the structure and distribution of human capital is interesting as well. Hence, an additional factor representing the level of education is also investigated, and is in this thesis suggested as an additional factor disaggregated from the technology factor. Human capital is here measured as the percentage of population with at least 3 years of university studies. Its relation to carbon dioxide emission is in the context of industry structure, based on the following argumentation. According to Ciccone and Papaioannou (2009) are countries that experiences increased level of education linked to a transformation of the industry structure. The production is argued to shift from heavy manufacturing toward human capital intensive industries with less pollution intensive production. A structural change toward a service and information based economy can hence be argued to decrease the emissions of carbon dioxide.
The reasoning is also in line with modernization theory that argues that a higher level of education furthermore increases the adoption of new technologies and as a country develops and matures technological innovation is more environmentally friendly and encourages a less energy intensive production.
On the other hand, Cole et al (2007) have studied the industrial activity in China and its relation to the environment and found evidence of a positive relationship between human capital and pollution. The study investigated the emissions of sulfur dioxide, dust and soot. Cole et al (2007) argues that the role of human capital is not that straight forward. Compared to low skilled intensive industries, on one hand human capital intensive industries are relatively energy efficient due to high technology. However, on the other hand human capital intensive sectors is argued to be less environmentally friendly, in the sense that emissions are linked to more complex industries, requiring skilled labor with higher education (Cole et al, 2007).
Human capital is although expected to have a negative relationship to the emissions of carbon dioxide. An increase in human capital, an increase in the proportion of the population with more than 3 years of university studies, is expected to decrease the quantity of CO₂. However, as in the case with population density and industry structure the outcome is rather uncertain since human capital is not dealt with in this context in any larger extent.
Based on the preceding theoretical framework, affluence, population, both in terms of size and density, industry structure and human capital is argued to be some of the determining factors of carbon dioxide emissions. It is in this light the following empirical study is conducted.
5
Empirical study
This chapter describes the method that has been used to investigate the determining factors of CO₂ in Swedish municipalities. The data and the variable computing process as well as the utilized model, a modified version derived from the STIRPAT model and an additional model investigating the existence of an EKC curve, are presented. Next is a section describing the methodology.
5.1
Methodology
This thesis uses a quantitative approach to investigate the core driving forces of carbon dioxide emissions suggested by previous literature and empirical studies. Since the observations for the municipalities are collected repeatedly for a number of years the study is
dealing with panel data. A number of previous studies conducted on a global scale have used a fixed effects model in order to adjust for heterogeneity bias. Fixed effects measures the different characteristics of the specific observations, normally countries, other than those absorbed by the explanatory variables. A fixed effects model has been regressed however not with any satisfactory results since the variation of the observations over the chosen years is not enough. An econometric approach in terms of a pooled ordinary least square (OLS) regression is undertaken instead. A pooled OLS regression is a relatively simplistic approach however it fits the dataset in this study since it is only concerned with a small number of years and also dealing with regions within a country. The coefficients are interpreted in a similar manner as in a standard OLS regression, the β coefficients represents the change in the dependent variable, here carbon dioxide emissions, from a change in the respective explanatory variables. Holding all other variables fixed. The only difference is that in a pooled OLS is the unobserved heterogeneity effect captured by a time invariant intercept term, here labeled . The intercept term represents the dummy variables for the different years, minus one year, 2005, to avoid the dummy trap.
5.2
Data and variable specification
The unit of analysis in this thesis is the Swedish municipalities. A complete dataset for the total number of 290 municipalities in Sweden, representing GRP, population, population density and human capital is collected from Statistics Sweden. Furthermore, to be able to compute a location quotient index representing the industry structure in the respective region, employment data per industry sector is also collected from Statistic Sweden. Data on the carbon dioxide emissions on a regional level is collected from the Swedish Environmental
protection agency through RUS, a regional cooperation institution, concerning the environmental reduction target system. The Swedish emissions is divided into eight sub sections (energy supply and industry process etc.), however in this thesis the total quantity of CO₂ emissions is considered for the respective municipality. The data has furthermore been collected using similar data collecting procedures for the total number of municipalities. The data was collected for the years 1990, 2000, 2005, 2006, 2007, 2008, however due to the lack of data on regional CO₂ emissions between the years 1990-2000 and 2000-2005, only four years, 2005-2008 is included in the panel analysis. Furthermore, regional GDP was only
obtainable from 1993 and onwards. The data set consists of a total of 1160 observations and since no data is missing for the complete number of municipalities, the panel is balanced. Carbon dioxide emission is the dependent variable and it is the focus of this thesis. The aim is to determine the underlying factors affecting the emission of CO₂, and to help with that the explanatory variables are GRP per capita, population, population density, human capital and industry structure, which was depicted in the theoretical framework. The latter variable measures the industry intensity in the 290 municipalities respectively, and it is computed by using a location quotient index (LQ). The LQ index uses employment numbers to measure the weight of a particular industry in a particular location. In this thesis, the chosen industry is manufacturing and the choice is based on findings in previous studies (Shi et al, 2003) (Auffhammer, 2003). The index is hence labeled manufacturing index (MI) in the proceeding chapters. By using employment data according to the Standard Industrial classification (SIC), the chosen SIC codes are 15-37, representing the total manufacturing sector. The location quotient index is calculated as showed in equation 2,
=
(2)
where
is the location quotient index, denoted by the subscript i to represent the individual municipality. represents the number of employees in the manufacturing sector
in the respective municipality and is the total number of employees in the municipality. is furthermore representing the weight of the manufacturing sector in Sweden as a whole, by letting be the total number of employees in the manufacturing sector in
Sweden and is the total number of employees in Sweden.
Furthermore, a dummy variable representing the metropolitan regions is also included in the study to observe if the largest regions have any significant impact on the regression result. The dummy variable includes the three largest metropolitan municipalities Stockholm, Gothenburg and Malmö.
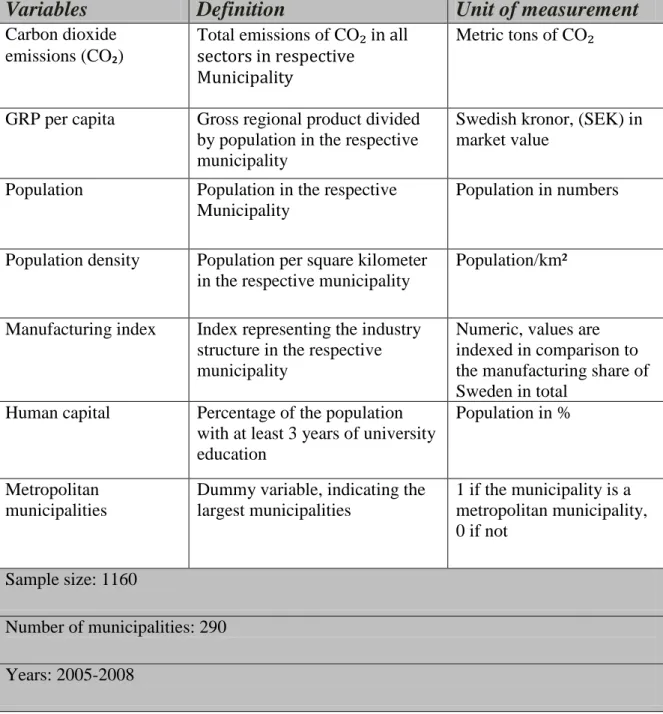
The collected data and the computed industry structure index are summarized in the following table, showing the definitions and the unit of measurement of the specific variables. The following variables are the underlying basis of the models used in the empirical study and which are depicted in more detail in the next section.
Table 1 Variable description
Variables
Definition
Unit of measurement
Carbon dioxide emissions (CO₂)
Total emissions of CO₂ in all sectors in respective Municipality
Metric tons of CO₂
GRP per capita
Gross regional product divided by population in the respective municipality
Swedish kronor, (SEK) in market value
Population Population in the respective Municipality
Population in numbers
Population density Population per square kilometer in the respective municipality
Population/km²
Manufacturing index Index representing the industry structure in the respective municipality
Numeric, values are indexed in comparison to the manufacturing share of Sweden in total
Human capital Percentage of the population with at least 3 years of university education
Population in %
Metropolitan municipalities
Dummy variable, indicating the largest municipalities 1 if the municipality is a metropolitan municipality, 0 if not Sample size: 1160 Number of municipalities: 290 Years: 2005-2008
5.3
Model specification
In relation to the previous literature and the suggested core determining factors of carbon dioxide emissions presented above, the model that is used in this thesis is to a large extent in line with the studies of the EKC hypothesis and the STIRPAT model. The model is derived from the STIRPAT model showed in equation 1, in the section of the STIRPAT framework. The model used to identify and investigate the core determining factors of carbon dioxide emissions in Swedish municipalities is specified in equation 3,
where I is the environmental impact, here measured by CO₂ emissions, is the affluence variable, measured by GRP per capita, is the population variable and represents urbanization and is measured by population density. Furthermore, is the variable representing the industry structure, computed as a location quotient index, represents human capital and finally is the dummy variable representing the metropolitan municipalities. e is moreover the residual term and the subscripts i is denoting the individual observations, here referred to the respective municipalities, and t indicate the different years. In order to be able to make hypothesis test of the individual impact of the variables, an additive model in logarithmic form is presented in equation 4.
₂= + + + + MR + e(4)
The β’s and the constant are the parameters to be estimated, where the coefficients, by using a log-log model, can be interpreted, in line with the ecological elasticity framework discussed in the STIRPAT framework, as elasticities. The coefficients are now representing the respective responsiveness of carbon dioxide emissions to changes in individual driving forces, holding all the other variables constant. More specifically, the β’s is the percentage change in CO₂ emissions from a 1% change in any of the explanatory variables, e.g. GRP per
capita, holding population, population density and the industry structure constant. Furthermore, a logarithmic specification promoted a normal distribution of the variables. The
subscripts indicating the respective municipality and year are excluded in equation 4 to obtain a clearer model. In addition, the independent variables are moreover regressed against CO₂ per capita and the model is specified in equation 5.
₂ = + + + + MR + e(5)
Furthermore, in line with previous studies, a reduced form model that only consists of two explanatory variables is applied to check for a non-monotonic relationship between GDP per capita and carbon dioxide. The equation includes a new variable, the quadratic form of GRP per capita to examine whether an inverted U shaped Environmental Kuznets Curve exists. The specific model is depicted in the equation 6,
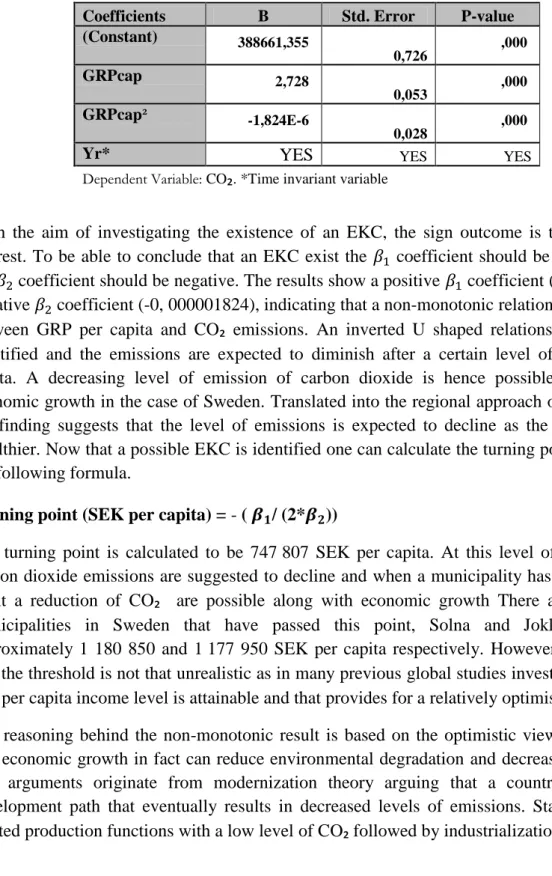
₂ = + + ² + (6)
where and has the same interpretation as before and ² is the added variable representing the quadratic form of GRP per capita. Here only the sign outcome of the coefficient is of interest to investigate the existence of an EKC. A negative sign of is indicating a non-monotonic relationship between the emissions and the level of income and suggests a subsequent decrease of CO₂ as an economy gets wealthier. If an EKC is found one is furthermore able to calculate the possible turning point.
Equations 4-6 are regressed using the methodology described previously and the next section presents the results and analysis of the empirical study.
6
Empirical results and analysis
This chapter presents and analyzes the empirical findings and the results obtained in the conducted study. The results from the three regressions are discussed, as well as the descriptive statistics. In relation to the EKC and the STIRPAT model, the discussion and interpretation of the results is in line with the previous literature that was presented in the theoretical introduction to the thesis. In addition, a section concerning the validity of the study is also depicted in the following section. The first section shortly presents a summary of the collected data.
6.1
Descriptive statistics
The descriptive statistics is showed below in table 2 and the purpose is to get an overview of the data and show the respective mean values and standard deviations for the variables. The number of observations is 1160 for all variables. Furthermore, since this study is only concerned with Sweden, and it includes the total number of municipalities in Sweden, it does not use a sample but actually deals with the entire population of interest. This allows for making reliable inference about the population coefficients and a general interpretation of the results is applicable for Sweden as a whole.
Obviously since all the municipalities are included in the study, there is a great variability in the observations and the standard deviations are rather high for all the variables. The smallest municipality in terms of population density only consists of 0, 2 people per km², whereas the highest density is 4307, 8 people per km². Similar findings hold for the other variables as well. The manufacturing index range between 0, 07 and 3, 71, signifying a great variability in the industry structure as well. The reference base is 1 in the sense that it is indicating that the size of the manufacturing sector is proportional to the weight of manufacturing of total industry in the whole country. Since some municipalities clearly have much higher weight of manufacturing industry than others, the question whether that subsequent leads to higher emissions of CO₂ is motivating.
Table 2 Descriptive statistics
Descriptive Statistics
N Minimum Maximum Mean
Standard Deviation CO2 1160 8931,68 4300827,00 177327,67 381468,30 CO2cap 1160 ,584 279,002 6,622 12,657 GRPcap 1160 94600,25 1180849,05 261273,56 110438,47 POP 1160 2516,00 810120,00 31551,97 61004,04 POPden 1160 ,20 4307,80 129,95 437,99 MI 1160 ,073 3,707 1,336 ,707 HC 1160 ,040 ,301 ,087 ,040 MR 1160 0 1 ,010 ,101 Valid N 1160
6.2
Regression results
This section presents the regression results for the modified STIRPAT model, equation 4, the CO₂ per capita model, equation 5, and the reduced formed model displayed in equation 6. The latter one investigates the relationship between CO₂ emissions and economic growth more deeply in the Environmental Kuznets Curve framework.
The regression results for the first model, investigating the relation between CO₂ emissions and the explanatory variables derived from the STIRPAT model that was depicted in the former section, is showed below in table 3. The majority of the explanatory variables except the metropolitan dummy variable and the human capital variable are significant at a 1% significance level since all the p-values are smaller than an α level of 0, 01. The fit of the model is good as the adjusted R², of 0, 77, is fairly high. This indicates that the chosen model is appropriate and that the applied explanatory variables explain 77% of the CO₂ emissions in Swedish municipalities. Individual interpretation of all the β coefficients is presented next.
Table 3 Regression results, equation 4
In the case of GRP per capita, the coefficient of 0,553 indicates a positive relationship between the level of income per capita and the carbon dioxide emissions as expected. The relationship is however less than unity and can be interpreted in the ecological elasticity framework as follows. A 1% change in GRP per capita increases the CO₂ emissions by 0,553%, holding population, population density, industry structure, human capital and metropolitan region fixed. The finding is hence in line with previous cross-national studies arguing that the level of affluence has a positive relation to the environment and the emission of CO₂. Although, previous global studies Fan et al. (2006) have showed an approximately proportional relationship and Dietz and Rosa (1997) among others, has identified an even greater impact of affluence. In contrast is the relationship for Sweden not that strong, which indicates a fairly large difference in the effect of income per capita. Previous regional studies, Szutkowski (2010) and Auffhammer (2004), has on the other hand showed more similar results, indicating that low, middle and high income countries may influence the CO₂ emissions quite differently.
Coefficients B Std. Error P-value
(Constant) -4,976 0,9786 0,000 LNGRPcap 0,553 0,0853 0,000 LNPOP 0,973 0,0358 0,000 LNPOPden -0,111 0,0216 0,000 LNMI 0,116 0,0367 0,002 LnHC -0,131 0,0835 0,118 MR 0,190 0,0987 0,054
Yr* YES YES YES
It can however be stated that a municipality in Sweden with a higher level of GRP compared to another, is expected to have a higher level of CO₂ emissions as well. The reasoning behind this is based on the arguments put forward in the theoretical framework, concerning the effects of industrialization. Economic development leads to a higher demand for more fossil fuel intensive goods and subsequently to heavier production that requires both more energy and transportation. Furthermore, a higher level of affluence, in terms of increased income, generates a higher consumption demand in general. Subsequently these actions lead to more waste and a pressure on the environment resulting in higher levels of CO₂ emissions. GRP per capita is hence one significant variable determining the level of CO₂ emissions in the Swedish municipalities. The continued development of the relationship in terms of economic growth and the relation to the suggested EKC hypothesis is presented in a later section. Next, the population variables are depicted.
The population size is significant as well and it is also positively related to carbon dioxide emissions. However, the β coefficient is 0, 973, hence population has in contrast to GRP per capita, almost a proportional relationship to CO₂ emissions. Interpreted in percentage terms, a 1 % increase in population increases the emissions of carbon dioxide emissions in Swedish
regions by approximately 1 %, holding all the other variables fixed. The unit elastic relationship is hence in line with expectations and also a large number of studies conducted
both on a global and local scale, e.g. York et al. (2003) and Szutkowski (2010) respectively. It can therefore be argued that population is a major driving force of the carbon dioxide emissions in Swedish municipalities and the underlying reasons is based on the arguments presented in the theoretical framework. According to previous literature are increasing population resulting in a subsequent increase in burning of fossil fuels, due to the simple arithmetic effect of more people demanding energy. Increased need for energy, both in industry production, in households and for transportation results in turn in increased emission of carbon dioxide. On the other hand, as mentioned before, some studies (Seldon and Song, 1994) argues that population in fact has a negative relationship to environmental degradation. In the case of carbon dioxide emissions, (Martinez-Zarzosa, 2010), found a negative relationship to urbanization. In relation to this, the result of the second population variable is discussed next.
The second population variable, representing urbanization is measured as population density as defined before. It has a β coefficient of -0,111 and is hence negatively related to the carbon dioxide emissions in Swedish municipalities. The variable is significant on a 1% significance level as well, however the magnitude of the effect is rather small. Interpreted in the elasticity framework is a 1 % increase in population density decreasing the level of carbon dioxide emissions only by 0,111%, holding all the other variables constant. In spite of that, it is the sign outcome that is interesting in this case. Urbanization is found to have a positive relation to CO₂ emission in a number of previous studies and a similar result was expected for this study as well. Opposite of the expectation the result indicates a negative relationship and as mentioned above, this finding is however in line with one previous study by Martinez-Zarzosa (2010). Martinez-Zarzosa defined urbanization as the percentage of urban population and in contrast to other global studies that has found a positive relationship,