by
v.v.
Salomonson and W.E. MarlattTechnical Paper No. 120 Department of Atmospheric Science
Colorado State University Fort Collins, Colorado
Anisotropic Solar Reflectance over White Sand, Snow, and Stratus Clouds
by
Vincent V. Salomonson and
William E. Marlatt
Department of Atmospheric Science Colorado State University
Fort Collins, Colorado February, 1968
Snow, and Stratus Clouds Abstract
Integrated directional reflectances and relative an-isotropy were measured over stratus clouds, snow, and white gypsum sand using the NIMBUS F-3 medium resolution radio-meter (MRIR) and a silicon-cell pyranoradio-meter mounted on a Piper Twin Comanche. Reflectances in the 0.2-4.0 and 0.55-0.85 micron portions of the solar spectrum were investi-gated. Eight flights were completed in different geo-graphic areas over stratus clouds of varying thicknesses. Three flights were made over snow in two different local-ities and five flights were made over white sand found in the White Sands National Monument, New Mexico.
The greatest anisotropy in. scattered radiation was ob-served over stratus clouds. This anisotropy was composed of strong forward scattering and less pronounced back scat-tering. The anisotropy observed in the radiation reflected from snow was primarily due to specular reflection in the forward direction. Reflection back toward the sun was the predominant feature in the reflectance distributions ob-served over gypsum sand. The results demonstrate the inter-action of the spectral reflectivity of the surface, the spectral response of the instrument, and the spectral char-acter of the energy impinging upon the reflecting surface.
Anisotropic Solar Reflectance Over White Sand, Snow. and Stratus Clouds
1. Introduction
One of the important advantaqes of the meteorological satellite is that it provides a means whereby the distribu-tion of emitted terrestrial energy and reflected solar en-ergy can be monitored over large portions of the earth's surface. In the case of reflected solar enerqy, however, the upward flow of energy is not the same in all directions. In order to determine the amount of energy reflected in all directions, it is necessary to either measure the reflected solar energy in all directions, or to make one measurement and combine it with a prior knowledge of the directional character of the reflected energy. Since present meteoro-logical satellite systems are not capable of measuring re-flected energy in all directions simultaneously, the need of an improved knowledg~-6f iurfa~~~-~eflection characterR istics has prompted the research reported here.
Bandeen et. ale (1965) used satellite measurements to estimate the earth's albedo. In that study it was neces-sary to assume that the reflection was isotropic and inde-pendent of wavelength. When these assumptions were used the resultinq value of annual planetary albedo did not bal-ance the corresponding values of emitted thermal radiation. Bandeen found it necessary to apply a correction factor to the measured planetary albedo in order to achieve this
balance. Viezee and Davis (1965) have also reported on dif-ficulties encountered in using satellite measurements to obtain the albedo of cloudy regions on earth.
Measurements have shown that the solar radiation re-flected by many surfaces on the earth is definitely aniso-tropic. Laboratory measurements have been conducted by Coulson et. al. (1965) and Hapke and Van Horn (1963) which show the anisotropy in energy reflected from soils and
vegetation. Bartman (1967) and Kozlov and Federova (1962), using balloons and airplanes respectively, have measured the anisotropy in the· solar energy reflected from clouds and snow fields.
This paper summarizes measurements made from an air-plane with a radiometer originally designed for a meteoro-logical satellite. Because of the radiometer construction and operation and the lateral and vertical mobility of the airplane, the resulting reflectance measurements cover a greater range of directions over a reflecting surface· than
is possible with many other instruments and means of con-veyance. Results are given for three highly reflective surfaces: snow, white sand, and stratus clouds. It will be seen that the high reflectivity is achieved in a differ-ent manner for each surface and to a varying degree in dif-ferent regions of the solar spectrum.
3
A Piper Twin Comanche was used as a platform for the measurements. This airplane is capable of flying to
alti-tudes up to 9,000 meters and maintaining cruising speeds of 80 meters per second.
The radiometer used for these measurements was the NIMBUS F-3 medium resolution radiometer (MRIR)*. Of the five channels available on the radiometer, only results from two of the channels will be discussed here. These two
channels measure energy in the O.2-4.0~ and 0.55-0.85~ por-tions of the solar spectrum. The 0.2-4.0~ bandpass will be referred to as the broad bandpass and the 0.55-0.85~
bandpass as the narrow bandpass. The radiometer uses a rotating aluminum mirror to scan across surfaces within the view area. The instantaneous field of view is 50 milliradians in cross-section. The manner in which the
radiometer was mounted on the airplane and its direction of scan are shown in Fig. 1. A closer view of the radiometer
itself is available in Fig. 2. The time constant of the radiometer is 0.02 seconds.
The radiometer was built and calibrated by the Santa Barbara Research Center. Several calibration curves (re-flectance versus voltage) were obtained for the periods corresponding to the measurements discussed here. The
method of calibration has been discussed by Bartman (1967).
*
Any information provided in this paper pertaining to the manufacture of instruments is for the reader'sinforma-tion only and does not indicate endorsement by the authors.
ROTATION OF THE RADIOMETER MIRROR AS MOUNTED ON PIPER TWIN COMANCHE
MIRROR " -" FUSELAGE OF AIRPLANE.c ~ • ~//'/ _' -- /' /" _ - /~/>: /:'--- SqAN M'!iROR. t¥' " ' " , , / /'... / ,... ... ~ -:;"n ----= !! ;~:'.'l.: ' ,. '" .,... .... ', .. ' i'::::;-;: ~ .... " ""\ ,,'\ ','" \ \ \~ \ 1 -. \'1', J ~ '. " \ . . ' / I " ! J '-=:.;~
\, \
~, . :
1/1i -::
L: ~.:, II ~ .HOUSING FOR THE - -- . "
~
, .-::-------RADIOMETER ON THE AIRPLANE DETECTOR~ FRONT OF AIRPLANE
CHOPPER, ETC. ..
F;Q. 1. A sketch showinq how the NIMBUS MRIR was mounted on a Piper Twin Comanche.
Fig. 2.
5
NIMBUS F-3 medium resolution radiometer (MRIR)
The measurement errors associated with a current calibration were ±2%. This excludes the errors associated with the
calibration of the albedo source used in the calibration of the MRIR.
The signal produced by the MRIR was recorded on a high speed strip chart recorder. The error in the recorded
signal was 0.2% of full scale. The response time of the recorder was 0.1 seconds.
The incoming solar energy was measured with a 2w
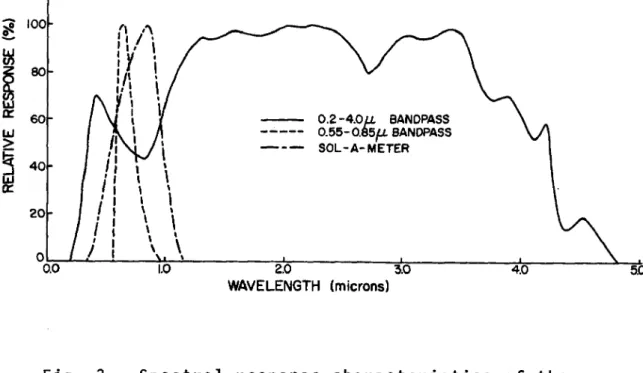
steradians instrument by mounting a Sol-a-meter (silicon-cell) on the top of the Piper Twin Comanche over the center of qravity of the aircraft. Physical and spectral charac-teristics of the Sol-a-meter are described by Dirmhirn (1967) and Selcuk and Yellott (1962). In order to insure that the Sol-a-meter would give accurate measurements of the total incoming solar energy, it was calibrated against an Eppley pyrheliometer. This calibration of the Sol-a-meter was checked before mounting it on the airplane and after it was taken off the airplane. The Sol-a-meter calibration was also checked in place on the airplane by using a spe-cially constructed rotating aircraft test stand. No drift in calibration was observed for the Sol-a-meter during the measurement period. The error associated with the readings obtained with this instrument was ±S%. The spectral re-sponse curves for the Sol-a-meter and the two MRIR channels are shown in Fig. 3.
i:e !... ~
~
a= w ~5
~ 7 100 80 60 0.2 -4.0ts BANDPASS 0.55-0. 5fJ- BANDPASS SOL - A- METER 40,
I \ I 20 \ \ \ \ \ 0 0.0 1.0 2.0 3.0 4.0 WAVELENGTH (microns)Fig. 3. Spectral response characteristics of the Sol-a-meter (silicon cell) and the two channels on the NIMBUS F-3 MRIR responding to solar radiation.
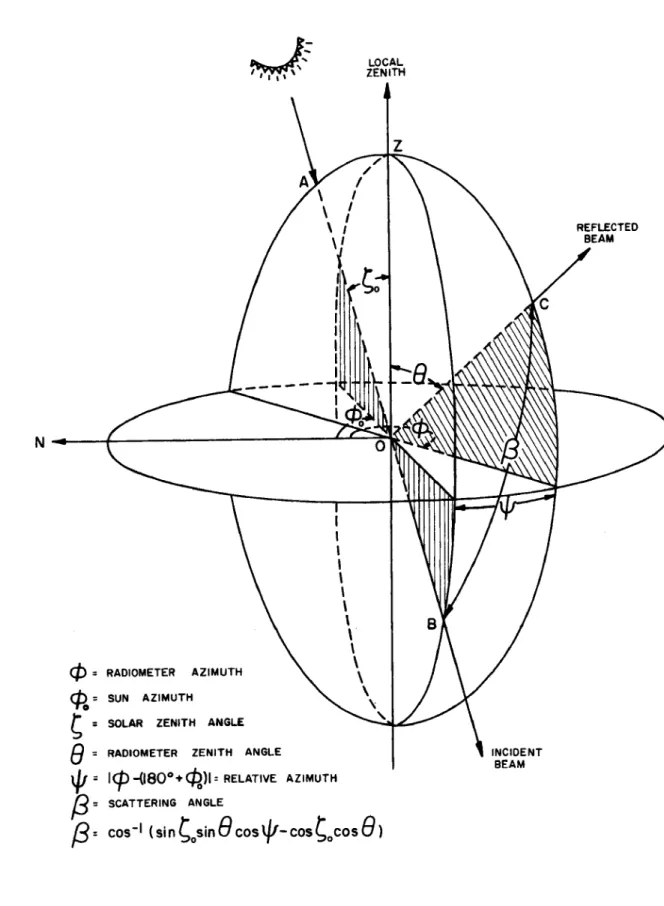
The radiation geometry employed in this analysis is shown in Fiq. 4. The principal plane is described by AZBOA. The scattering plane is described by SOCS.
For these measurements it was assumed that the surface being viewed by the radiometer was uniform in topoqraphy and composition. The second assumption was that the scat-tering or reflection of solar enerqy was symmetrical with respect to the principal plane. The actual observations showed that these assumptions were best satisfied in the case of white sand followed in order by stratus clouds and snow.
The calibration curves of the MRIR were based on the definition that the reflectance is the ratio of the radi-ance observed by the radiometer to the radiradi-ance the radio-meter would observe if its field of view were filled com-pletely by an ideally diffuse reflector of unit reflecti-vity illuminated by the solar constant at normal incidence. This relationship can be expressed as
rl = N(~ ,¢ ;e,¢)/N
0 0 0
SOA ;s the solar spectral irradiance impinainq upon the earth at the mean distance between the sun and the earth.
~A is the spectral response of the instrument. NA is ex-pressed as beinq eauivalent to
cP
= RADIOMETER AZIMUTH c:f:>o = SUN AZIMUTHS
= SOLAR ZENITH ANGLEe
= RADIOMETER ZENITH ANGLE9
LOCAL ZENITH
~ = Ic:p -{180°,. cPoll = RELATIVE AZIMUTH
{3
= SCATTERING ANGLEf3
= COS-I (sin Sosine
cos o/-coSSocose
1Fig. 4. Radiation geometry
INCIDENT BEAM
( 2 )
where SA is the specular component of SOA normal to, and actually impinging upon, the reflectinq surface. It will prove meaningful to define another reflectance that applies for any solar zenith angle, ~ , as
o
r
=
rl/cos~ .o ( 3)
It is also useful to define an integrated directional re-flectance (r
D) that is equivalent to the albedo measured by a 2~ pyranometer. This integrated directional reflectance has the mathematical form,
Ncose sine ded<p
(4) N cos~ cose sine ded<p
o 0
Since N is an isotropic radiance, the expression above can o be rewritten as
( 5)
The bar on the reflectance (~) is used to indicate that it is an average of readings taken by the radiometer at var-ious combinations of e and <p.
4. Field measurements and analysis
The various values of radiometer zenith angle (e) illustrated in Fig. 4 were obtained by rotating the scan-ning mirror of the radiometer. Only radiometer zenith
11
angles less than or equal to 75° are presented so as to eliminate readings from outside the tarqet boundary. Vary-ing values of relative azimuth (~) were obtained by changing the heading of the aircraft at predetermined increments rel-ative to the azimuth of the sun (~). For the first few
°
flights the relative azimuth was varied in 30° increments, thus requiring a total flight time of forty to fifty min-utes. In later flights the relative azimuth was varied by 45° increments. The latter precedure shortened the flight time to less than thirty minutes and also reduced the var-iation of the solar zenith angle (s ) during each flight.
°
For each value of relative azimuth, the airplane was flown at a prescribed heading until the radiometer com-pleted ten scans. Occasionally, however, it was necessary to limit the number of scans to less than ten due to the limited areal extent of the reflecting surface.
Two factors were considered in choosing the altitude of flight over a surface. On one hand, it was important that the reflecting surface fill the field of view for 8< 75°. On the other hand it was desired that the radiometer field of view integrate over as much of the surface as pos-sible. Over surfaces with limited areal extent, the second factor was compromised in favor of the first. Flight al-titudes of the aircraft above the surfaces varied from 120 meters over a snow surface to 1200 meters over stratus
clouds. This means that when 8~00, the instantaneous field of view ranged roughly in diameter from 6 to 60 meters.
Once the signal from the radiometer was recorded on an analog strip chart, it was then necessary to obtain reflec-tance values (rf) corresponding to predetermined values of 9. Through the use of an overlay grid, the appropriate values of reflectance were obtained from the analog vol-tage trace on a strip chart for every fifteen degrees of radiometer mirror rotation (radiometer zenith angle). The position of the mirror was determined from a pulse gen-erated on the analog trace by a small light installed in the radiometer housing at 9=180°. The recorded voltages were converted by computer to reflectance and the average, maximum, minimum and standard deviation values were deter-mined for each pass of the airplane over the reflecting surface. The range in average values at particular values of 9 and ~ for successive passes over the same area gives an indication of the relative uniformity of the results
that have been obtained. Representative values of this parameter will be given for each flight discussed.
An analysis of the errors involved revealed that the total error in r' is ±3%. Where large variations in the re-flectance occurred rapidly, particularly for e > 60°, the error is somewhat larger due to the difficulty in deter. mining the exact value of reflectance corresponding to a
particular value of 9. The error in values of r is strongly dependent on the error in the determination of the solar zenith angle. For an error of ±lo in any individual esti-mate of ~ , the error in r ranqes from ±3% at ~ =0° to ±20%
1 3
at r, =80°. During any flight the solar zenith anqle varied
°
from 1_10° depending on the time required for the flight and the time of day. The reflectances, r, were computed using the solar zenith angle aopropriate for each separate pass of the airplane over the reflecting surface. The time required for each pass was approximately 1.5 minutes.
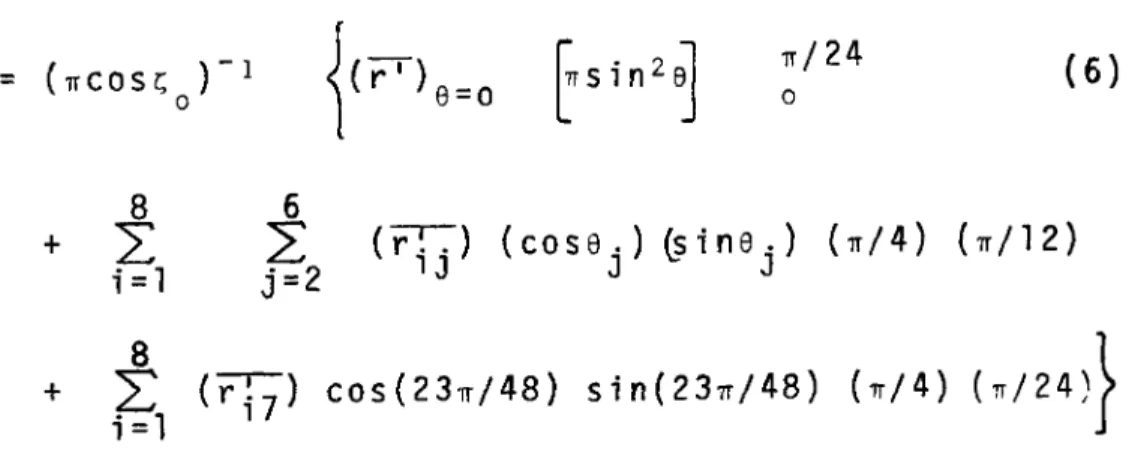
To obtain a value of integrated directional reflec-tance (rO) for each flight over a particular surface, it was necessary to use a finite differencing procedure that would utilize reflectance measurements taken at fifteen degree increments in 8 and thirty or forty-five degree increments in ~ over the 2TI steradians above each surface. As an example, the finite differencing procedure used for 45° increments in w will be given. Eq. (5) was broken into three integrations and then into summations in order to arrive at the final value of integrated directional reflec-tance. In the equations below 81
=
0 degrees, 82 = 15 de-grees, ... 8
7
=
90 degrees.{r
JTI/24(rr) COS8 sin8 dedw
°
f21T [11'1\"/24
(rr)
COS8 sine d8d~j 0 n/24
('TrCOSI'; )-1
~(f'T}9=O
fSin2 eJ 'Tr/24 (6) = 0 0 8 6 +2:
2:
(r:.-) (cose.) (?ine.) ('Tr/4) ('Trjl2) i=l j=2 lJ J J 8 (./4) ('/24)}+
L
(ri7) cos(231T/48) sin(23n/48)i = 1
5. Results
Table 1 lists the flights made over stratus clouds, snow, and white gypsum sand. Columns 5-7 give the altitude (above mean sea level) of the aircraft, the height of the aircraft above the reflecting surface, and the thickness of the stratus clouds. In the cases of white sand and snow the heiqht of the reflecting surface above sea level was determined by topographic maps. The altitude of the cloud tops was determined by the aircraft altimeter. The thick-' ness of the clouds was usually determined by knowing the height of the top of the clouds and the height of the bases reported by nearby weather stations. In the case of stratus clouds over water (11 June and 17 July 1965), one penetra-tion of the cloud layer was made by the aircraft during each flight and the height of the top and bottom of the layer determined from the aircraft altimeter. This was not done for stratus clouds over land due to the low altitudes involved.
Column 9 of Table 1 qives the incoming enerqy measured by the Sol-a-meter at the too of the airplane. The value
of incoming energy was used to evaluate how much atmo-spheric attenuation of the incominq solar energy had taken place. In column 14 the integrated directional reflectances for the broad band channel have been corrected in this way for atmospheric attenuation, thus reducing differences due to the varying atmospheric conditions in different local-i tlocal-ies. This correction can mathematically be expressed as
Corrected (rO)B
=
(S/SI) (rO)B'S I is the total incoming energy measured by the Sol-a-meter
and S is the normal component of the solar constant. For solar zenith angles exceeding 70 degrees, the Sol~a-meter
measurements are not reliable. This is the reason for some missing data in Table 1.
Columns 11 and 13 give the ratio of the integrated di-rectional reflectance (r O) to the average value of reflec-tance
(r)
observed at e = 0°. These results give an idea of the error that one could make in an estimate of albedo(integrated directional reflectance) obtained by taking only one reading of reflectance at one radiometer zenith angle (e=Oo) and ignoring the anisotropy in reflected solar radiation. The ratio will be referred to as the relative anisotropy. Values of rO/(T)o are given for both the broad and narrow bandpasses.
(T)
represents an average of as°
many as 130 values of reflectance per flight.
Column 15 (col. 10 - col. 12) illustrates the com-bined effects of atmospheric attenuation and the spectral
1 7
characteristics of surface reflectivity, incoming energy, and bandpass filters on the integrated directional reflec-tances measured by the broad and narrow bandpasses. In-tegrated directional reflectances for the broad and nar-row bandpasses are given in columns 10 and 12 respectively.
Figs. 5-7 show reflectance distributions observed over stratus clouds at three different locations. Figs. 8 and 9 represent the directional reflection characteris-tics observed over snow and white gypsum sand. Parts (a) and (b) of each figure show the ratio of the reflectance
(~) to (~)o for the narrow and broad bandpasses. Part (c)
of each figure shows the variation of
r
for e~75° and~
=
0° and 180°. The number of readings comprising each plotted point, other than e=
DOt ;s given in part (c)along with a representative value of the range in average values of reflectance obtained from successive passes over the reflecting surface.
6. Discussion of results
Several features of Figs. 5-9 are of importance. In the cases involving scattering from stratus clouds, (Figs. 5-7) strong forward scattering is observed along with lesser backscattering. For stratus clouds, the minimum
reflec-tance occurs when the radiometer zenith angle is near 0°,
The degree of forward and backscattering is not as large as that predicted by theoretical results involving single
23
Differences are certianly to be expected, however, since the experimental results represent integrated effects over a range of wavelengths accompanied by multiple scattering, varying drop-size distributions, and varying optical thick-nesses. Feige1'son (1966, chapter 2) discusses the impor-tance of these factors on the ref1ecimpor-tances observed over stratus clouds. The relative importance of each of the factors for the cases presented here ;s currently being studied by the authors.
The reflection from snow and white sand was not ob-served to be as anisotropic as the scattering from stratus clouds. This is born out quantitatively in columns 11 and 13 of Table 1. The magnitude of the relati"ve anisotropy in both cases is roughly the same magnitude, but the re-flection characteristics of the two surfaces were observed to be distinctly different. The reflection from snow is greatest in the forward direction and is largely specular in nature (Fig. 8). The reflection from white sand, how-ever, is usually largest in the direction back toward the sun (Fig. 9). A maximum in the reflection from white sand in the forward direction was only observed when the solar zenith angle was quite large (~
=
76_82°).o
From columns 11 and 13 of Table 1 it may be seen that anisotropy in the reflected and/or scattered radiation in-creases as ~o increases. This result is particularly evi-dent in the case of stratus clouds. The relative aniso-tropy for stratus clouds is very close to unity when ~ is
small and values as larae as 1.73 are obtained for large solar zenith angles. The data in column 14 further indi-cates that the integrated directional reflectance over stra-tus clouds increases with increasing solar zenith angle. This conclusion is supported by results given in Feigel 'son
(1966, page 107).
It was observed in this study that the underlying sur-face has an influence on the magnitude of the
reflec-tance from stratus clouds observed by pyranometers and
radiometers. This is suggested most strongly when comparing the results for stratus clouds over water. in column 14
with the result given for stratus clouds over snow near Logan, Utah.
The thickness of a cloud also makes a difference in the magnitude of the reflectances observed. This may be seen in the flights near San Francisco on 11 June and 17 July 1965. From columns 14 and 15 for the flights near San Francisco and Bakersfield, California, the reflectivity may be seen to increase markedly as the thickness of the clouds increases. The data further suggests that the change in reflectance with increasing cloud thickness is less rapid as the clouds become thicker. These conclusions and the data in column 15 agree rather well with those
published by Neiburger (1949).
The results in column 15 which show the differences in reflectance measured by the broad and narrow bandpasses illustrate very effectively that ref1ectances vary markedly
25
depending on the spectral characteristics of the incoming energy, surface reflectivity, and bandpass characteristics. The influence of the underlying surface is evident again
in the data for stratus clouds. The difference in the band-pass reflectances for stratus clouds over water is clearly less than that determined for other cases, particularly where stratus clouds were underlain by snow. In general, the data in this column is supported by measurements of spectral reflectivity representative of these surfaces re-ported by Hovis (1966), Bartman (1967), and Dirmhirn
(1967). The apparently anoma.lous result in this column for 10 December 1966 (s =82-86°) is attributed to the
°
appearance of shadows or possibly to insufficient accuracy in the determination of the solar zenith angle.
When the correction for vary;n9 atmospheric conditions using the incoming energy measured by the Sol-a-meter was applied to the broad bandpass integrated directional re~
column 14. Furthermore, the magnitudes of these broad bandpass reflectances agree rather well with total albedo values for snow and stratus clouds given in the Smithsonian Met r oro1ogical Tables (List, 1963, pp. 442-443).
7. Summary
The results presented here for three highly reflective natural surfaces show that the nature of the reflection or scattering can vary in several ways depending on the type
and character of the surface involved. Over stratus clouds, strong forward scattering was observed accompanied by lesser backscattering. A measure of the relative anisotropy in scattered radiation over stratus clouds showed that the reflectances observed were the most anisotropic over this surface of the three studied. Anisotropy in the reflected solar radiation was observed to decrease as the solar zenith angle became smaller.
Snow and white gypsum sand exhibited less anisotropy in the reflected solar radiation than was observed over stratus clouds.' The relative anisotropy was very nearly the same for both surfaces. The largest reflectance over snow was observed in the forward direction and this ap-peared to consist largely of specular reflection. In con-trast, maximum reflectance observed over white sand was in the direction back toward the sun~
The difference in the total reflectances measured by the O.2-4.0~ and O.55-0.85u bandpasses of the MRIR varies between surfaces. Over the surfaces studied here, the differences were greatest over snow and least for stratus clouds over water. The results are indicative of how the measured integrated reflectance is dependent on the spec-tral reflectivity of the surface being observed as well as the spectral nature of the energy impingina on the surface and the filter characteristics of the instrument.
A comparison of integrated directional reflectance val-ues obtained over stratus clouds shows that the reflective
27
properties of the underlying surface can exert considerable influence on measured reflectances. The reflectance of stratus clouds was observed to increase as the thickness of the cloud increased.
Acknowledgements. Appreciation is expressed to the
National Aeronautics and Space Administration for funding this research through Contract NASr-147.