Full Terms & Conditions of access and use can be found at
https://www.tandfonline.com/action/journalInformation?journalCode=cjen20
Journal of Engineering Design
ISSN: 0954-4828 (Print) 1466-1837 (Online) Journal homepage: https://www.tandfonline.com/loi/cjen20
Visual representations for communication
in geographically distributed new product
development projects
Paraskeva Wlazlak, Yvonne Eriksson, Glenn Johansson & Peter Ahlin
To cite this article: Paraskeva Wlazlak, Yvonne Eriksson, Glenn Johansson & Peter Ahlin (2019) Visual representations for communication in geographically distributed new product development projects, Journal of Engineering Design, 30:8-9, 385-403, DOI: 10.1080/09544828.2019.1661362
To link to this article: https://doi.org/10.1080/09544828.2019.1661362
© 2019 The Author(s). Published by Informa UK Limited, trading as Taylor & Francis Group.
Published online: 09 Sep 2019.
Submit your article to this journal
Article views: 236
View related articles
2019, VOL. 30, NOS. 8–9, 385–403
https://doi.org/10.1080/09544828.2019.1661362
Visual representations for communication in geographically
distributed new product development projects
Paraskeva Wlazlaka, Yvonne Eriksson b, Glenn Johanssona,band Peter Ahlinc aSchool of Engineering, Jönköping University, Jönköping, Sweden;bSchool of Innovation, Design and Engineering, Mälardalen University, Eskilstuna, Sweden;cHusqvarna AB, Huskvarna, Sweden
ABSTRACT
This study addresses the role of visual representations in support-ing communication between an R&D team and geographically dis-tributed suppliers for a new product development (NPD) project. It specifically focuses on the design and use of visual representations as a feasible way for communication between the distributed actors when they face communication challenges originating from differ-ences in skills in the English language, but also from differdiffer-ences in work experiences. Relying on empirical materials from a Swedish manufacturing company in the mechanical engineering industry, this paper makes the following contributions to the literature. First, it shows that visual representations are effective boundary objects able to support process-oriented and product-oriented communi-cation in distributed NPD projects. Second, it illustrates that visual representations do not necessarily have to follow graphic design principles, but can still be effective if distributed actors share the same project context. Finally, it highlights the need for a dynamic and context-dependent perspective on communication in NPD projects.
ARTICLE HISTORY
Received 14 September 2017 Accepted 26 August 2019
KEYWORDS
New product development; geographical distribution; communication; visual representation; annotations
1. Introduction
Effective communication is essential for new product development (NPD) projects because it provides the capabilities for manufacturing companies to develop, produce, and deliver lucrative products to the market (Frishammar2005; Kleinsmann and Valkenburg2008; Kleinschmidt, De Brentani, and Salomo2010). For example, communication between dif-ferent actors involved in NPD, such as R&D and manufacturing engineers, is important to ensure the transfer of a newly designed product from the laboratory environment to production but also challenging (Lakemond et al.2012). The underlying reason is that com-munication may be disrupted by the coexistence of differences in goals, perspectives, use of terminology, among others, between actors (Bechky2003; Hisarciklilar and Boujut2007), which results in effects such as late product design changes, tolerance problems, need for extra testing, and product re-design cycles (Ulrich and Eppinger2016).
Shorter product life cycles, intense competition, the diverse geographic location of R&D teams and manufacturing sites, and globally distributed suppliers are a reality for
CONTACT Paraskeva Wlazlak paraskeva.wlazlak@ju.se
© 2019 The Author(s). Published by Informa UK Limited, trading as Taylor & Francis Group.
This is an Open Access article distributed under the terms of the Creative Commons Attribution-NonCommercial-NoDerivatives License (http://creativecommons.org/licenses/by-nc-nd/4.0/), which permits non-commercial re-use, distribution, and reproduction in any medium, provided the original work is properly cited, and is not altered, transformed, or built upon in any way.
many manufacturing companies today (Gustavsson and Säfsten2017). Therefore, the geo-graphical distribution among actors involved in NPD projects has the tendency to amplify communication challenges (e.g. Lakemond, Berggren, and Van Weele2006; Kleinsmann and Valkenburg2008; Säfsten et al.2014) by complicating communication during an NPD project due to absence of physical proximity, differences in time zones and cultures, as well as differences in linguistic skills among the involved actors (Barczak and McDonough
2003; Marheineke, Habicht, and Möslein2016). Further, information and communication technologies (ICT), such as tele- and videoconferencing, have been emphasised as means to support communication in distributed contexts (e.g. Ceci and Prencipe2013). How-ever, extant studies also show that ICT cannot overcome all communication challenges originating from the geographical distribution between actors (e.g. Dooley and O’Sullivan
2007).
Other studies (e.g. Hietikko and Rajaniemi2000; Crilly, Moultrie, and Clarkson2004; Gold-schmidt2007; Cash, Dekoninck, and Ahmed-Kristensen2017) show that visual representa-tions, such as sketches (either handmade or computer generated) or drawings and pho-tographs, have key roles in supporting communication during NPD projects. Researchers (e.g. Carlile2002; Boujut and Blanco2003) refer to visual representations as intermediary or boundary objects that have the capacity to support communication in NPD projects. As research indicates that ICT does not overcome all communication challenges in distributed contexts and since visual representations have the potential to support communication, it seems plausible to assume that such representations may be relevant to use in distributed NPD projects. Still, literature offers limited insights regarding the use of visual represen-tations to support communication in geographically distributed NPD projects. The study presented in this paper is situated in such a distributed context, where an R&D team is located in Sweden and actors at the manufacturing site and the suppliers are based in China. The involved actors experienced communication challenges originating from dif-ferences in skills in the English language but also from difdif-ferences in work experiences. In the studied project visual representations were used to deal with the communication chal-lenges between the actors, leading to our first research question (RQ1) is: How can visual representations be used in a distributed context to support communication in NPD projects?
As the visual representations used were not produced by professionals in graphic design, a question can be raised whether the design of the visual representations per se influences their effectiveness in supporting communication. The literature on the visual perception and representation of data asserts that visual representations should rely on specific principles of graphic design to work in a specific context (Lupton and Phillips2015). Well-designed graphics can be defined as visual representations that follow elementary principles that support the perception of visual information such as hierarchy (the most important issues to address), clear distinction of colour, lines, shape, and size of typographs (Lupton2010; Mollerup2015). To ensure that visual representations work correctly in a specific context, the use of colour and icons need to be consistent when series of visual rep-resentations are devised. As such, the design of visual reprep-resentations affects their potential to act as boundary objects and support communication in distributed NPD projects. In other words, visual representations need to be legible to support communication (Lupton and Phillips2015). This leads to the second research question (RQ2): How does design of visual representations influence their potential to act as boundary objects in a distributed context to support communication in NPD projects?
By addressing the two research questions, this paper makes the following contribu-tions. First, it argues that both process- and product-oriented visual representations are effective means to support communication in distributed NPD projects via their roles as boundary objects. Prior research has mainly addressed the roles of boundary objects when actors are co-located (Bechky2003; Majchrzak, More, and Faraj2012). Second, it illustrates that visual representations do not necessarily have to follow graphic design prin-ciples to be effective if the distributed actors share project context. Finally, it highlights the need for a dynamic and context-dependent perspective on communication in NPD projects.
The remainder of this paper is structured as follows. Section 2 reviews the relevant lit-erature on visual representations and their design. Section 3 explains the research design and empirical materials used. Section 4 outlines the findings. In Section 5, the analysis is presented, and the final section draws conclusions.
2. Literature review
Here, the challenges related to communication in distributed NPD projects and potential use of visual representations as communication means are first addressed, while a second subsection focuses on the design of visual representations, including principles of graphic and annotation design.
2.1. Communication challenges and use of visual representations
Studies on communication in geographically distributed NPD projects have received atten-tion among scholars as well as practiatten-tioners because of the increased globalisaatten-tion in manufacturing industries (e.g. Eris, Martelaro, and Badke-Schaub2014). Geographical dis-tribution is associated with actors residing in different cities, countries, or continents, and working interdependently to accomplish a task (Barczak and McDonough2003; Hinds and Bailey2003). Research revealed communication frequency is reduced with increased geo-graphical distance (Allen, Tushman, and Lee1979; Sosa et al.2002). Moreover, communica-tion is disrupted not only by geographical distribucommunica-tion but also poor organisacommunica-tional bonds (Allen, Tomlin, and Hauptman2008), which decreases the probability of communication among actors even if they are in proximity.
Bergiel, Bergiel, and Balsmeier (2008) emphasise that communication in a distributed context is disrupted by a lack of facial expressions, vocal inflections, verbal cues, and ges-tures. Researchers argue that distribution brings about heterogeneity and is associated with a lack of shared context, familiarity, and friendship among distributed actors (e.g. Hinds and Bailey2003; Hinds and Mortensen2005). According to Cash, Dekoninck, and Ahmed-Kristensen (2017), the lack of proximity also reduces the possibility for visual obser-vation and informal contact, hence constrains learning across locations. Shared references to objects of interest are thus more challenging to establish, which might in turn obstruct effective communication on work tasks (Lakemond and Berggren2006; Ceci and Prencipe
2013). Some researchers even show that differences in work norms, cultures, behavioural expectations, and technologies disrupt communication patterns (Kleinsmann and Valken-burg2008; Eris, Martelaro, and Badke-Schaub2014). Other studies stress the importance of using ICT to communicate in geographically distributed contexts (Marheineke, Habicht,
and Möslein2016). While it is claimed that the use of virtual post-it notes and text chats sup-port the efforts to convey information and establish mutual understanding among actors in a distributed NPD context, research on ICT does not address how visual representations can be used to support communication among actors in a distributed NPD context. Prior research explored the use of visual representations in various domains, such as architec-ture and construction (Goldschmidt2007; Ewenstein and Whyte2009), mechanics (Carlile
2002; Boujut and Blanco2003; Goldschmidt2007; Eris, Martelaro, and Badke-Schaub2014), electro-mechanics (Cash and Maier2016), or even furniture design (Crilly, Maier, and Clark-son2008). For instance, Luck (2014) shows that visual representations are used to support communication at review-type meetings attended by co-located multidisciplinary actors. Such meetings rely on gestures and verbal messages to support the use of visual repre-sentations in negotiating and establishing effective communication (Becvar, Hollan, and Hutchins2008; Mortensen and Lundsgaard2011; Cash and Maier2016).
Communication using visual representations aims at improving NPD processes by sup-porting coordination and cooperation among all actors and between the R&D team and other stakeholders, such as suppliers (Letens, Farris, and Van Aken2011). Studies adopt-ing an interpersonal communication perspective elaborate on how visual representations mediate senders’ intentions and receivers’ understanding. However, they also show that transmitted messages are not always understood by the receiver as intended by the sender (Crilly, Moultrie, and Clarkson2004; Crilly, Maier, and Clarkson2008). According to Goldschmidt (2007), sketches are the media through which communication among mul-tidisciplinary actors occurs, allowing convergence to a single, mental model of product concept. Sketches are traditionally accompanied by explanatory verbal comments. Further-more, visual representations should have clearly defined purposes and be properly used (by both senders and receivers) to support effective communication.
Some researchers refer to visual representations as intermediary objects, which repre-sent an intermediate state of the finished products and facilitate upstream or downstream actors’ participation in NPD projects (Boujut and Blanco 2003). Visual representations also have been addressed in the literature on boundary objects (Star 1989; Koskinen
2005; Marheineke, Habicht, and Möslein 2016). Boundary objects are means of transla-tion used to form shared understanding between actors from different organisatransla-tional functions, i.e. boundaries, such as R&D and manufacturing (Carlile2002, 2004). Bound-ary objects are interpreted differently by the actors that belong to different bound-aries, and it is an acknowledgement and discussion of these differences that ensure establishment of shared understanding (Bechky 2003; Gustavsson and Säfsten 2017). To be effective the boundary objects need to possess certain features such as provid-ing shared language and concrete means of translatprovid-ing and learnprovid-ing about the differ-ences and interdependencies between the actors (Dougherty1992; Majchrzak, More, and Faraj2012).
Sketches, drawings, or simulations can be used to reconcile the diverse meanings implied by multidisciplinary actors (Bechky2003; Majchrzak, More, and Faraj2012). Pro-totypes can reconcile different actors’ viewpoints and thus support communication in NPD projects (Moultrie2015). Physical tangibility allows defining differences and interdepen-dencies when actors with different skills, knowledge, or locations communicate. Further-more, researchers (Carlile2002; Boujut and Blanco2003) indicate visual representations are used to negotiate interests and trade-offs among actors.
To conclude, prior research has emphasised the potential use of visual representations in NPD projects. However, less attention has been paid to the use of visual representations to support communication in geographically distributed NPD projects.
2.2. Design of visual representations
The literature on the visual perception and representation of data states that, for a visual representation to work in a context, its design needs to be based on certain conventions (Lupton and Phillips2015; Mollerup 2015). These conventions are based on the princi-ples of how to attract attention in visual representations, namely: (i) line (helps direct the eye); (ii) scale (creates emphasis); (iii) colour; (iv) repetition (helps place individual elements together); (v) symmetry; (vi) balance; (vii) hierarchy (helps user navigate); (viii) contrast (creates emphasis); (ix) direction; (x) typography (distinct font). Kostelnick and Hassett (2003, 163) elucidate how conventions structure visual language and emphasise that social dynamics, which actors develop and sustain in a given context, need to be investigated rather than the nature of those conventions.
Some studies propose using annotations combined with visual representations (sketches and pictures) to establish effective communication (e.g. Goldschmidt2007). For instance, Hisarciklilar and Boujut (2007) refer to semantic annotations as reusable (inter-pretable) by individuals in certain settings. Annotations together with graphical or textual representations (e.g. computer-aided design drawings or reports) typically complement a main document and are interpreted only in its context (Agosti, Bonfiglio-Dosio, and Ferro
2007). An annotation has two basic elements: (i) content, referring to the information it conveys, and (ii) anchor, indicating the reference point it is located (Li, McMahon, and New-ness2009; Marshall2009). Annotated documents and visual representations can be used for different purposes, such as indexing for technical information and support for coop-eration and communication in NPD projects (Hisarciklilar and Boujut2007). According to Boujut (2003), annotations resemble the boundary objects defined by Star (1989) because they stimulate negotiations between actors, which help establish a shared understand-ing of a situation or object. Annotations comprise not only another dimension of verbal communication but also a system of signs that assist in materialising the discipline-specific knowledge and cross-learning among various disciplines (Boujut2003). However, the rela-tionships between visual representations and textual communication are complex because verbal language influences the interpretation and main message of any visual representa-tion. Further, visual representations and verbal language are described by different symbol systems. Specifically, verbal language is crucial for interpreting shared information, where the sender must verbalise the content and purpose of the visual representation and the action required by the receiver (Eriksson, Johansson, and Björndal2011).
To conclude, prior literature states that, for a visual representation to work in a specific context, its design needs to follow certain conventions. These conventions follow principles of graphic and annotation design.
3. Research design and empirical materials
This section first introduces the research design, followed by a presentation of the empirical materials.
3.1. Research design
This study’s underlying idea is to engage in knowledge co-production (Chen, Wu, and Wu2013), where researchers and practitioners collaborate to identify solutions to real-world problems and, in parallel, generate new theoretical insights (Beech, MacIntosh, and MacLean2010). The research approach reflects engaged scholarship, defined as ‘a col-laborative form of inquiry in which academics and practitioners leverage their different perspectives and competencies to coproduce knowledge about a complex problem or phe-nomenon that exists under conditions of uncertainty found in the world’ (Van de Ven and Johnson2006, 803). This paper is thus co-authored by a team of three researchers and one industry representative, who acted as project manager for the studied project. The project is denoted as Project Beta to avoid disclosing the developed product. The involvement of the project manager as co-author and in the analysis allowed for firmly rooted findings, based on the collected empirical material and knowledge co-production that have both scientific relevance and practical value.
The empirical materials were collected through an exploratory, in-depth case study of an NPD project run by the co-authoring project manager, which was carried out in a distributed context where the R&D team, led by the project manager, was engaged in collaboration and communication with actors from a geographically distributed manufacturing site, as well as suppliers from the same region as the site. The product’s complexity, which implied interdependencies among the involved actors was a key motive for selecting the project as case study. In the studied project, a complex new product based on mechanics and com-bustion technology was developed and, due to the geographical distribution, it entailed communication across geographical boundaries.
The study design allowed for detailed insights into the activities, happenings, communi-cation patterns, among others, of the project (Eisenhardt1989; Voss, Tsikriktsis, and Frohlich
2002; Miles, Huberman, and Saldaña2014; Yin2018). One such happening, described in more detail below, was that the R&D team devised visual representations to overcome communication challenges with the distributed suppliers.
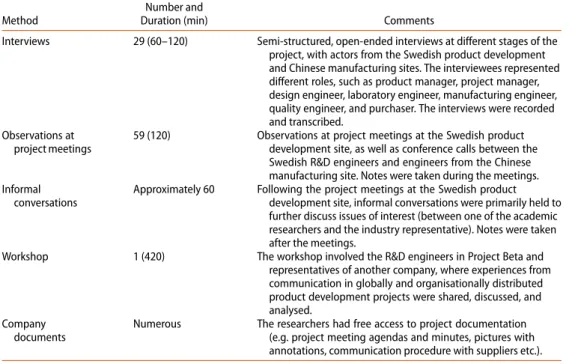
Project Beta was carried out by the Husqvarna Group, which is a globally leading pro-ducer of outdoor power products for forest, park, and garden care. The project was studied over a period of 3.5 years. Empirical data were continuously collected during the project and encompass the period from its initiation to the start of full-scale production. The dataset is therefore substantial and provides insights into different aspects of the project, including technological matters, product design structure and parameters, project organi-sation, development process, among others. Another aspect relates to how communication takes place, which is the focus of this paper. Data from multiple sources were collected by the researchers, including interviews, observation of numerous R&D team meetings, observation of meetings between the R&D team and representatives from the distributed manufacturing site, and company documents (Yin 2018). This allowed triangulation to strengthen the internal validity of the findings (Gibbert, Ruigrok, and Wicki2008; Yin2018). An overview of the collected data is presented in Table1.
The analysis in this paper, focusing on communication during the project, involved two consecutive phases. The first phase addressed how visual representations were used for the communication between the R&D team and geographically distributed suppliers. This phase relates to RQ1, focusing on how visual representations became boundary objects in
Table 1.Data collection methods. Method
Number and
Duration (min) Comments
Interviews 29 (60–120) Semi-structured, open-ended interviews at different stages of the project, with actors from the Swedish product development and Chinese manufacturing sites. The interviewees represented different roles, such as product manager, project manager, design engineer, laboratory engineer, manufacturing engineer, quality engineer, and purchaser. The interviews were recorded and transcribed.
Observations at project meetings
59 (120) Observations at project meetings at the Swedish product development site, as well as conference calls between the Swedish R&D engineers and engineers from the Chinese manufacturing site. Notes were taken during the meetings. Informal
conversations
Approximately 60 Following the project meetings at the Swedish product development site, informal conversations were primarily held to further discuss issues of interest (between one of the academic researchers and the industry representative). Notes were taken after the meetings.
Workshop 1 (420) The workshop involved the R&D engineers in Project Beta and representatives of another company, where experiences from communication in globally and organisationally distributed product development projects were shared, discussed, and analysed.
Company documents
Numerous The researchers had free access to project documentation (e.g. project meeting agendas and minutes, pictures with annotations, communication procedure with suppliers etc.).
the communication between distributed NPD project actors. The second phase addresses RQ2 and analysed visual representation design, which provided insights into how the design of visual representations influenced their potential to act as boundary objects to support communication in NPD projects in distributed contexts.
Each phase resembles Miles, Huberman, and Saldaña’s (2014) idea of how to analyse qualitative data through data condensation, data display, and drawing/verification of con-clusions. Data condensation aimed at selecting, simplifying, and organising the transcribed interviews and other data types. A case narrative was written by the researchers and its accuracy verified by the co-authoring project manager (Riege2003). The narrative was used as an input for a workshop during which the researchers and the co-authoring project man-ager jointly analysed how visual representations were used as means for communication in Project Beta between distributed actors. The literature on communication in dispersed contexts, as well as that on boundary objects, were used as theoretical lenses for analy-sis. Thereafter, the design of the visual representations per se was analysed in relation to the literature on the design of visual representations in accordance to the principles of graphic design and design of annotations. In each phase, interview transcripts, field notes, and documents were studied and related to the literature.
3.2. Empirical material
Husqvarna Group develops, manufactures, and delivers equipment for outdoor use. In Project Beta, a new product was developed, targeting professional consumers and being sold under four brands. Low cost and light weight were among the most important crite-ria. The project had a tight deadline because the market had a seasonal pattern, implying
product launch would be critical. Corporate management decided that the product should be manufactured in a newly acquired manufacturing facility in China. This product was the first, together with a related product, to be produced in this facility.
The R&D team in Sweden included a project manager, two design engineers, and two test engineers. At the Chinese manufacturing facility, engineers representing several competencies, such as R&D, manufacturing, purchasing, and supplier quality assurance were involved. Whereas the Swedish R&D team were experienced in the development of products for professional users, their Chinese counterparts were primarily experienced in manufacturing low-cost products. The company’s R&D management model, which resem-bled a stage-gate process, guided the project. The model outlined several process stages, including state specification, development, industrialisation, and production.
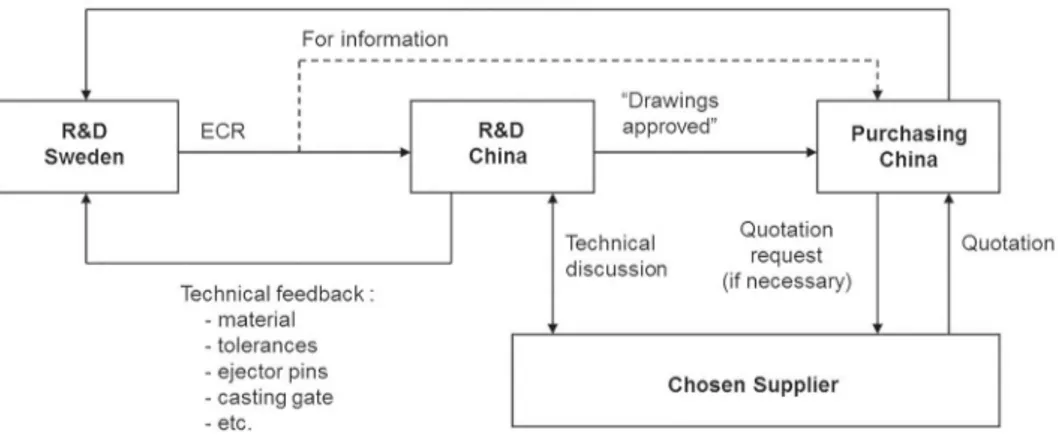
The Swedish R&D team was keen to receive feedback from suppliers regarding compo-nent manufacturability to ensure quality criteria were met, stipulated lead times kept etc. However, the suppliers did not speak nor read English, which had not been foreseen by the R&D team and came as a surprise. Hence, the R&D team could not have conventional design review meetings with the suppliers. Instead, it sent so-called engineering change request (ECR) drawings to the manufacturing team who were able to communicate in English. Then, the Chinese colleagues communicated the technical issues to the suppliers. Suppli-ers’ feedback was collected by manufacturing site colleagues, translated into English, and sent to the Swedish R&D team. This communication procedure, with the manufacturing team as intermediaries, differed from the conventional (direct) way of communication with suppliers, resulting in an lengthier procedure than usual. This ‘new’ communication proce-dure was not planned for as the communication proceproce-dure was not devised at the outset of the project but had to be implemented when the language issue became apparent, it initially caused confusion about roles and responsibilities in the communication with sup-pliers. Therefore, the project manager specified and visually illustrated the communication procedure that involved the Swedish R&D team, purchasing representatives in China, and suppliers.
The communication procedure is exhibited in Figure1, showing how the information should flow and be exchanged between involved actors. According to the project manager, after the introduction of the procedure, communication became smoother and questions
on how information should flow and who was responsible for collecting and sharing information subsided.
Despite the communication procedure, challenges occurred in receiving the correct information and correctly produced components from the suppliers. The R&D team expe-rienced that when engineering change orders (ECOs), that is, modifications of tooling to secure component tolerances, were sent to the suppliers and the modifications were incor-rect or not implemented at all. Therefore, the components delivered by the suppliers often failed to meet the specified requirements.
The R&D team was not sure about the reasons the ECOs were not fulfilled, but the use of conventional means for information sharing via revised product models, drawings, and updated bill-of-materials was clearly not enough to initiate the requested modifications. The R&D engineers from the Chinese manufacturing site also confirmed that the suppliers struggled to understand which modifications to implement based on the revised product models and CAD drawings (e.g. complex geometrical tolerances). The suppliers were unfa-miliar with existing drawing conventions and standards used by the Swedish R&D team. One of the Swedish R&D team members stated, ‘If they [Chinese suppliers] don’t under-stand, maybe they do not say that. . . so they just ignore it and go ahead . . . ’. To deal with the ECOs, the Swedish R&D team started to take photos of delivered components that were not produced according to specifications. The team also made drawing print-outs of components to which annotations, including text and arrows, were added to explain what was produced incorrectly and what must be modified in the next series of components. The team then sent these to the suppliers and denoted all visual representations as picture books. According to the team, this became a simple but effective way to communicate with the suppliers. In other words, the picture books became an essential element of the devised communication procedure, where Chinese engineers were engaged in translating the text on the photos and print-outs from English to Chinese. As a result, the suppliers started to implement the requested modifications, ultimately producing and delivering components that fulfilled the ECOs. According to the R&D team, the introduction of the picture books became a key means to convey the requested modifications.
Despite the different challenges of Project Beta, it was ultimately successful. The launch of the first product was slightly delayed, but it became a market success. The tests con-ducted by a consumer organisation showed several valuable features of the product: it was aesthetically pleasing, of high quality, had low environmental impact, and was easy to operate. After market entry, its sales volume increased substantially and profitability almost doubled compared to the product it replaced on the market.
4. Analysis
This section first addresses how visual representations were used as means for communica-tion among actors in the Project Beta and then analyses the design of these representacommunica-tions.
4.1. Use of visual representation in distributed geographical context
Literature shows that visual representations in various formats (e.g. sketches, drawings, or simulations) have the potential to support communication and ensure that multidisci-plinary actors understand each other (Bechky2003; Majchrzak, More, and Faraj2012). It
also reveals that visual representations are concrete means that facilitate translating and learning, as well as identify the dependencies between actors (Carlile2002,2004).
Our findings show how differences in understanding the English language and in work experience among the actors involved in a distributed NPD project disrupted communi-cation. Further, the use of conventional boundary objects, such as external design review meetings, revised product models, drawings, and updated bill-of-materials, could not be used as initially intended in the project. To facilitate communication between the Swedish R&D team and geographically distributed Chinese suppliers, the following visual represen-tations were devised by the team: (i) process-oriented communication procedures and (ii) product-oriented picture books. The value of using such types of representations was not envisioned when the project was planned, but the team devised them as a response to chal-lenges in communication that occurred during the project. The first representation clarified information flows, as well as the roles and responsibilities of the involved actors, whereas the picture books ensured component modifications were correctly implemented by sup-pliers. Therefore, both types served as effective boundary objects (c.f. Carlile2002,2004; Bechky2003; Majchrzak, More, and Faraj2012). Both representations were found to play similar roles as intermediates to overcome the potential difference among actors in terms of language and experiences. Interestingly, the simple yet effective visual representations add to the use of ICTs to overcome the potential communication challenges originating from geographic distribution of actors (c.f. Dooley and O’Sullivan2007). That is, commu-nication in distributed NPD projects is not only facilitated by the use of ICTs (cf. Boutellier et al.1998) but also by visual representations.
Prior research demonstrated the use of visual representations as starting points to sup-port discussions and that of product-oriented communication to align actors’ understanding of product design (Kleinsmann, Valkenburg, and Buijs2007; Ewenstein and Whyte2009; Luck2014). Tjell and Bosch-Sijtsema (2015) also show that visual representations can play a process-oriented role in project management, for actors obtain a transparent overview of the project and decisions to be made. However, the literature primarily addresses the use of visual representations where actors are co-located (either temporary or full-time) and face-to-face interactions possible for both formal and informal communication. The find-ings from Project Beta thus indicate that visual representations play a significant role in facilitating communication among geographically distributed actors.
4.2. Design of visual representations
The study of Project Beta did not only reveal how the visual representations were used to overcome communication challenges, but also provided insights into how visual represen-tations were designed and their potential to act as boundary objects in to support commu-nication in NPD projects. As Project Beta was undertaken in a geographically distributed context, it was difficult to use gestures, such as pointing to critical parts, to support com-munication (cf. Mortensen and Lundsgaard2011). Instead, visual representations, including a formalised set of conventional symbols (i.e. arrows, circles, frames etc.), were used to support communication with suppliers. Annotations and colour plates were added to pho-tos and drawing print-outs to indicate incorrectly produced components. Colour plates in white, red, yellow, or green were used to direct suppliers’ attention to their correctly, incorrectly, or incompletely performed modifications by the Swedish R&D team via ECOs.
Figure 2.Engine assembly.
However, the visual representations in the picture books were not consistently designed. The original figures, as they compose the unique picture books, are presented below. For example, different colours were used for indicating the status of requested modifications as illustrated in Figures2–5. Another aspect of visual representations was that annotations were inconsistently used. As exemplified by Figure2, the arrow overlaps one letter in the annotation. In Figure5, the abbreviation ‘dept.’ is used instead of spelling out the word ‘department’ in full, and part of the annotation is repeated. Despite the ad hoc design of the annotated picture books and their inconsistencies and poor quality according to principles of well-designed graphics, they served as means to ensure that the requested compo-nent modifications were implemented. That is, the visual representations with annotations helped suppliers understand and decode the information initially sent via ECOs.
A closer look at the picture books shows that the various instructions regarding the required modifications were also used as clarifications. Figure2, titled Engine assembly, shows top-view and side-view pictures of a mechanical part, stating, ‘This engine has never been started’, that is, the engine had not been tested. It also provided information on how the R&D team could ensure that it had not been tested: a piece of the piston ring has been found in the crankcase.
Similarly, Figure3, titled Clutch, displays a close-up photo of a clutch taken from above. The text pointed to a problem with a ‘spring missing’. The white-coloured plate indicated a requested modification, with the line pointing to the spot where a spring should have been inserted.
Figure 3.Clutch.
Figure 4.Gear wheels.
Figure4, titled Gear wheels, contained an annotation on ‘too many burrs in the holes’. The lines were used to indicate that some holes required modifications. Although both Fig-ures3and4showed similar designs, they differed in content and level of details. The clutch photo did not provide information on how the missing spring should be assembled. By only
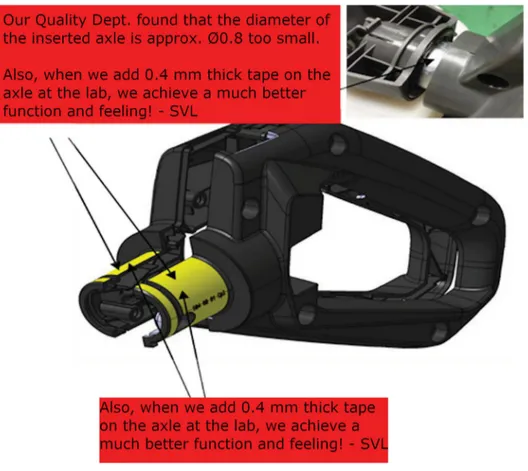
Figure 5.Rear handle.
indicating the missing spring, the receiver of the message had to assume that the left part of the clutch with the spring was correctly assembled. In Figure4, which shows the gear wheels, the R&D team indicated not only the problem, but also which holes were drilled correctly. However, the lines indicating the burr-free holes were barely distinguishable from those pointing to the holes with too many burrs. The text placed in the red plate (Figure4) emphasised the required changes.
Figure5, titled Rear handle, includes text that not only indicated the required change or the identified problem (‘the diameter of the inserted axle is approx. Ø0.8 too small’) but also explained this requirement was based on test results. The annotation further offered a possible solution: ‘when we add 0.4 mm thick tape on the axle at the lab, we achieve a much better function and feeling! – SVL’. Figure5shows a red plate and picture, linked by an arrow pointing to a barely visible axle. The figure also contains a print-out of the 3D CAD model, with two additional arrows anchored to the part of the rear handle covered with yellow tape.
Overall, the representations did not follow any principles of graphical design (Hansen
2000; Mollerup2015). The R&D team was not familiar with such principles and could not apply them when devising the representations. For example, colour plates were used incon-sistently, as illustrated in Figure4, where the white plates indicate both correctly and incorrectly drilled holes.
As such, the question is why did the visual representations work although they were designed ad hoc and not according to graphic design principles? A key reason is that the suppliers were familiar with the components requiring modifications because they had already produced the incorrect or incomplete ones. That is, the R&D team and suppliers shared a common project context, under which the R&D team had designed the compo-nents and knew their functionality, materials, tolerances etc., whereas the suppliers had become familiar with the components. This shared project context made it possible for the suppliers to decode and interpret information in the intended manner by the annotated picture books.
Although the picture books were not designed according to graphic design principles, they supported communication in the context of Project Beta by illustrating the compo-nents exposed to modifications from different perspectives. The combinations of photos and drawing print-outs with annotations created concrete modifications that could be understood by the suppliers due to their familiarity with the components in the picture books as hands-on and tangible visual representations. Arguably, this was an essential aspect of the communication in Project Beta as due to the differences in language skills, direct and synchronous communication between the R&D team and suppliers was not possible.
5. Discussion and implications
Research asserts the use of advanced ICTs (e.g. tele- and video conferencing) and temporary relocation (face-to-face meetings) to support synchronous communication in distributed NPDs (Barczak and McDonough2003; Ceci and Prencipe2013). Based on empirical materials from Project Beta, this paper addresses the design and use of visual representations in NPD projects in distributed contexts.
The findings reveal that, when actors share project context, the use of visual represen-tations is effective for asynchronous communication in a distributed context. Specifically, visual representations in the form of photos and drawing print-outs with annotations can support communication between an R&D team and geographically distributed suppliers, even though the representations do not follow graphical design principles.
Despite prior studies’ emphasis on the use of visual representations (e.g. sketches, draw-ings, CAD models) as means to communicate (Hietikko and Rajaniemi2000; Goldschmidt
2007) and establish shared understanding (Carlile2002; Marheineke, Habicht, and Möslein
2016; Cash, Dekoninck, and Ahmed-Kristensen2017), research has mostly been conducted in co-located cross-functional NPD contexts. As claimed by Lindlöf (2014, 75), there is a need for the ‘design of boundary objects for communication in geographically distributed teams’. Furthermore, prior research emphasised the use of visual representations to sup-port negotiations and joint decision making during NPD projects (Carlile2002; Boujut2003; Maier et al.2009; Marheineke, Habicht, and Möslein2016). As the findings of this paper are based on a study of an NPD project in a distributed context, the capacity of visual repre-sentations to convey messages that can be understood and foster the requested actions is highlighted by using picture books.
The findings indicate that the differences in linguistic skills, work experience, and lack of experience in working together pose communication challenges between actors rep-resenting different functions and organisations. The findings also show these challenges
cannot be entirely overcome by using ICTs and designated boundary objects such as exter-nal drawing reviews and updated drawings/documents. Designated boundary objects are means of communication assigned to cross the boundaries of various functions based on designs and properties (Levina and Vaast2005). In line with Levina and Vaast’s (2005) findings, we also highlight the importance of ‘in-use’ boundary objects, corroborating the argument of prior research that boundary objects’ capacity is contextual (Carlile2002; Bechky2003). The findings of this study extend the prior research by indicating that it is not the graphic design quality that made the boundary object, i.e. visual representations, effective but rather the shared close engagement with the object’s details.
This study also shows how specific boundary objects are devised as responses to the challenges from the differences in actors’ linguistic skills and work experience. Arguably, the process-oriented communication procedure devised by the Swedish R&D team to visu-alise the flow of information to and from Chinese suppliers worked well because the actors shared the same project context. Similarly, the product-oriented picture books also served as means to support communication because component modifications, as indicated in photos and drawing print-outs with annotations, were transmitted to the suppliers, being based on their prior familiarity with the components. That is, the suppliers recognised the components and could relate the information conveyed in the picture books to their previous experiences.
As shown by Project Beta, the relevance of using specific boundary objects is linked to the unique NPD project context, where boundary objects were useful due to the shared context, which acted as ‘a glue’ between actors. As the boundary objects were not designed at the outset of the project but later as responses to communication challenges, the R&D teams should consider contingencies and be open-minded about new means of com-munication for particular projects. However, Project Beta provides evidence that visual representations can be effective in transmitting information that fosters action. That is, there is a need for flexibility in selecting and switching between the methods to commu-nicate within NPD projects. In other words, the findings imply the need for a dynamic and context-dependent perspective of communication in NPD projects.
This study shows that, in a geographically distributed context, graphical elements (e.g. arrows, colour blocks) can fulfil a role that would normally be fulfilled by gestures in infor-mal communication, that is, facilitate the use of visual representations during face-to-face communication, such as by pointing to a critical section of a drawing (Mortensen and Lundsgaard2011; Cash and Maier2016). Arguably, the use of visual representations with annotations can, to a certain degree, complement or even replace face-to-face communi-cation, where gestures are frequently used.
6. Conclusions
This paper focused on how visual representations support effective communication in a distributed context for the development of a complex new product based on mechan-ics and combustion technology. Specifically, it investigated the design and use of visual representations to support communication between an R&D team and geographically dis-tributed suppliers. Communication challenges in a disdis-tributed NPD context arising from differences in linguistic skills and work experience cause frustration and insufficient com-munication flows, ultimately resulting in delayed product development. However, it can be
concluded that visual representations designed ad hoc and used in a shared project con-text are conducive for communication, although they are not designed according graphic design principles. Here, the use of picture books was effective and added to the use of ICTs. One explanation is that teams sharing project context can create internal conventions about the visual representation.
The main practical implication of the study is that it reveals the need for a dynamic and context-dependent view on communication in NPD projects, where project managers allow the emergence of new means of communication that best fit a specific project situ-ation. The authors acknowledge the limitations of the study due to the use of a case study approach. However, the findings were related to the literature to achieve analytical gener-alisation (Yin2018). While case findings are useful for theory extension (Voss, Tsikriktsis, and Frohlich2002), additional empirical data from similar and other research contexts should be used to reinforce the results’ validity and provide more examples of the roles and designs of different boundary objects in distributed NPD contexts. An interesting avenue for future research would be to compare the findings of this study with scenarios where the visuals are based on graphic design principles (Lupton and Phillips2015).
Acknowledgement
The research presented in this paper was financed by VINNOVA, the Swedish Governmental Agency for Innovation Systems, and is greatly appreciated. We also want to thank Husqvarna Group and all the interviewees in the studied project. The authors appreciate the constructive and valuable feedback provided by the editor and the reviewers of the Journal of Engineering Design.
Disclosure statement
No potential conflict of interest was reported by the authors.
Funding
The research presented in this paper was financed by VINNOVA, the Swedish Governmental Agency for Innovation Systems.
ORCID
Yvonne Eriksson http://orcid.org/0000-0001-9057-0063
References
Agosti, M., G. Bonfiglio-Dosio, and N. Ferro.2007. “A Historical and Contemporary Study on Anno-tations to Derive Key Features for Systems Design.” International Journal on Digital Libraries 8 (8): 1–19.doi:10.1007/s00799-007-0010-0.
Allen, T. J., B. Tomlin, and O. Hauptman.2008. “Combining Organisational and Physical Location to Manage Knowlegde Dissemination.” International Journal of Technology Management 44 (1/2): 234–250.
Allen, T. J., M. L. Tushman, and D. M. S. Lee.1979. “Technology of Function Spectrum Through from Transfer Position in a the Technical Development to Services.” Academy of Management Journal 22 (4): 694–708.
Barczak, G., and E. F. McDonough, III.2003. “Managers at Work: Leading Global Product Development Teams.” Research-Technology Management 46 (6): 14–18.
Bechky, B. A.2003. “Sharing Meaning Across Occupational Communities: the Transformation of Understanding on a Production Floor.” Organization Science 14 (3): 312–330.doi:10.1287/orsc.14.3. 312.15162.
Becvar, A., J. Hollan, and E. Hutchins.2008. “Representational Gestures as Cognitive Artifacts for Devel-oping Theories in a Scientifc Laboratory.” In Resources, Co-Evolution and Artifacts, edited by M. S. Ackerman, C. A. Halverson, T. Erickson, and W. A. Kellogg, 117–143. London, UK: Springer. Beech, N., R. MacIntosh, and D. MacLean. 2010. “Dialogues Between Academics and
Practition-ers: The Role of Generative Dialogic Encounters.” Organization Studies 31 (9–10): 1341–1367.
doi:10.1177/0170840610374396.
Bergiel, B. J., E. B. Bergiel, and P. W. Balsmeier.2008. “Nature of Virtual Teams: A Summary of Their Advantages and Disadvantages.” Management Research News 31 (2): 99–110.
Boujut, J.-F.2003. “User-defined Annotations: Artefacts for Co-ordination and Shared Understanding in Design Teams.” Journal of Engineering Design 14 (4): 409–419.doi:10.1080/095448203100016 06885.
Boujut, J.-F., and E. Blanco.2003. “Intermediary Objects as a Means to Foster Co-Operation in Engi-neering Design.” Computer Supported Cooperative Work (CSCW) 12: 205–219.
Boutellier, R., O. Gassmann, H. Macho, and M. Roux.1998. “Management of Dispersed Product Devel-opment Teams: the Role of Information Technologies.” R&D ManagementD Management 28 (1): 13–25.
Carlile, P.2002. “A Pragmatic View of Knowledge and Boundaries: Boundary Objects in New Product Development.” Organization Science 13: 442–455.
Carlile, P.2004. “Transferring, Translating, and Transforming: An Integrative Framework for Managing Knowledge Across Boundaries.” Organization 15: 5.
Cash, P., E. A. Dekoninck, and S. Ahmed-Kristensen.2017. “Supporting the Development of Shared Understanding in Distributed Design Teams.” Journal of Engineering Design 28 (3): 147–170.
doi:10.1080/09544828.2016.1274719.
Cash, P., and A. Maier. 2016. “Prototyping with Your Hands: The Many Roles of Gesture in the Communication of Design Concepts.” Journal of Engineering Design 27 (1–3): 118–145.
doi:10.1080/09544828.2015.1126702.
Ceci, F., and A. Prencipe. 2013. “Does Distance Hinder Coordination? Identifying and Bridg-ing Boundaries of Offshored Work.” Journal of International Management 19 (4): 324–332.
doi:10.1016/j.intman.2013.04.001.
Chen, C. Y., Y. C. J. Wu, and W. H. Wu.2013. “A Sustainable Collaborative Research Dialogue Between Practitioners and Academics.” Management Decision 51 (3): 566–593.doi:10.1108/002517413113 09661.
Crilly, N., A. Maier, and P. J. Clarkson.2008. “Representing Artefacts as Media: Modelling the Rela-tionship Between Designer Intent and Consumer Experience.” International Journal of Design 2 (3): 15–27.doi:10.1108/17506200710779521.
Crilly, N., J. Moultrie, and P. J. Clarkson.2004. “Seeing Things: Consumer Response to the Visual Domain in Product Design.” Design Studies 25 (6): 547–577.doi:10.1016/j.destud.2004.03.001.
Dooley, L., and D. O’Sullivan.2007. “Managing Within Distributed Innovation Networks.” International
Journal of Innovation Management 11 (3): 397–416.
Dougherty, D.1992. “Interpretive Barriers to Successful Product Innovation in Large Firms.”
Organiza-tion Science 3 (2): 179–202.doi:10.1287/orsc.3.2.179.
Eisenhardt, M. K.1989. “Building Theories From Case Study Research.” The Academy of Management
Review 14 (4): 532–550.
Eriksson, Y., P. Johansson, and P. Björndal.2011. “Showing Actions in Pictures. Information Visualiza-tion.” 2011 15th International conference on information Visualisation (2011), London, July 13–15, 2011, pp. 403–408.doi:10.1109/IV.2011.104.
Eris, O., N. Martelaro, and P. Badke-Schaub.2014. “A Comparative Analysis of Multimodal Communi-cation During Design Sketching in co-Located and Distributed Environments.” Design Studies 35 (6): 559–592.doi:10.1016/j.destud.2014.04.002.
Ewenstein, B., and J. Whyte.2009. “Knowledge Practices in Design: The Role of Visual Representations as “Epistemic Objects”.” Organization Studies 30 (1): 7–30.doi:10.1177/0170840608083014.
Frishammar, J.2005. “Managing Information in New Product Development: A Literature Review.”
International Journal of Innovation and Technology Management 2 (3): 259–275.
Gibbert, M., W. Ruigrok, and B. Wicki.2008. “What Passes as a Rigorous Case Study?” Strategic
Management Journal 29 (13): 1465–1474.doi:10.1002/smj.722.
Goldschmidt, G.2007. “To See Eye to Eye: The Role of Visual Representations in Building Shared Mental Models in Design Teams.” CoDesign 3 (1): 43–50.doi:10.1080/15710880601170826.
Gustavsson, M., and K. Säfsten.2017. “The Learning Potential of Boundary Crossing in the Context of Product Introduction.” Vocations and Learning 10 (2): 235–252.doi:10.1007/s12186-016-9171-6. Hansen, M. Y.2000. “Visualizing for Thinking, Planning, and Problem Solving.” In Information Design,
edited by R. Jacobson, 206–125. MIT Press.
Hietikko, E., and E. Rajaniemi.2000. “Visualized Data—Tool to Improve Communication in Distributed Product Development Projects.” Journal of Engineering Design 11: 95–101.doi:10.1080/095448200 261207.
Hinds, P. J., and D. E. Bailey.2003. “Out of Sight, Out of Sync: Understanding Conflict in Distributed Teams.” Organization Science 14 (6): 615–632.
Hinds, P. J., and M. Mortensen.2005. “Understanding Conflict in Geographically Distributed Teams: The Moderating Effects of Shared Identity, Shared Context, and Spontaneous Communication.”
Organization 16 (3): 290–324.http://search.proquest.com.ezproxy.library.wisc.edu/abicomplete/ docview/213831869/fulltextPDF/50C77E5BB1774D24PQ/14?accountid= 465.
Hisarciklilar, O., and J.-F. Boujut.2007. “An Annotation-Basd Approach to Support Design Comunni-cation.” International conference on engineering design (ICED 07), August, pp. 1–10.
Kleinschmidt, E., U. De Brentani, and S. Salomo.2010. “Information Processing and Firm-Internal Envi-ronment Contingencies: Performance Impact on Global New Product Development.” Creativity and
Innovation Management 19 (3): 200–218.doi:10.1111/j.1467-8691.2010.00568.x.
Kleinsmann, M., and R. Valkenburg.2008. “Barriers and Enablers for Creating Shared Understanding in co-Design Projects.” Design Studies 29 (4): 369–386.doi:10.1016/j.destud.2008.03.003.
Kleinsmann, M., R. Valkenburg, and J. Buijs.2007. “Why Do(n’t) Actors in Collaborative Design Under-stand Each Other? An Empirical Study Towards a Better UnderUnder-standing of Collaborative Design.”
CoDesign 3 (1): 59–73.doi:10.1080/15710880601170875.
Koskinen, K.2005. “Metaphoric Boundary Objects as Co-ordinating Mechanisms in the Knowledge Sharing of Innovation Processes.” European Journal of Innovation Management 8 (3): 323–335.
doi:10.1108/MRR-09-2015-0216.
Kostelnick, C., and M. Hassett.2003. Shaping Information: The Rhetoric of Visual Communication. IL: Southern Illinois University Press.
Lakemond, N., et al.2012. “From Product Development to Production – on the Complexity of Geo-graphical and Organizational Dispersion.” Journal of Applied Economics and Business Research 2 (3): 125–137.
Lakemond, N., and C. Berggren.2006. “Co-locating NPD? The Need for Combining Project Focus and Organizational Integration.” Technovation 26 (7): 807–819.doi:10.1016/j.technovation.2005.04.004. Lakemond, N., C. Berggren, and A. Van Weele.2006. “Coordinating Supplier Involvement in Product Development Projects: a Differentiated Coordination Typology.” R&D Management 36 (1): 55–66.
doi:10.1111/j.1467-9310.2005.00415.x.
Letens, G., J. Farris, and E. Van Aken.2011. “A Multilevel Framework for Lean Product Development Sys-tem Design.” EMJ - Engineering Management Journal 23 (1): 69–85.doi:10.1080/10429247.2011.11 431887.
Levina, N., and E. Vaast. 2005. “The Emergence of Boundary Spanning Competence in Practice: Implications for Implementation and use of Information Systems.” MIS Quarterly 29 (2): 335–363. Li, C., C. McMahon, and L. Newness. 2009. “Annotation in Design Processes: Classification of
Approaches.” In International Conference on Engineering Design, ICED, 24-27 August 2009, 251–262. Stanford, CA: Stanford University, Morgan and Claypool Publishers.
Lindlöf, L. 2014. Visual Management - on Communication in Product Development Organizations. Gothenburg, Sweden: Chalmers University of Technology.
Luck, R.2014. “Seeing Architecture in Action: Designing, Evoking, and Depicting Space and Form in Embodied Interaction.” International Journal of Design Creativity and Innovation 2 (3): 165–181.
doi:10.1080/21650349.2013.875488.
Lupton, E.2010. Thinking with Type. New York: Princeton Architectural Press.
Lupton, E., and J. C. Phillips.2015. Graphic Design. The New Basics. New York: Princeton Architectural Press.
Maier, A. M., M. Kreimeyer, U. Lindemann, and P. J. Clarkson.2009. “Reflecting Communication : A Key Factor for Successful Collaboration Between Embodiment Design and Simulation.” Journal of
Engineering Design 20 (3): 265–287.
Majchrzak, A., P. H. B. More, and S. Faraj.2012. “Transcending Knowledge Differences in Cross-Functional Teams.” Organization Science 23 (4): 951–970.doi:10.1287/orsc.1110.0677.
Marheineke, M., H. Habicht, and K. M. Möslein. 2016. “Bridging Knowledge Boundaries: the use of Boundary Objects in Virtual Innovation Communities.” R and D Management 46: 1084–1094.
doi:10.1111/radm.12216.
Marshall, C.2009. “Reading and Writing the Electronic Book.” In Synthesis Lectures on Information
Concepts, Retrieval, and Services, edited by C. H. Gary Marchionini. Chapel Hill: University of North
Carolina. Morgan and Claypool Publishers.doi:10.2200/S00215ED1V01Y200907ICR009.
Miles, M. B., A. M. Huberman, and J. Saldaña.2014. Qualitative Data Analysis: A Methods Sourcebook. 3rd ed. Los Angeles: SAGE.
Mollerup, P.2015. Simplicity: A Matter of Design. Amsterdam: BIS Publishers.
Mortensen, K., and C. Lundsgaard.2011. “Preliminary Notes on ‘Grooming the Object’: The Example of an Architectural Presentation.” in Partipatory Innovation Conference. In Proceedings of the Par-ticipatory Innovation Conference. University of Southern Denmark, Sønderborg (pp. 99–104). pp. 1–8.
Moultrie, J.2015. “Understanding and Classifying the Role of Design Demonstrators in Scientific Exploration.” Technovation 43–44: 1–16.doi:10.1016/j.technovation.2015.05.002.
Riege, A. M.2003. “Validity and Reliability Tests in Case Study Research: A Literature Review with “Hands-on” Applications for Each Research Phase.” Qualitative Market Research: An International
Journal 6 (2): 75–86.doi:10.1108/13522750310470055.
Säfsten, K., G. Johansson, N. Lakemond, and T. Magnusson.2014. “Interface Challenges and Manage-rial Issues in the IndustManage-rial Innovation Process.” Journal of Manufacturing Technology Management 25 (2): 218–239.doi:10.1108/JMTM-10-2013-0141.
Sosa, M. E. E., S. D. Eppinger, M. Pich, D. G. McKendrick, and S. K. Stout. 2002. “Factors That Influence Technical Communication in Distributed Product Development: An Empirical Study in the Telecommunications Industry.” IEEE Transactions on Engineering Management 49 (1): 45–58.
doi:10.1109/17.985747.
Star, S. L.1989. “The Structure of ill-Structured Solutions: Heterogenous Problem Solving, Boundary Objects and Distributed Artificial Intelligence.” In Distributed Artificial Intelligence, edited by M. N. Huhns and L. Gasser, 37–54. San Francisco: Morgan Kaufmann.
Tjell, J., and P. M. Bosch-Sijtsema.2015. “Visual Management in Mid-Sized Construction Design Projects.” Procedia Economics and Finance 21: 193–200.doi:10.1016/S2212-5671(15)00167-7. Ulrich, K., and S. Eppinger.2016. Product Design and Development. 6th ed. New York: McGraw-Hill. Van de Ven, A., and P. Johnson.2006. “Knowledge for Theory and Practice.” Academy of Management
Review 31 (4): 802–821.
Voss, C., N. Tsikriktsis, and M. Frohlich. 2002. “Case Research in Operations Management.”
International Journal of Operations and Management ProductionManagement 22 (2): 195–219. doi:10.1108/01443570210414329.