Evaluating high availability in the
enterprise network
Case study at Stora Enso Pulp Mill AB
Mälardalens Högskola
Akademin för Innovation, Design och Teknik
Högskoleingenjör i Nätverksteknik 180 hp, Bachelor Author: Filip Wennerhult
2015-05-27
Examinator: Mats Björkman Supervisor: Hans Bjurgren
Preface
I would like to thank everyone at Stora Enso for giving me this opportunity. I want to thank the enterprise for their support and help during the case study. I especially want to thank Rolf Hedberg for his support and presence as supervisor. An extra thanks also goes out to Mattias Strid who have helped with guidance and information. I also want to thank MDH and their teachers for a great three years who have helped me hone my skills and giving me the opportunity to progress. A special thanks goes out to Hans Bjurgren for supervising me in this case study.
Abstract
High availability is an ever-changing area in networking. It is a very broad area with different definition depending on who you ask. Cisco high availability model is designed to help companies determine the correct path to reduce Mean-Time-Between-Failure and Mean-Time-To-Repair. There are several paths one can take depending on current limitations and business goals. Since best practices can change depending on new technologies or prerequisites, designing the network for high availability is a continuous process. The purpose of this research is to find the key factors in high availability and build a model around these to be used for evaluation around high availability. There are several other models for implementing availability these are created and directed towards specific vendors leaving an independent model of this lacking. The method used in this project is very similar to the top-down-approach. The model is designed around the method and was used to evaluate the network at Stora Enso pulp mill AB in Skutskär. The model has the ability to define the enterprise availability requirements and availability goals. Using these the model will provide the enterprise with the tools to evaluate if the enterprise reach their availability goals. After using the model limitations on maintaining a high availability network has been detected. It does however succeed in evaluating the enterprise availability. The model was designed to work independently of enterprise however it has only been tested at Stora Enso.
Contents
1. Introduction ... 5
1.1Problem and Purpose ... 5
2. Background ... 6
2.1 SOP ... 6
2.2 SOTA ... 9
3. Method ... 11
3.1 Research ... 11
3.2 Determine business goals ... 12
3.3 Discovery ... 12 3.4 Baseline ... 13 3.5 Evaluation... 13 3.5 Model ... 14 3.6 Material ... 14 4. Theory ... 15 5. Model ... 18
5.1 Categorize critical Services/Systems ... 18
5.2 Determine availability goals... 19
5.3 Determine all systems the service depends on ... 19
5.4 Evaluation... 20 6. Application of model... 21 6.1 Suggested Solutions ... 27 6.2 Observations ... 29 7. Review of results ... 30 7.1 Related Research ... 30 8. Conclusions ... 31 8.1 Future works ... 31 References ... 32 Appendix 1 ... 34
1. Introduction
Cisco High Availability is a model which is supposed to guide the enterprise to reduce lost revenue by maximizing MTBF and minimizing MTTR [1]. High availability is a complex model where best practices are changed frequently by the invention of new technologies and limitations like cost, hardware and knowledge making some practices hard or impossible to implement [2].
Stora Enso Pulp Mill AB is a company who has taken “the Cisco way” for high availability and now wants to evaluate their network to find possible problem areas in case of failure. As new technologies emerge and old limitations disperse, evaluation of high availability is a continuous process. To help the company in this process a model will be created with which the company can use to evaluate the enterprise network in a continuous cycle. This model is supposed to be applicable to any enterprise but will only be tested in the corporate network of Stora Enso Pulp Mill AB.
1.1 Problem and Purpose
High availability is a broad term, for some companies it might mean an outage will not last more than a day and to some it means nothing less than sub second outage [3]. There are several network models available with recommendations to help enterprises acquire high availability. Different vendors use different solutions and some of them are proprietary. There are several tough decisions that need to be made by enterprises when implementing high availability and finding the right information might be difficult in a jungle of vendors and solutions. Should the company redesign their network to match a recommended model with inherent availability or keep their old and following the best practices for a non-recommended model [2]? Something companies should keep in mind when redesigning is that best practices can change so it should be done with caution.
This paper will help enterprises answer these questions. It will work as a framework for any company wishing to implement or evaluate the availability of the enterprise network. The paper will cover the key pieces of information companies need and guide them through some recommended solutions. The paper will let companies of any size with any network environment routinely evaluate their network.
As can be seen there are many factors in determining the correct path for a company to acquire high availability. It’s a challenging process that requires a great deal of research for the designer. The paper will factor in all key parameters for availability so that it can be used by someone of limited knowledge on any type of network. The paper will be independent of vendor, size, type of enterprise and current network environment. Questions to be answered:
1. What is the correct design path according to this network’s behavior and limitations and this company’s business goals?
2. What are the key factors in high availability that can be used in a model?
3. How do you make this model independent and neutral to be used by any company?
2. Background
This section will cover different techniques to acquire availability and give the reader an introduction in the subject. Furthermore it will introduce future solutions that are under progress or still immature and untested on scale in the field.
Through the years different technologies have been invented in order to reduce network downtime. Some of these technologies are proprietary others an open standard. Some of these are very similar in how they work while others differ immersive from each other. The most common approach to solve availability have been to introduce redundancy. By using redundant links and devices the enterprise can eliminate Single-Point-of-Failure. In layer 3 and using routing redundant paths can be introduced with no real obstacle as routing protocols can handle it without causing loops and load balance on several paths. For layer two several techniques have been developed to add redundancy while not introducing any loops.
2.1 SOP
One of the most important inventions is the spanning tree protocol. The algorithm was designed by Radia Perlman. During the design of bridges they needed to solve the problem of having a loop-free topology since a layer 2 loop is one of the most detrimental things that can happen in a network [4]. Packets in layer 2 will loop endlessly as there is no Time-To-Live and bridges can duplicate the packet which can lead to network halt extremely quick [4]. Her manager asked her to solve the problem of breaking all the loops before he went away for a week [4]. Radia Perlman who received this challenging task created the algorithm within a day and spent the rest of the week creating a poem for it [4].
Algorhyme
I think that I shall never see A graph more lovely than a tree.
A tree whose crucial property Is loop-free connectivity. A tree that must be sure to span So packets can reach every LAN. First, the root must be selected.
By ID, it is elected.
Least-cost paths from root are traced. In the tree, these paths are placed.
A mesh is made by folks like me, Then bridges find a spanning tree.
Spanning-tree became the IEEE standard 802.1D in 1990 and later enchantments have improved the convergence speed and stability of the protocol [5]. Following the IEEE standard of 802.1w IEEE recommends using the enhanced version instead of the original version in new implementations [6]. However 802.1w or RSTP as it is also called provided no load-balancing capabilities as it created a single tree in the network for all vlans [6]. MSTP (802.1s) was standardized shortly after to overcome that obstacle and had the capabilities to create multiple trees.
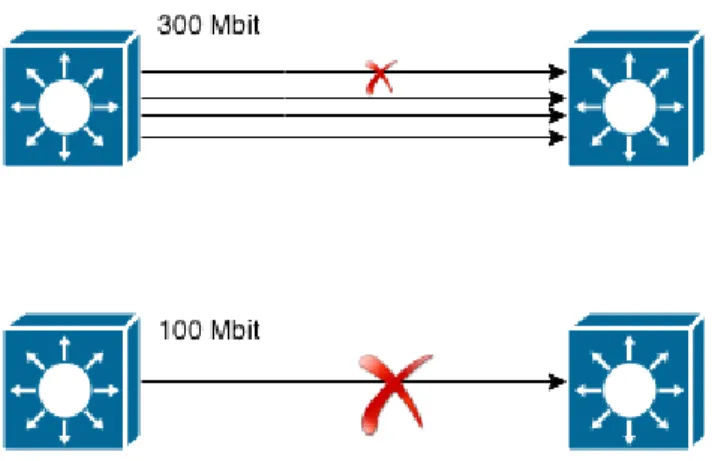
Spanning-tree is currently the most common solution for redundancy in layer 2 and the most recommended protocols are MSTP and the Cisco proprietary Rapid-PVST+. While they differ internally there are minimal differences in the result as both achieve load-balancing and rapid failover (see appendix 1). The benefit of implementing a spanning-tree solution along with redundant paths is that it solves both link and device failure [7]. Another very common solution to provide redundancy in the network is the use of Link aggregation. The technique is not an availability solution from the start as it was developed to increase capacity and increase devices life cycle. Link aggregation works by having multiple links form a link aggregation group [8]. As cisco has a proprietary protocol for link aggregation it does not conform to this standard and have the ability to create half duplex etherchannels. To create a link group all the links has to be in full duplex and at the same data rate [8]. The multiple links acts as one logical and mac clients will treat these links as a single link. Link aggregation adds redundancy for link failures only so it is also used in conjunction with other techniques (see figure 2-1).
Figure 2-1. Illustrating the benefits of Link Aggregation
As is shown without LAG a single link of the example switch has a data rate of 100 mbit/s and a link failure will result in loss of access. But with LAG normal operation has a data rate of 400 mbit/s and a single link failure will only downgrade the performance to 300 mbit/s instead of losing access [8].
While LAG is a virtualization technique that has an open standard and works interoperability with different vendors to provide link redundancy its counterpart for device virtualization is the complete opposite. There are currently many types of solutions for device virtualization even several from the same vendor. These solutions are however only proprietary solutions exist where most have hard requirements on even having the same model of device. This leads to vendor lock-ins and there is low interoperability between these solutions.
StackWise is a solution from Cisco where several 3750 switches can work as a single one [9]. One of these switches act as a master and works as the management point for the stack [9]. The Switches are connected together with a redundant closed loop backplane that achieve rapid switchover [9]. This yields redundant switches as any switch can take over as master [9].
Intelligent Resilient Framework is a similar technique from HP. It bundles several switches together to form a single logical switch [10]. The technique uses a primary switch for management purposes and any switch can take over as the primary switch similar to StackWise [10]. IRF however use regular ports for interconnecting the switches in the domain instead of the specialized backplane cables [11]. This lets the distance between switches of the same stack to be up to 70 km which is significantly greater than using StackWise [10].
By using a virtualization technique of devices together with LAG a complete solution with both link and device redundancy is provided also called Multi-chassi link aggregation. By creating etherchannels to a stack/domain with ports spread across several chassis, connected switches have both redundancy for switch and link failure [10].
Cisco created Flex links to work as an alternative to STP. Flex links is a proprietary solution that works by having a link act as a backup to the primary link. This link will assume forwarding immediately after the primary link fails. By configuring flex links STP is disabled on the ports and similar to STP flex links can be configured per vlan and load balancing can be achieved [12]. In order to configure flex links a link can only be a member of one flex link pair [12]. Flex links are however not flexible as they can only discover direct link failures limiting their use to specific designs.
In order to provide flex links with fast bidirectional convergence the MAC Address-table move update feature was introduced [12]. When the primary links goes down the switch starts forwarding on the backup link however other switches still have clients mac address mapped towards the failed link. With the feature enabled the switch first sends a packet containing the mac-addresses of clients on the new link to uplink switches [12].
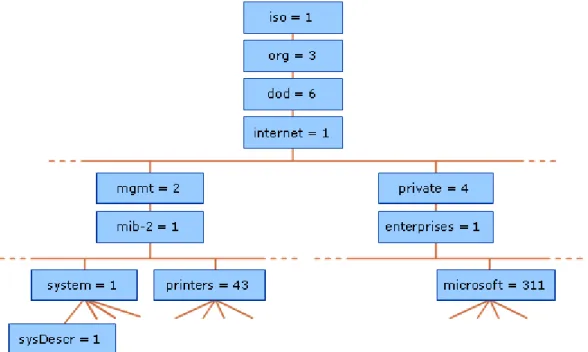
In order to detect and locate failures monitoring and logging are extensively used by enterprises. A practice used widely and supported by nearly all enterprise devices is SNMP which is an IETF standard protocol [13]. SNMP consist of network elements, the network management station and the Management information base [13]. MIB is the tree structure where all the objects that can be handled by the protocol reside as leafs [14] (see figure 2-2). Each object has a variable assigned to it that can be collected or set [14]. The benefit of this structure is that MIB variables can be added and removed. Lower branches can be assigned to network vendors to implement their own objects while higher branches are allocated to standard organizations [14].
Figure 2-2. Image illustrating the MIB from Microsoft Technet in “how snmp works”. The NMS sends requests to the network elements to collect the variable that it later can process and present information about the network [13]. The network elements who are the monitored devices can also send unsolicited messages by the use of a feature called traps which triggers based on thresholds [13]. This lets SNMP work as a highly flexible management and monitoring tool.
However SNMP has limitations regarding in-depth information about traffic. When information of traffic is required the protocols Netflow, IPFIX and sFlow can be used. These are techniques that collect information about the traffic that flows on the network. These protocols can give information about who and what is using the network [15]. These types of monitoring tools become a great asset when creating a baseline and defining QoS parameters [15].
Netflow is Cisco proprietary and captures header and interface information of each packet, which can later be exported to a collector [15]. IPFIX is an IETF standard, which is derived from Netflow v9 and works similar [16]. sFlow is a little different as it samples the traffic and record one out of N packets [17].
An in-depth guide of how these protocols works is beyond the goal of this paper. What is important to note is that these protocols have been tested in the field and are widely recognized as best practice.
2.2 SOTA
Spanning-tree has been used for over 25 years since its original publishing as a standard in 1990[6]. Advancements in networking and engineering has led to several new approaches to replace best practices. Three techniques will be introduced that are possible replacements for STP.
Transparent Interconnection of Lots of Links is a proposed standard with Radia Perlman who also invented STP as a lead figure [18]. TRILL can achieve rapid failover and multi-pathing by the use of IS-IS [18]. IS-IS which is a layer 3 link state protocol can work directly on ethernet without the need of IP addresses [Routing without tears]. TRILL uses type length value encoding to add fields and introduce hops [4]. To minimizing the effect of a temporary loop the maximum hop count is set after calculating the longest path to the destination [18]. A bridge that supports TRILL is called an Rbridge and in a TRILL network only the edge Rbridges that connects to hosts knows the addresses of the hosts [18]. This minimizes the load of transit Rbridges and when an edge Rbridge wants to send a packet to another host it encodes the packet with a TRILL header with the nicknames of source Rbridge and destination Rbridge [18]. On top of this it encapsulates the packet in another ethernet header making it transient from regular bridges [4].
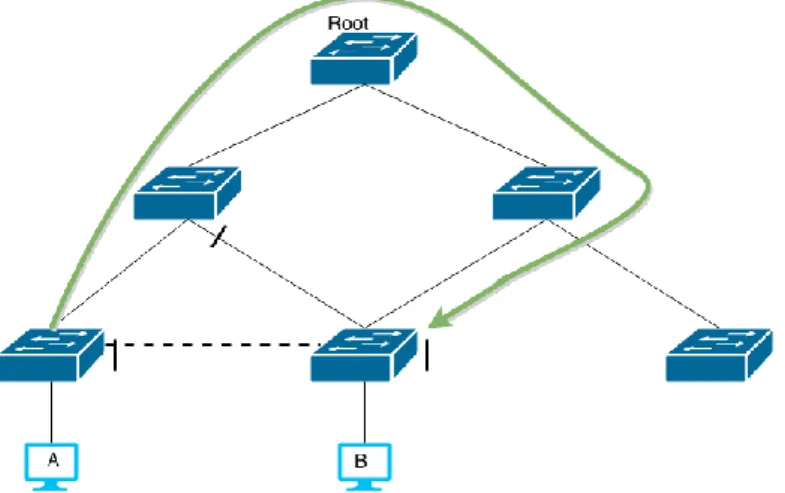
Shortest Path Bridging is a heavy contender to TRILL and is standardized as 802.1AQ [19]. It supports up to 16 multi-paths used and rapid convergence [20]. Pre-standard tests have shown convergence in 300 ms range in large topologies [20]. SPB is very similar to TRILL they both use IS-IS for calculating routes and only the edge bridges learn of the mac addresses [20]. For unknown addresses SPB creates a multicast packet for all bridges identified with that vlan [20]. Both of these protocols fix one of STP biggest issues in suboptimal paths. When A wants to send a packet to B it will take the suboptimal path following the green line instead of the direct path following the dotted line (see figure 2-3).
Figure 2-3. Illustrates the suboptimal path of STP.
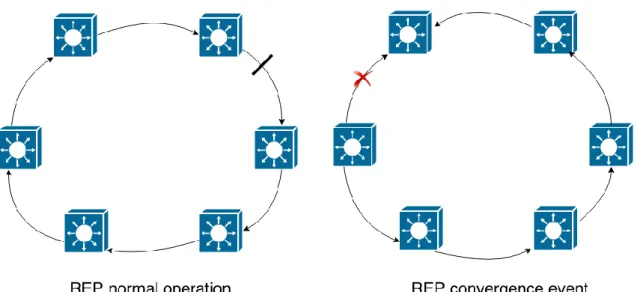
Resilient Ethernet Protocol is a cisco proprietary solution that only works in ring. It provides no multi-pathing but an extremely fast convergence time of around <50 ms according to tests conducted by Cisco [21]. However it is stated that it may take up to 250 ms in certain conditions [21]. It works similar to STP where a ring is built. Each port connecting to a switch is configured as a REP port and an alternative link is configured as blocking. REP uses loss of signal as detection method with hello packets as a backup mechanism [21]. When a switch detects a loss of signal it sends a multicast to all other switches who flush the MAC addresses learnt and opens the blocking port (see figure 2-4) [21].
Figure 2-4. Illustrating the REP convergence.
3. Method
This chapter will describe the method used. An overview of the method is presented first and is later described briefly in detail along with cons and pros.
As a method for this study the problem has been divided into 6 steps where the information of the former is needed before the next step. Each step is briefly detailed of what needs to be done, any problem that is related to it and how those problems will be averted. The steps defined here can be closely matched to the steps used by the “top-down approach” method [22].
Milestones:
Collect the knowledge. Determine business goals.
Acquire information on the network infrastructure. Acquire information on the network traffic.
Consult the earlier steps and propose the correct solutions for high availability. Design a model for continuous evaluation of high availability.
3.1 Research
The literature that will be used as the foundation of the evaluation will be “Campus Network for High Availability Design Guide”, “Ethernet-to-the-Factory 1.2 Design and Implementation Guide” and “Designing Cisco Network Service Architectures (ARCH)”. Beyond the literature from Cisco, white papers and documents from IETF and IEEE as well as vendors interpretation of these documents will be used. Relevant articles will also be searched from databases and search engines using keywords like “network availability” and “network redundancy”. The articles found were skimmed through and selected as articles used based on relevance. The most common redundancy techniques will also be briefly compared in a small test on convergence.
There is always the risk of acquiring a subjective view from the writer when researching. Documentation from Cisco might be influenced by Cisco’s own values and be biased towards Cisco’s own products and philosophies. It is important to be critical and cross-reference the information to select independent information. White papers from numerous vendors are used for cross-reference as well articles and standards from independent organizations like IEEE and IETF. By using these methods any subjective views will be screened out and a more objective result will be achieved. The tests will also give information in numbers that might be hard to come by through papers.
3.2 Determine business goals
In order to determine the business goals and tailor the availability to the company a meeting with the IT manager was conducted. For the meeting an agenda was set with the important questions that needed to be answered.
When determining business goals it is always useful to collect information from different parties. IT, workers, and management might have different opinions on business goals. Surveys and interviews can be used for a broader view.
3.3 Discovery
In order to plan a network design and implementation the current behavior of the network must be understood. A detailed network map works wonders in giving the designer a good view on how the network is built and behaves today. A good map gives information about hostname, Management IP, interface, model, vlan and it is also beneficial if spanning-tree topology along with blocked ports is included.
As the company had limited documentation a network map was created. The map was designed by manually mapping the network through the use of discovery protocols. The address plan together with credentials for the devices was requested. Using a SSH- and telnet client along with the discovery protocol CDP the network was explored and mapped. By logging in to a device and executing the command show cdp nei, neighboring devices supporting and running CDP was displayed together with port numbers. The devices was linked in the map and using show cdp nei detail IP addresses of the neighboring devices was displayed. The address was matched to the IP plan and checked when the all neighbors were mapped each neighbor was logged into and checked for neighbors. This continued recursive from the root to the leaves until the complete network was explored. The mapping was divided using different roots by using the different distributions and core network as base. After the network was mapped, switches part of loops were examined to identify blocked ports.
This map helped in getting a broad and easy view of the network and can work as a base in designing availability. The map that was designed did not detail any pruned vlans, QoS or firewall rules. CDP was used in preference over LLDP as the network environment was based on Cisco and LLDP was disabled by default on the devices in the network. The danger of this is missing a device. By using manual discovery the administrative burden was higher than using an automated process. The choice on manual was decided after examining the size of the IP plan and the burden was weighted to learn and examine an automatic tool. In bigger networks a manual approach
3.4 Baseline
The map will act as support for the baseline which gives detailed information of the traffic that runs on the network, this helps identify points of congestion and traffic patterns that can be used for QoS parameters. Using the map and the business goals from the previous sections links of interest was chosen for monitoring. The links was chosen based on how important the traffic was determined and how much traffic was expected. This information was retrieved from the earlier sections. The network was monitored through the SNMP protocol and a collector tool that could make graphs for easier consumption of the information. PRTG Network Monitor was used as a collector which polled the network on information about the interesting links and graphed in the Web-GUI. The baseline ran for 2 weeks to minimize impact of unusual traffic patterns. SNMP is a standard monitoring tool that is widely used and can get extensive information of the network. SNMP lacks a way to determine type of traffic and origination of traffic. These statistics are very useful in a baseline but requires the hardware to support it. As collector PRTG was chosen in regards to a recommendation from a consultant who had previous experience from it. It was recommended on the basis of being easy to learn, flexible graphs and having a 30 day free-trial. The collector was not compared to other collectors beside earlier experience from Nagios+cacti where it had a huge advantage in the earlier mentioned areas for which it is recommended. To collect information of the type and origin of the traffic protocols like Netflow, IPFIX and sFlow can be used. Cisco’s products have no support for the open standards IPFIX or sFlow and Netflow is cisco proprietary but is only supported on higher end switches. Instead of upgrading the whole network to support this feature a company can have a probe that can generate this information from port-mirrored traffic. These probes are not free but considerably cheaper than the alternative.
3.5 Evaluation
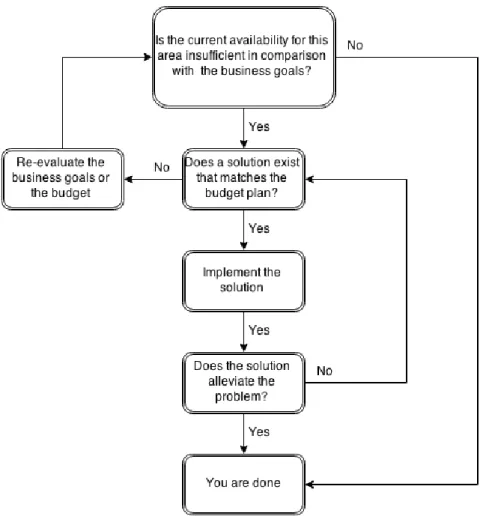
All the previous information gathered from the earlier steps where brought together to evaluate the network. First the business goals were examined towards the current network infrastructure and the baseline of the different parts of the network. The following questions were asked for each area. The questions were asked in order and a scheme was designed to define the flow (see figure 3-1).
Is the current availability insufficient for this area in comparison with the business goals?
If the area has insufficient availability does a solution exist that matches the budget?
Figure 3-1. Flowchart of evaluating the network.
The proposed solutions and designs were presented to the company during a presentation to the IT-manager.
3.5 Model
The model was created using the method as a base. Since the method described the necessary details to evaluate the network for high availability. To make the model short and yet helpful the model was directed towards problems instead of solutions. The model was created in conjunction with the evaluation and the flowchart from the earlier step was directly inserted into the model.
The case study at Stora Enso will work as a guide for researching problems with example solutions. Creating a guide for researching every solution for every vendor would be impossible so the guide was focused on determining the problems. There is a limited amount of problems that has exponentially many solutions. By dividing the problems and giving small example solutions for comparison the user can use the guide completely or in part and still keep an open mind for different solutions.
3.6 Material
The materials needed for this study is compiled of each of the six steps required materials. The materials described include immaterial things. Time is the one thing that is needed for all steps.
In order to get the necessary knowledge for the project, the literature is needed in physical or digital form. Most of the literature is in digital form and can be found by using search engines and databases such as Google scholar and Emerald.
For the second point a conversation or discussion between the engineer and key representatives of the enterprise is needed. These conversations must lead to answers about the business, its values and its constraints.
To get an overview of the network, information and documentation of the network is needed. If documentation is lacking it must be created. To create a network map using this method the address plan of the company is needed along with credentials for the devices. A SSH- or telnet client is needed as well as an application to create network diagrams in.
To get an overview of the network traffic a monitoring tool must be used and the data to be monitored, nearly all devices support SNMP which is a basic but useful protocol that is widely used and can send data for monitoring. It is extremely helpful if the monitor tool can create graphs. A network map needs to be used to delimit the baseline to just the interesting points of the network.
The materials for the evaluation and the model consist only of the results of the other steps and therefore no new materials are needed. The materials needed for the evaluation and model are knowledge, the enterprise business goals, information about the network Infrastructure and information about the network traffic.
4. Theory
This chapter will be covering the information and technologies that have been researched in order to complete the evaluation and the model. First information regarding methods importance of availability is presented. The different techniques used to solve the problem is briefly explained and tested.
In order to create a model of high availability you have to understand what availability is and why it is important. Oracle describes it as the level of which a service or function is accessible on demand [2]. Oracle also interestingly points out that it is measured by the perception of the end user [2]. Meaning even if a system is down several times a year if no downtime is perceived by the end user the system has been available 100 % that year. This might simply be because of fortune coincidences or planned downtimes conducted when no user is demanding access. It is clear however that it must be monitored, a high available network should have the following traits [2].
Tolerate failures with minimal interruption Automatic recovery
Automatic detection Fast recovery
High availability protects the company from income losses, costumer dissatisfaction and lost opportunity [3]. For industries downtime losses may be heavy oriented in income loss from production. E-commerce-companies biggest losses could come from costumer dissatisfaction and companies dealing in stock market, losses may be emphasized in lost opportunities.
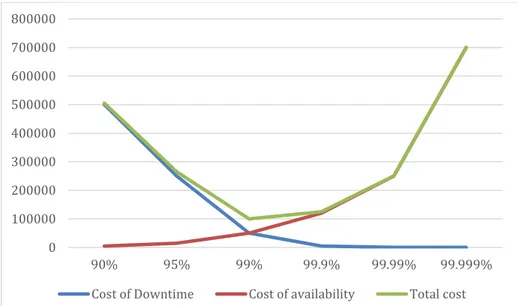
It is however important that each enterprise conduct a risk analysis in order to determine the level they need as the price for high availability increases exponentially for each nine (see figure 4-1). In the example provided the sweet spot is around 99% where the lowest total cost reside. Adding more availability here will only increase the cost for the enterprise.
Figure 4-1. Example of the diminishing returns of increasing the availability.
To determine the level of which the enterprise needs availability it is important to determine the processes that are critical to the enterprise [2]. The critical systems and their impact on the enterprise is compared for severity. When the services and systems are collected the cost of their downtime should be calculated [2]. IBM provides the following steps to determine how much value availability has for the enterprise [23].
1. Create a list of all services you are providing that’s availability affect the revenue of the enterprise. Include all systems these rely on to function.
2. Calculate the cost of unavailability. What will it cost when these systems and services are down?
3. Divide into direct and indirect costs because it is important to include not only lost revenue but also lost production from employees that are dependent on the service and unable to work.
4. Consider tangible and intangible costs as there is costs that can be directly calculated in currency and costs not measured in money.
5. Determine the fixed cost and variable cost. Fixed costs are equal whenever there is outage. Variable depend on the duration of the outage.
0 100000 200000 300000 400000 500000 600000 700000 800000 90% 95% 99% 99.9% 99.99% 99.999% Cost of Downtime Cost of availability Total cost
Recovery Time Objective is the maximum duration for an outage before the costs are unacceptable [2]. A 10 seconds downtime might not be critical for a service while a downtime of 2 hours is unacceptable [3]. It is therefore important to not only think of nines (99.999%). The enterprise should define the RTO for each of their processes. Before deciding on an implementation the enterprise should calculate the TCO (total cost of ownership) and ROI (return on investment) for the selected solution. The solution should match the budget as well as the enterprise goals for availability.
Redundancy is a widely used technique to achieve high availability. Redundancy means having duplicate hardware/software which means there is an alternative path or component that steps in incase of failure. If a link or switch fails the traffic can go through another path. How much redundancy needed is decided by the enterprise requirement in convergence, physical layout, probability of failure [24].
Convergence
Convergence means how fast the network can recover. Some areas that need high availability is perfectly fine with a convergence in seconds. Usually in Data
Centers a much lower convergence time is required. Physical layout
Physical layout may make redundancy impractical, highly costly or even
impossible. The physical layout needs to be assessed in order to decide the best solution for high availability.
Probability of failure
Some systems and environments have a higher chance of failure which may mean that more than one redundant path is needed in order to assure a self-healing network.
Companies need to weigh the risk vs cost when they implement high availability. For each nine high availability cost increase exponentially and the probability and impact of an outage cost must be weighed with the cost of implementing redundancy in the network [24].
A redundant network that recovers automatic is not a book you can put on a shelf. If a failure occurs in a non-redundant network the IT-department would be notified by affected customers or employees about the failure and can then repair the failure. If a failure occurs in a redundant network the traffic will flow through the redundant path with minimum impact on employees or customers and the IT-department might not get notified. It is clear the IT department must be notified in some way as if the failed link is not repaired the network is currently running in a non-redundant state and a second failure will result in total loss. Therefore it is important that failures get repaired even if the network is operational [24]. A common approach and one of Roberts tips is using monitoring and logging for failure detection [25]. Monitoring can notify IT immediately after a failure and logging also gives IT information of where the failure is and what caused it.
5. Model
This section will present the major work of the paper. It will cover the model to be used for evaluation at Stora Enso pulp mill AB in Skutskär. This is also the model that will provide enterprises with a means to evaluate their current network.
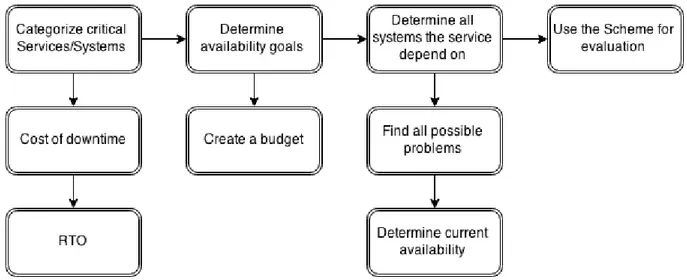
The model presented here is the main point of this paper and will help enterprises of different sizes and environments to evaluate their availability (see figure 5-1). First the model will be displayed and generally described. The model is divided in steps with examples that will follow the model through. The next section will present the case study where the model is used and will work as a guide.
Figure 5-1. The model illustrated.
5.1 Categorize critical Services/Systems
Inspect the critical services that are provided for employees and customers as well as services critical for business function and rate them from severity 1-5 according to their impact. After each system is categorized define the cost of downtime the service has and add the RTO for that service (see table 5-1).
Table 5-1. Table to categorize services.
Service Severity Cost of downtime/h RTO
Serverity: 1 – Very high, 2 – High, 3 – Normal, 4 – Low, 5 – Very low
A backup service severity might be categorized as high because if the main system crashes days of production could be lost although this type of service does not necessary need a low RTO. While access to the internet could hamper some departments production and be considered as high severity the RTO may be very different as revenue is lost the moment the service is unavailable.
5.2 Determine availability goals
The earlier step will provide the enterprise with information about your availability requirements and help determine the enterprise availability goals. After the business goals are determined a budget plan should be created matched to the boundaries of the downtime cost. The budget plan should be set at a service level so each service has a budget defined with the cost of downtime and severity in mind.
5.3 Determine all systems the service depends on
For each service identified for availability determine all the systems the service is dependent on in the environment. It is now important to have an understanding of the current systems that are used and how the service depends on them. After a thorough understanding of the environment exist list all the systems needed for the service. An example is provided using an application that is manually run from a host and collects information from the Internet (see table 5-2).
Table 5-2. Example of service categorized.
Service Severity Cost of downtime/h RTO
Application 3 3000 SEK/ h 1 min
All dependent systems must be accounted for as availability is a concept and a process is only reliable if all systems it depends on are reliable.
Dependent Systems:
Operator: Since this application is manually run there must be an operator running it. Host: If the host does not function the application cannot run.
Access to Internet: without access to the Internet the application cannot collect the data. Each of these systems can have several subsystems they are dependent on.
1. Operator
1.1. Presence: The operator must be present.
1.2. Knowledge: The operator must know about the application. 1.3. Memory: The operator might forget about the application. 2. Host
2.1. Hardware: A hardware error might make the host unusable.
2.2. Software: An unresponsive OS or the application itself will prevent it from running.
3. Access to Internet
3.1. Network path: A path from the host to the enterprise gateway.
3.1.1. Hardware: A link or device failure in the path may disrupt the path.
3.1.2. Software: Services that the network path is dependent on such as DHCP and routing may disrupt the path.
3.2. ISP: There may be a problem from the ISP to the rest of the network that will prevent access to the internet.
It is very important to account for all dependent systems as the number of problems that add to the failure probability of a service is directly related to the dependent systems it runs on. Missing a system might make the enterprise overlook a problem and learning of it through experience and if the enterprise has no solution ready the downtime that follows can be undesirably long.
5.4 Evaluation
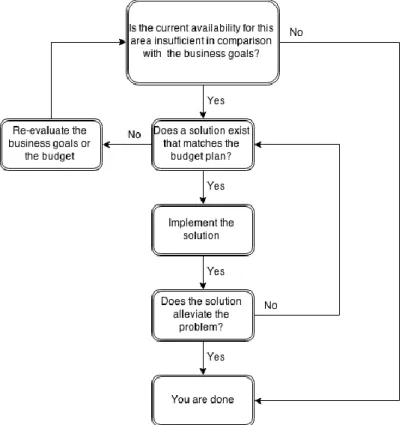
When evaluating the current availability use the earlier derived list of systems and evaluate the reliability of the service as a whole. This step has a simple scheme created for it (see figure 5-2).
Figure 5-2. Scheme for evaluation.
Before it is concluded that the current availability is sufficient for the service it should also be tested. Without testing the enterprise could be in a state of false assurance that could become very costly. There are several methods for testing as long as the testing is done with all the important factors of live environment it should be sufficient.
Put together all the problems that can affect it in a list and then find a solution that matches the budget as well as the RTO. For each problem there are several different solutions the enterprise could use. To illustrate two solutions are provided here to solve problems related to the operator in the earlier example (costs are omitted as they are dependent on several factors).
Example 1:
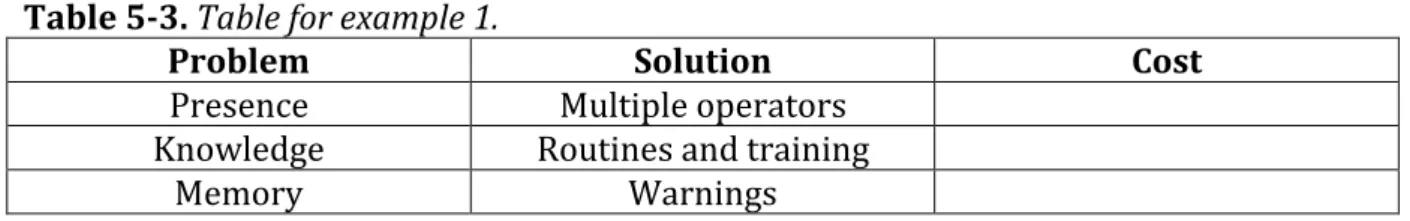
The company could have several operators working in shifts and if someone calls in sick have operators that can stand in as well as several operators capable of handling the application on site. To alleviate the problem of an operator not knowing about it, routines can be created. Graphical or acoustic warnings could be used to remember the operator if he forgets (see table 5-3).
Table 5-3. Table for example 1.
Problem Solution Cost
Presence Multiple operators
Knowledge Routines and training
Memory Warnings
Example 2:
The company could also hire someone to develop the application or a script to make it run automatic. This solution could be more costly to implement then the above but also more reliable and ignorant to human failure (see table 5-4).
Table 5-4. Table for example 2.
Problem Solution Cost
Presence Automatic
Knowledge Automatic
Memory Automatic
It is important that the enterprise put up realistically goals that which it can achieve so if a solution is not found the enterprise have to either lower its goals or increase its budget to find a solution.
When a solution is implemented it should be tested. Without testing the enterprise will have no idea if the solution alleviates the problem and when the enterprise gets to the point of ROI for the solution. As stated before there are several methods for testing as long as the testing is done with all the important factors of live environment it should be sufficient.
6. Application of model
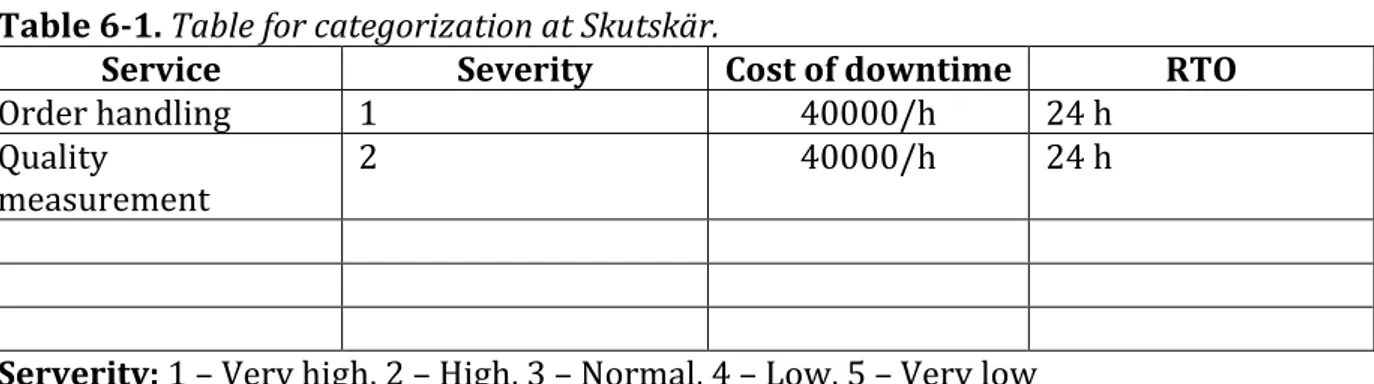
Using the model that was created an evaluation of the network at Stora Enso pulp mill AB in Skutskär was performed. It started by the IT manager being asked to categorize the business critical systems and estimate their value as well as define a RTO (see table 6-1). The cost of downtime could not be calculated so an estimation has been made that follows real world data.
Table 6-1. Table for categorization at Skutskär.
Service Severity Cost of downtime RTO
Order handling 1 40000/h 24 h
Quality
measurement 2 40000/h 24 h
Serverity: 1 – Very high, 2 – High, 3 – Normal, 4 – Low, 5 – Very low
Customers connect through internet and are using a proprietary system for order handling that include specifying parameters for the product such as quality and size. For them to be able to do this the system must be available. This service has an indirect cost of customer dissatisfaction. Quality measurement is used by the production and the production comes to an immediate stop if the measurement data is unavailable. This system is bought as a complete solution and hardware and software problems are handled by external supplier which the enterprise has an SLA with.
The availability requirements were now defined. The IT manager was asked to put together a budget for each individual service. There was however no way of getting a budget estimation in the limited time as it is not decided at this level. However the budget table can look like this (see table 6-2).
Table 6-2. Budget.
Service Cost of downtime/h Budget
When the budget is ready an understanding of the environment is necessary. The enterprise had limited documentation in layer 2 as well as a network design that spanned layer 2 all the way up to core. This lead to the creation of a network diagram. This map was created before the evaluation but was leveraged now in order to understand all systems the critical services depended on. Information about the services dependencies was also collected through dialogue with knowledgeable employees including the IT manager. The network map is displayed below with traceable information omitted (see figure 6-1). The decision to omit was made in order to protect the company as well supporting the use of this evaluation as a guide using generalized information.
Figure 6-1. Network Diagram of distribution and access layer.
The network is built up by two core switches and four distributions. What the network diagram here is not showing is that each distribution is made up of a stack with 2-4 3750 switches. By having access points linked to two different chassi in the stack both link and switch redundancy is possible.
Examination of the maps indicated interesting points in the network that might be vulnerable to congestion or SPOF. The network was sparsely using etherchannel and was running Rapid-PVST+ as spanning-tree protocol. An etherchannel link with one port down was found and was running in a non-redundant state. Spanning-tree was examined and it was discovered that no vlan load-balancing was used and all redundant links were non-utilized. Furthermore there were links in half-duplex running spanning tree and in such a state rapid failover is not possible with Rapid-PVST+ as it falls back to standard STP with a convergence of 30 seconds.
A baseline was earlier created by monitoring traffic on key links and devices used by the critical services. This baseline was referenced to find any reason of worry of congestion. Although the SNMP service stops at night for about 5 min on the core service (which is a reason to investigate) the traffic was unaffected and there was no sight of congestion. The baseline presented below showed that critical links had generally very low traffic volume except during backup where high bursts were present (see figures 6-2 to 6-4).
Figure 6-2. Graph of D1:s traffic towards C1.
Figure 6-3. Graph of D2:s traffic towards C1.
Figure 6-4. Graph of D3:s traffic towards C1.
With all the information collected through these earlier steps several things were concluded. The general design indicates some areas for improvement. Several SPOF was present in the network. Monitoring needs to expand in case redundant paths go down and are left unrepaired leaving the system in a non-redundant state. As this case study was limited to the network, systems not categorized as network elements were ignored.
Each service has their own list of dependent systems as well as a table of problems and solutions (see table 6-3, 6-4). This is the step when it is time to research solutions however in the current case study the research had already been performed at the start in order to create the model. When researching solutions one step to get a good overview of the options is to leverage the different best practices posted by different vendors. Each vendor has their own best practices that are directed to their own products. It is of course good to check a vendor that is currently being used but it is also important to check different vendors as many solutions are standardized and this give a more objective perspective.
Dependent systems for order handling: 1. Access to the Optivision Cluster
1.1. Network path 1.1.1. Hardware 1.1.2. Software 1.1.3. Power 1.2. Optivision service 1.2.1. Power 1.2.2. Hardware 1.2.3. Software 2. Internet access 2.1. Network Path 2.1.1. Hardware 2.1.2. Software
Table 6-3. List of problems and solutions.
System Problem Solution Cost
Network Path Link failure hardware Redundant links Current Link Failure Software UDLD + etherchannel 0
Device Failure Stackwise Current
Device Power UPS Current
Optivision Hardware Clustering Current
Software Clustering Current
Power Clustering Current
Dependent systems for Quality Measurement: 1. Access to the Optivision Cluster
1.1. Network path 1.1.1. Hardware 1.1.2. Software 1.1.3. Power 1.2. Optivision service 1.2.1. Power 1.2.2. Hardware 1.2.3. Software 2. Sensor 2.1. Power 2.2. Hardware 2.3. Software 3. Server 3.1. Power 3.2. Hardware 3.3. Software 4. Clients 4.1. Power 4.2. Hardware 4.3. Software
Table 6-4. List of problems and solutions.
System Problem Solution Cost
Network Path Link failure hardware Redundant links Current Link Failure Software UDLD + Etherchannel 0
Device Failure Stackwise 3750G
Device Power UPS Current
Optivision Hardware Clustering Current
Software Clustering Current
Power Clustering Current
Sensor Power UPS Current
Hardware SLA Current
Software SLA Current
Server Power UPS Current
Hardware Virtualization ?
Software Virtualization ?
Clients Power UPS Current
Hardware Redundant clients Current
Software Redundant clients Current
This area is the most crucial part of the enterprise where failures can lead to costly events. The sensor (mätram) measures the quality of the product and sends this
information on a local network to the server that processes this information. The server is dual connected on two different networks and clients request the information from the server through the other network (see figure 6-5).
Figure 6-5. Illustrating the flow of the quality measurement service. 6.1 Suggested Solutions
This section will explain each solution in detail as well as the reasoning behind them. Both suggested and current solutions that are adequate for the availability goals is included here.
Power
All devices are in need for power. The enterprise has already an implemented solution in the form of UPS. This protects the devices through backup power in case of a power interruption.
Link Redundancy
The current solution for redundant links is RSTP. However based on its convergence, simplicity, stability and its capability to load-balance link aggregation was decided as a solution instead. The current network uses a star topology and since the enterprise already have implemented a stacking solution at distribution there is a great opportunity to gain from the ability to use etherchannel cross stack. Etherchannel is also easy to configure and provides load-balancing leaving no unutilized links. Static aggregation is used instead of the negotiation protocols LACP and pagp. Pagp does not work with cross stack etherchannel so the choice is between static and LACP. Static aggregation was chosen because of its convergence as there is no need for negotiation of the link.
To configure etherchannel on a cisco switch put two or more port of the same speed and duplex settings and initiate the command channel-group # mode on where # defines the group number and logical interface of the etherchannel [26, s. 97-112]. These do not have to match on different switches but all ports to belong to the group must have the same group number [26, s. 97-112]. It is imperative that the ports have the same vlan and trunk settings in order to establish an etherchannel [26, s. 97-112] (see example 6-1).
Example 6.1
int f0/1 duplex full
switchport mode trunk
switchport trunk native vlan 10
switchport trunk allowed vlan 10,20,30,40 speed 100
channel-group 1 mode on int f0/2
duplex full
switchport mode trunk
switchport trunk native vlan 10
switchport trunk allowed vlan 10,20,30,40 speed 100
channel-group 1 mode on Device Redundancy
If you look at figure 6-5 it is shown that the sensor is connected to the switch and that switch is connected to a stack that is connected to the server. There is link redundancy towards the stack but no device redundancy. The switch identified as SPOF is currently of the model 3750. A solution to add a second 3750 switch and create a stack adding device redundancy for the service is proposed. The stack is auto configuring meaning there is no need to configure the switches similar to STP. Each switch is automatically added to stack and a master is elected when they are connected through the stack ports. Sensor
The sensor itself is a complete solution which availability is handled by the supplier through an SLA. There is no change to be made here but the SLA should be evaluated towards the availability goals.
Server
The server to process the sensor data is currently a SPOF. During a discussion it comes to light a solution is planned during the maintenance window. The enterprise has decided to virtualize the server which is good decision as it eliminates the SPOF. Therefore there is no need to suggest a solution for this area.
Internet Access
The CPE is currently also a SPOF, similar to the sensor this is under the appliance of an SLA. If there is a failure with the CPE it will be resolved within set boundaries. The same applies to the Internet service provider where an SLA determines the availability. The currently implemented solution is subject to an investigation but for the moment considered acceptable and will remain unchanged. The final solution for the quality measurement is displayed below (see figure 6-6).
Figure 6-6. Illustrating the proposed solution for the quality measurement service. 6.2 Observations
These are the suggestions that are deemed too costly or too impractical to implement and is therefore not proposed. However these are solutions that could be leveraged in the future and is therefore included. This section also includes suggestion about management of the network availability.
The current network indicates some areas for improvement. The current design has less flexibility and modularity in comparison with a design with the layer 2/3 boundary at the distribution. Since starting the routing at the core layer the ability to summarize routes is also lost. This has been omitted from solutions because the enterprise has vlans spanning end-to-end over several distributions as well as several services and dependencies based on the current design. To redesign the network topology is outside the scope of time for this project but the benefits of the layer 2/3 boundary design are presented here including the following.
The design provides fault isolation.
Minimizing MTTR by having a less complex design. Route summarizing lowers MTTR and lowers complexity Increases modularity and flexibility.
Eliminating SPOF
The current network is using Syslog and SNMP which means the enterprise currently has a good solution for monitoring. Monitoring speeds up detection and localization of errors. It minimizes MTTR that can help the enterprise achieve their RTO. The discovery of the network that was run displayed unfixed links in etherchannels. This means the monitoring should be extended to include all switches that are crucial and have an availability solution. A baseline should regularly be run so the enterprise can plan for capacity and QoS parameters. The 3750 models can support Netflow v9 if the software version is upgraded to 12.2(58).
The documentation should be extended as several issues have no routine on how to be solved. Each type of failure on each switch should have a documented solution for lower MTTR. When chasing RTO goals it is imperative to detect, localize and repair the error in a swift manner.
7. Review of results
After using the model to evaluate the availability goals and availability requirements the model have proven to be quite successful. The model determines the goals and requirements accurately and is easy to comprehend. The section of getting an understanding of the network is less detailing and gives minimal guidance. This section should have greater detail and give better guidance. Some guidance comes from the application but the model itself should introduce this to some degree. The service and problem section looked good at the model as it gives the necessary tools to define what needs to solved. After using the model this step has proven more demanding than expected and the results are hard to read. The last step introduces the flowchart where testing of the model is presented. This step should have been more detailed as it is a main point of evaluating availability.
After using the model it was realized that it was hard to delimit the work as what to include in the model. This has resulted in a model with diffuse boundaries of application. The model is limited in its application leading to a necessity of companies introducing other recommendations in order to achieve high availability. The importance of monitoring is brought up but is not included in the model. Other important features of a high availability model is disaster recovery and documentation. Each of these features are key aspects to be used in the aftermath of evaluating the availability. This is the reason why they were not included. In afterthought it is concluded that in order for the model to truly contribute and act as the replacement for best practices as it was intended these features should be included. Using the model responded to the simplicity that was intended. It was easy to follow the steps and apply it to the case study but time was limited and results were damaged by it. A more thorough risk analysis and a detailed budget plan would improve the results of the model greatly. The model have been used missing few key elements for it but considering the time the results are acceptable. Since the research was already performed a key aspect of the model is untested.
7.1 Related Research
There are several recommended practices and guides for implementation. There are also plenty of literature to highlight why and in what volume to implement it. Most of these are related to the current model but differ as the model is something in between these. In order to evaluate a network, information about why and how as well as the means to implement where limitations exist is needed. Research that is related include “Cisco High availability Implementation and design guide” as well as “Oracle database High availability overview”.
8. Conclusions
The model can be used as an aid and the primary tool for evaluating the enterprise network. It can provide an easy and simplistic guide for an engineer with limited knowledge to perform the evaluation. It will not be able to account for aspects of maintaining an available network. Additional guides need to be used for these aspects. It works on enterprises of different size and environments. The most limiting factor for not including a single model for evaluating, implementing and maintaining available networks is time.
1. What is the correct design path according to this network’s behavior and limitations and this company’s business goals?
Using the model at Stora Enso pulp mill AB in Skutskär has created a presentation with suggested improvements. The model emphasizes that the correct path is the one following the availability requirements and budget plan. Built on research of different solutions and their business goals the correct path been presented in form of proposed solutions.
2. What are the key factors in high availability that can be used in a model?
To achieve high availability it first need to be defined by the enterprise at which the model is used. As this model points out high availability is no absolute number but instead the level of availability that matches the enterprise requirements and goals. These factors are the founding stones in the model and leads to a model that is flexible enough to be used by different enterprises.
3. How do you make this model independent and neutral to be used by any company?
By focusing the model on problems and services the model stays independent of individual requirements and constraints. Solutions can be vendor specific as well as constraints and requirements. The model defines the specific requirements and constraints and creates independent solutions.
8.1 Future works
To improve the model several aspects of maintaining available networks can be included. This means including the tools and help for enterprise to decide what type of monitoring is needed and how it should be handled. This will help companies keep their network available and is a key point in reaching the enterprise availability goals. Without monitoring and fast error detection the enterprise availability is severely hampered. An important factor that can be included is a disaster recovery plan. This will provide enterprises a way to create a disaster recovery plan that is balanced to the availability goals of the company. A disaster recovery plan will help companies keep a level of business continuity during unexpected disastrous failures.
References
[1] Cisco Systems, “High Availability in Campus Network Deployments,” Cisco, 2004. [Presentation] Available: http://www.cisco.com/c/dam/en/us/products/collateral/ios-nx-os-software/high-availability/prod_presentation0900aecd803106dd.pdf. [Collected: 2015-04-12].
[2] Oracle, “Oracle Database High Availability Overview“, “Oracle Database Online Documentation 11g Release 1 (11.1),” Oracle, [ONLINE] Tillgänglig:
http://docs.oracle.com/cd/B28359_01/server.111/b28281/hadesign.ht#i1006168. [Hämtad:
2015-05-02].
[3]Peter S. Weygant, “basic High availability concepts”, “Clusters for High Availability: A Primer of HP Solutions, Second Edition,”Prentice hall.
[4]Radia Perlman, “Routing without tears, bridging without danger,” usenix, 2006. [PDF] Tillgänglig: https://www.usenix.org/legacy/events/usenix06/tech/slides/perlman_2006.pdf.
[Hämtad: 2015-04-25].
[5] Tony Jeffree et al, “IEEE Std 802.1D-2004,” IEEE, 4 Jun 2004. [PDF] Tillgänglig: IEEE explore, http://standards.ieee.org/getieee802/download/802.1D-2004.pdf. [Hämtad: 2015-05-02].
[6]Tony Jeffree et al, “IEEE Std 802.1w-2001,” IEEE, 14 Jun 2001. [PDF] Tillgänglig: IEEE explore, http://w3.tmit.bme.hu/courses/onlab/library/standards/802-1w-2001.pdf. [Hämtad:
2015-05-02].
[7] Cisco, “Understanding Rapid spanning tree protocol (802.1w),” Cisco, Oct 24 2006. [PDF] Tillgänglig: http://www.cisco.com/c/en/us/support/docs/lan-switching/spanning-tree-protocol/24062-146.pdf. [Hämtad: 2015-05-02].
[8] Robert M. Grow et al, “IEEE Std 802.1AX-2008,” IEEE, 26 Sep 2008. [PDF] Tillgänglig: IEEE explore, http://standards.ieee.org/getieee802/download/802.1AX-2008.pdf. [Hämtad:
2015-05-03].
[9] Cisco, “Cisco StackWise and StackWise Plus Technology,” Cisco, 2010. [PDF]
Tillgänglig: http://www.cisco.com/c/en/us/products/collateral/switches/catalyst-3750-series-switches/prod_white_paper09186a00801b096a.pdf. [Hämtad: 2015-05-19].
[10] HP, “Reducing network complexity, boosting performance with HP IRF technology,” HP, Sep 2010. [PDF] Tillgänglig: http://h17007.www1.hp.com/docs/reports/irf.pdf. [Hämtad:
2015-05-19].
[11] HP, “FAQ: HP Intelligent Resilient Fabric (IRF),” HP, April 2015. [PDF] Tillgänglig:
http://www8.hp.com/h20195/v2/GetPDF.aspx/4AA5-3379ENW.pdf. [Hämtad: 2015-05-19].
[12] Cisco, “Configuring Flex Links and the MAC Address-Table Move Update Feature,” Cisco,. [PDF] Tillgänglig:
http://www.cisco.com/c/en/us/td/docs/switches/lan/catalyst3550/software/release/12-2_25_see/configuration/guide/swflink.pdf. [Hämtad: 2015-05-19].
[13] J. Case et al, “RFC3176,” IETF, May 1990. [txt] Tillgänglig:
https://www.ietf.org/rfc/rfc1157.txt. [Hämtad: 2015-05-10].
[14] J. Peter Murray, “SNMP: simplified,” F5, 07 March 2008. [ONLINE] Tillgänglig:
https://f5.com/resources/white-papers/snmp-simplified. [Hämtad: 2015-05-10].
[15] Cisco, “Introduction to Cisco IOS® NetFlow,” Cisco, May 2012. [PDF] Tillgänglig:
http://www.cisco.com/c/en/us/products/collateral/ios-nx-os-software/ios-netflow/prod_white_paper0900aecd80406232.pdf. [Hämtad: 2015-05-10].
[16] B. Claise, B. Trammell, P. Aitken, “RFC7011,” IETF, Sep 2013. [PDF] Tillgänglig:
http://www.rfc-editor.org/rfc/pdfrfc/rfc7011.txt.pdf. [Hämtad: 2015-05-10].
[17] P. Phaal, S. Panchen, N. McKee, “RFC3176,” IETF, Sep 2001. [txt] Tillgänglig:
https://www.ietf.org/rfc/rfc3176.txt. [Hämtad: 2015-05-10].
[18] Radia Perlman et al, “RFC6325,” IETF, July 2011 [ONLINE] Tillgänglig:
https://tools.ietf.org/html/rfc6325. [Hämtad: 2015-04-27].
[19] Ronald van der Pol, “TRILL and IEEE 802.1aq overview,” RVDP, April 2012. [PDF] Tillgänglig: http://www.rvdp.org/publications/TRILL-SPB.pdf. [Hämtad: 2015-04-20].
[20] Peter Ashwood-Smith, “Shortest path bridge 802.1aq tutorial and demo,” nanog, oct 2010. [PDF] Tillgänglig:
http://www.nanog.org/meetings/nanog50/presentations/Sunday/IEEE_8021aqShortest_Path. pdf. [Hämtad: 2015-04-22].
[21] Matthew Blanshard, “Resilient ethernet protocol overview,” Cisco, Sep 13 2013. [PDF] Tillgänglig: ]
http://www.cisco.com/c/en/us/support/docs/lan-switching/ethernet/116384-technote-rep-00.pdf. [Hämtad: 2015-04-25].
[22] Priscilla Oppenheimer, “Top-Down Network Design,” 3rd, Indianapolis: Cisco Press, 2010.
[23] IBM, “Deciding what level of availability you need,” IBM, [ONLINE] Tillgänglig:
http://www-01.ibm.com/support/knowledgecenter/ssw_i5_54/rzalw/rzalwlevel.htm. [Hämtad:
2015-04-15].
[24]Mike Miclot, John Mower, “Reducing the Risk, Cost and Frequency of Production Stoppages Using Network Redundancy,” Belden, 2010. [PDF] Tillgänglig:
https://www.belden.com/docs/upload/Belden_Redundancy_WP.pdf. [Hämtad: 2015-04-10].
[25] Robert J. Shimonski, “The Importance of Network Redundancy,” windowsnetworking, 15 Jun 2010. [ONLINE] Tillgänglig:
http://www.windowsnetworking.com/articles-tutorials/netgeneral/Importance-Network-Redundancy.html. [Hämtad: 2015-04-10].
[26] Richard Froom, Balaji Sivasubramanian, Erum Frahim, Implementing Cisco IP
Switched Networks (SWITCH): Foundation Learning Guide. Indianapolis: Cisco Press,
Appendix 1
This test is done on direct link failures using redundant links so each of these solutions is applicable. The result of this is that STP works both on direct and indirect failures but then with longer convergence the other solutions cannot work with indirect failures. The test was made running a ping from the computer on vlan 1 to the loopback interface on the layer 3 switch (see figure 9-1). As the standard ping utility in windows waits for a reply before sending the next hrPING was used. hrPING does not wait for replies and the interval between each consecutive ping is adjustable down to 1 ms with an accuracy of μs. The interval was set to 10 ms and lost packets were count to measure the time leading to the test having an accuracy of 10 ms (see table 9-1).
Figure 9-1. The scenario used to test the different protocols convergence speed. The units had the current setup:
Dell latitude E6410 with windows 7 enterprise. Cisco Catalyst 2960 with IOS 12.2(53)
Cisco Catalyst 3560 with IOS 12.2(55) hrPING v5.06
Table 9-1. The test showing downtime in ms.
Test# Type RSTP MSTP Pagp LACP ON Flex
1 Failure 70 80 10 50 20 40 Preemption 20 10 0 0 0 30 2 Failure 80 60 30 30 20 50 Preemption 20 0 0 0 0 20 3 Failure 80 70 50 0 10 50 Preemption 10 10 0 0 0 10
What can be read from the test is that where etherchannel is applicable the static
bundling of links provides the fastest convergence. The results from RSTP and MSTP are very similar on direct link failures but remember this does not indicate the convergence speed of indirect failures or even with increased number of vlans.