STATE OF THE ART IN THE WASTE TO
ENERGY AREA
Technology and Systems
Eva Thorin, Lilia Daianova, Johan Lindmark, Eva Nordlander,
Han Song, Ari Jääskeläinen, Laura Malo, Emilia den Boer, Jan
den Boer, Ryszard Szpadt, Olga Belous, Taivo Kaus, Maarja
Käger
May 2011
Report no: O4.1.1
Disclaimer
This publication has been produced with the assistance of the European Union (http://europa.eu). The content of this publication is the sole responsibility of authors and can in no way be taken to reflect the views of the European Union.
Index
SUMMARY ... 4
1. INTRODUCTION ... 6
1.1 THE REMOWE PROJECT ... 6
1.2 WASTE UTILISATION PATHWAYS ... 7
2. BIOLOGICAL PROCESSES ... 9
2.1 BIOGAS FROM WASTE ... 9
2.1.1 The biological process ... 10
2.1.2 Pre-treatment ... 11
2.1.3 Process design and operation ... 11
2.1.4 Process modelling and control ... 17
2.1.5 Gas upgrading ... 19
2.1.6 The use of residuals ... 19
2.2 ETHANOL FROM WASTE ...20
2.2.1 Waste feedstock for ethanol production ...20
2.2.2 Pre-treatment ... 21
2.2.3 Process design and operation ... 22
2.2.4 The use of residuals ... 24
2.2.5 Other aspects ... 27
2.2.6 Utilization of bio-ethanol ... 27
2.3 BUTANOL FROM WASTE ... 28
3. THERMAL PROCESSES ... 29
3.1 RDF- REFUSE DERIVED FUEL ... 29
3.1.1 Preparation of RDF ... 30
3.1.2 Quality criteria for RDF ... 32
3.1.3 RDF use ... 33
3.2 COMBUSTION ... 34
3.2.1 Process design and operation ... 34
3.2.2 Other aspects ... 39
3.3 PYROLYSIS OF WASTE ...40
3.3.1 Process design and operation ... 41
3.4 GASIFICATION OF WASTE ... 42
3.4.1 Process design and operation... 42
3.4.2 Process modelling ... 49
3
3.4.1 Uses of the gas ... 52
3.4.2 Other aspects ... 53
4. BIOREFINERY AND INTEGRATED SYSTEMS ... 54
5. COMPARISONS OF DIFFERENT CONVERSION PROCESSES ... 56
6. CONCLUSIONS ... 59
Summary
The aim of this report is to describe the state- of-the-art concerning systems and technologies for utilising waste for energy purposes. The work presented is part of the project REMOWE - Regional Mobilising of Sustainable Waste-to-Energy Production part-financed by the
European Union (European Regional Development Fund) as one of the projects within the Baltic Sea Region Programme.
Waste is a heterogeneous energy source and different types of waste can be converted to different energy products in different conversion processes. The conversion processes can be divided into biological processes, that use microorganisms to convert a feedstock to energy rich products, and thermal processes where the feedstock is converted to heat, electricity and/or gas at high temperatures.
In anaerobic digestion biogas, mainly consisting of methane, is produced. A large variety of wastes are digested such as sludge from waste water treatment, grease trap sludge, manure, biowaste, municipal solid waste, food wastes, refuse derived fuel and industrial waste water. Important parameters in the design and operation are the temperature, the moisture content in the reactor, the number of steps and phases of the process, the mixing in the reactor, and the type and number of feedstock. Anaerobic digestion is today a well-proven technology for waste treatment but development is needed concerning feedstock pre-treatment, avoidance of inhibition, mixing, and monitoring and control.
Another biological conversion process that can use waste as feedstock is fermentation to ethanol or butanol. Wastes of interest for fermentation are industrial waste waters and lignocellulosic wastes such as straw and wood wastes. Fermentation of sugary wastes to ethanol is a mature and well-proven technology but fermentation of lignocellulosic waste and fermentation to butanol is still at the research stage. The development areas include
increasing the yield, process design, and increasing the energy efficiency including process integration.
Combustion is a mature and well-proven technology that has been used for waste treatment of many types of wastes such as municipal solid waste, refuse derived fuels, agriculture wastes, wood wastes, packaging waste, industrial waste, hazardous waste, and sludge from waste water treatment. Still, there are needs for development making the process more efficient as an energy conversion process, including improved emission control, plant efficiency and ash handling.
Pyrolysis and gasification have been used for waste treatment but the technology is still in the development stage. For pyrolysis the influence of process parameters on the gas and by-product quality and plant efficiency are of interest for further development. While, for gasification gas cleaning, tar reduction, process operation conditions and increasing plant energy efficiency are development areas. Types of wastes that are used in both pyrolysis and gasification processes are municipal wastes, refuse derived fuels and sludge from waste water treatment. There are also examples of other more specific wastes such as synthetic waste and
5 used tires that have been used for pyrolysis and packaging waste and hazardous wastes that have been used for gasification.
Anaerobic digestion, fermentation, gasification and pyrolysis give products that can be used as fuel in further energy conversion. Ethanol from fermentation is usually used as a fuel in transportation. The gas from anaerobic digestion can also, after upgrading, be used as fuel for transportation but it can also be used directly in an oven, gas engine or gas turbine for heat and power production. The gas from gasification and pyrolysis can be used in a similar way as the gas from digestion but it can also be further reformed for production of other types of transportation fuels.
Process modelling can be a usable tool for understanding complex energy conversion processes and for optimisation of operation conditions. Process modelling also offers the possibility to control the process and predict its outcome. For biogas production in anaerobic digestion and for thermal gasification there exist different modelling approaches.
Different waste to energy systems have been compared in literature. However, no clear conclusions about what waste to energy technology that is most favourable can be drawn from the studies found. The results of the comparisons are dependent on the conditions chosen for the study as for example where the system is located and what combinations that are included in the options compared.
1. Introduction
The aim of this report is to describe the state- of-the-art concerning systems and technologies for utilising waste for energy purposes. The authors of the report come from the following organisations:
Eva Thorin, Lilia Daianova, Johan Lindmark, Eva Nordlander, Han Song
Mälardalen University, School of Sustainable Development of Society and Technology, P.O. Box 883, SE-721 23 Västerås, Sweden
Ari Jääskeläinen
The Municipal Federation of Savonia University of Applied Sciences, P.O. Box 6, FI-70201, Kuopio, Finland
Laura Malo
Centre for Economic Development, Transport and the Environment for North Savo (CNS), North Savo Ympäristö ja luonnonvarat, PL 1049 Sepänkatu 2B, FI-70101 Kuopio, Finland Emilia den Boer, Jan den Boer, Ryszard Szpadt
Wrocław University of Technology, Institute of Environment Protection, Wybrzeże Wyspiańskiego 27, 50-370 Wrocław, Poland
Olga Belous
Klaipeda University, H. Manto g. 84, LT- 92294 Klaipeda, Lithuania Taivo Kaus, Maarja Käger
Estonian Regional and Local Development Agency, Ahtri 8, EE-10151Tallinn, Estonia
1.1 The REMOWE project
The work presented is a part of the project REMOWE - Regional Mobilising of Sustainable Waste-to-Energy Production part-financed by the European Union (European Regional Development Fund) as one of the projects within the Baltic Sea Region Programme. The overall objective of the REMOWE project is, on regional levels, to contribute to a decreased negative effect on the environment by reduction of carbon dioxide emissions by creating a balance between energy consumption and sustainable use of renewable energy sources. Reduction of carbon dioxide emissions and use of renewable energy sources are broad areas and this project will focus on energy resources from waste and actions to facilitate implementation of energy efficient technology in the Baltic Sea region within the waste-to-energy area. The focus is to utilize waste from cities, farming and industry for energy purposes in an efficient way. The problem addressed by the project concerns how to facilitate the implementation of sustainable systems for waste-to-energy in the Baltic Sea region and specifically, as a first step, in the project partner regions.
The project partnership consists of Mälardalen University, with the School of Sustainable Development of Society and Technology coordinating the project, and The County
7 Administrative Board of Västmanland in Sweden, Savonia University of Applied Sciences, Centre for Economic Development, Transport and the Environment for North Savo, and University of Eastern Finland (UEF) in Finland, Marshal Office of Lower Silesia in Poland, Ostfalia University of Applied Sciences, Ostfalia University of Applied Sciences
Braunschweig / Wolfenbüttel in Germany, Klaipeda University in Lithuania, and Estonian Regional and Local Development Agency (ERKAS) in Estonia.
First, partner regions will do parallel investigations on the current status, the bottle-necks and the needs for development and innovation. Partnering regions will then jointly study possible future status and paths to get there, taking into consideration the basis of each region. Possibilities to build a regional model of the waste-to-energy utilization will be piloted in the project, with North Savo in Finland as the target region.
The project activities are divided into 5 work packages (WP). WP 1 concerns project management and WP 2 contains the project communication and information activities. In WP 3 the current status of the partner regions is explored, in WP 4 the possible future status is investigated and in WP 5 modelling of a sustainable regional waste-to-energy system will be studied.
The work presented in this report is part of the work in WP 4. The aim of this WP is to find and improve possibilities within the whole partnership for development in the waste-to-energy area. The starting point will be the current status in the partner regions, investigated in WP3. To be able to find possible future systems it is also important to include knowledge about the state of the art for waste- to-energy production systems and technology and to develop it further for the conditions in the partner regions. Another aim of this WP is to promote new and innovative solutions and strategies for development in the waste-to-energy area. For this it is important to include views and wishes from versatile players in the field, including both international experts in the area and regional stakeholders such as SME:s. This state of the art report presents knowledge in the waste- to- energy area reported in international journal publications, EU-project reports, national reports and websites of companies and organisations. The focus is on areas of interest for the project partners and the further work in the project to find possible future systems and improvements within the waste-to-energy area.
1.2 Waste utilisation pathways
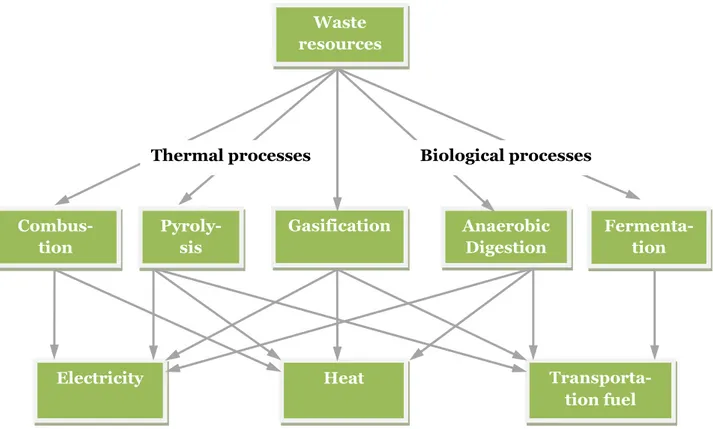
Waste is a heterogeneous energy source and different types of waste can be converted to different energy products in different conversion processes. Figure 1.1 shows an overview of possible pathways for waste to energy conversion.
In Chapter 2 and 3 of this report an overview of the conversion processes and problems and development discussed in literature today is given. In Chapter 4 and 5 some examples on integration of several systems and studies concerning comparison of different systems for waste-to-energy utilisation is presented. The report is finalised with some conclusions of the information found.
Figure 1.1 Waste to energy conversion pathways. Waste resources Anaerobic Digestion Fermenta-tion Pyroly-sis Gasification Combus-tion
Electricity Heat
Transporta-tion fuel
Biological processes Thermal processes
9
2. Biological processes
In biological processes microorganisms are used to convert a feedstock to energy rich products such as biogas and ethanol.
2.1 Biogas from waste
Biogas is produced using microorganisms that transform the raw material into methane and carbon dioxide in an anaerobic digestion process. Depending on the used material for digestion (e.g. waste) also H2S and NH3 in the range of ppm can occur as well as additionally
trace gas compounds in ppb range (Ahrens, 2011).
Germany is the leading country for biogas production in Europe and in year 2000 there were 850 biogas plants in Germany, in 2006 the number was 3500 and there are plans to
construct 43000 biogas plants until year 2020 (Deublein and Steinhauser, 2011). According to De Baere et al. (2010) the number of installed digesters for anaerobic digestion of
municipal solid waste (MSW) and biowaste in Europe is about 200, with a total capacity of about 6 million tons per year. In Figure 2.1.1 the percentage of the biogas production in Europe for the European countries is presented.
Most research on anaerobic digestion for biogas production has concerned using sludge from municipal waste water treatment plants or manure as the substrate. However, interest in producing biogas from any kind of organic waste as well as from different crops and farm land residues has increased. For example in Germany, biogas production began with using manure as a substrate. After year 2000 pre-sorted organic wastes were started to be used and energy crops became a matter of interest after 2004. Today, the technology for biogas
production is not optimized, and for biogas to be fully commercially competitive with other types of fuels, improvements have to be made. There are for example questions
Figure 2.1.1 Percentage of total biogas production in Europe 2009 (in total 8.3 million tons of oil equivalent). (Eurobserver, 2010) 53% 20% 6% 5% 3% 3% 2% 1% 1% 6% Germany UK France Italy The Netherlands Spain Austria Sweden Poland Others
concerning the influence of the microbiological community, inhibition of different substances, like ammonia, on the process and discussions about different pre-treatment methods (Nielsen and Angelidaki, 2008;Palatsi et al., 2009;Weiland, 2010). The influence of the substrate used on the gas is also a matter of interest.
2.1.1 The biological process
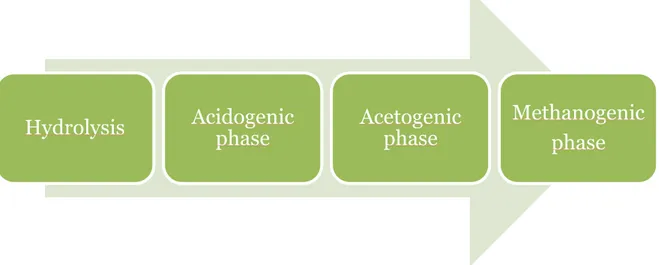
The biogas process can be divided into four steps: hydrolysis, acidogenic phase, acetogenic phase and methanogenic phase, see Figure 2.1.2.
The incoming substrate is built of carbohydrates, proteins and fats and these compounds are not water-soluble. These undissolved compounds are broken down into water-soluble fragments (monomers) by exoenzymes produced by bacteria. The bacteria can produce two kinds of enzymes, endoenzymes and exoenzymes. The difference is that endoenzymes brake down substances within the bacteria cell while exoenzymes are released from the bacteria and brakes down substances outside the bacteria cell. Not all bacteria produce exoenzymes and typically one exoenzyme can only degrade one type of substrate so a large group of bacteria is needed for this process. The products of this stage are some simple sugars, fatty acids and amino acids. The monomers that were the products of the hydrolytic phase can now be taken up by the bacteria, even those that do not produce exoenzymes, and be further degraded into short-chain organic acids, alcohols, hydrogen and carbon dioxide.
Acetogenesis can either be seen as a separate step or as a part of the acetogenic phase. The product of the acetogenic phase is acetate. Acetate is important because it is the primary substrate used by methanogenic microorganisms. In the methanogenic phase the
methanogenic microorganisms form methane using mostly acetate, carbon dioxide and hydrogen gas. Methane can also be formed from some other organic compounds but all compounds that are not degraded by the methanogenic bacteria will accumulate in the digester. (Gerardi, 2003; Deublein and Steinhauser, 2008)
Weiland (2010) mentions that the further development of the biogas production process includes better understanding of the influence of the structure of the community of microorganisms on the stability of the process and the biogas yield.
Figure 2.1.2. The biogas process can be divided into four steps.
Hydrolysis
Acidogenic
phase
Acetogenic
phase
Methanogenic
phase
11
2.1.2 Pre-treatment
For improving the amount of biogas that can be produced from the substrate feed to the digester the substrate can be pre-treated to make the material more available for the
microorganisms. There are several possible treatment methods such as mechanical pre-treatment, steam pre-treatment and electroporation.
In the pre-treatment method called electroporation the substrate is exposed to electrical pulses with the aim to form pores in the cell membrane of the material. The method is on the research stage and has been studied for pre-treatment of sewage sludge (Choi et al., 2006), source-sorted municipal organic solid waste (Carlsson et al., 2008; Uldal et al., 2009) and ley crop silage (Lindmark et al. 2010) . The studies have shown an increase of biogas production, compared to untreated material, of up to 14 % for municipal waste (Uldal et al., 2009), up to 100 % for ley crop silage (Lindmark et al. 2010) and up to 150 % for sewage sludge (Choi et al., 2006). Lindmark et al. also showed that the energy balance for the pre-treatment is positive and gives 2-5 times larger energy output in the form of methane compared to the electric energy input for the process. The method has to be further developed to be possible to use in full-scale. For example, the influence of the shape and size of the reaction container and of the electrodes on the performance of the treatment has to be studied as well as optimal field strength, frequency and the specific energy input per pulse (Lindmark et al., 2010; Lebovka, 2002; Bazhal et al., 2003; Ade-Omowaye et al., 2000)
2.1.3 Process design and operation
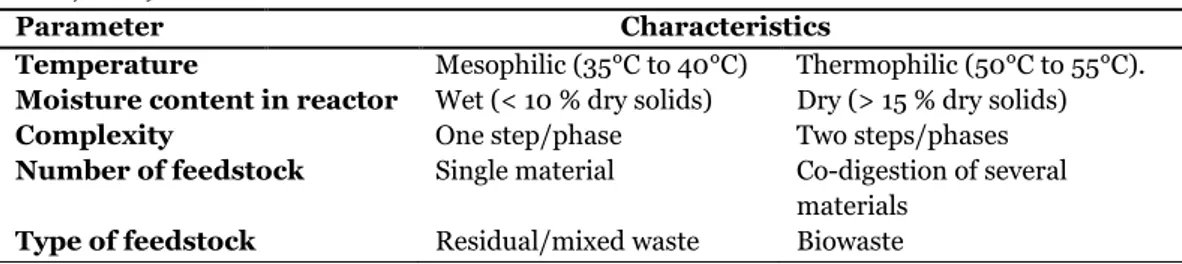
In a paper presented by Hilkiah Igoni et al. (2008) the key analyses involved in the design of anaerobic digesters for the production of biogas from municipal solid waste are reviewed. The authors draw the conclusion that not much can be found in literature about the design of processes using solid waste for biogas production. In a book by Deublein and Steinhauser (2011) the current knowledge about biogas production and plant design is summarized. De Baere et al.(2010) defines three categories of digesters for anaerobic digestion of municipal waste and biowaste based on capacity, smaller plants (8000- 15 000 tons/year) medium sized plants (30 000-50 000 tons/year) and large plants (100 000 to 200 000 tons/year) and conclude that new installations in Sweden, Norway, Austria and Switzerland are often smaller plants, while medium sized plants are more common in Germany, Belgium and Italy and large plants in UK and France. The type of plants that are used can be classified by several different design and operation parameters. The most important parameters are summarised in Table 2.1.1
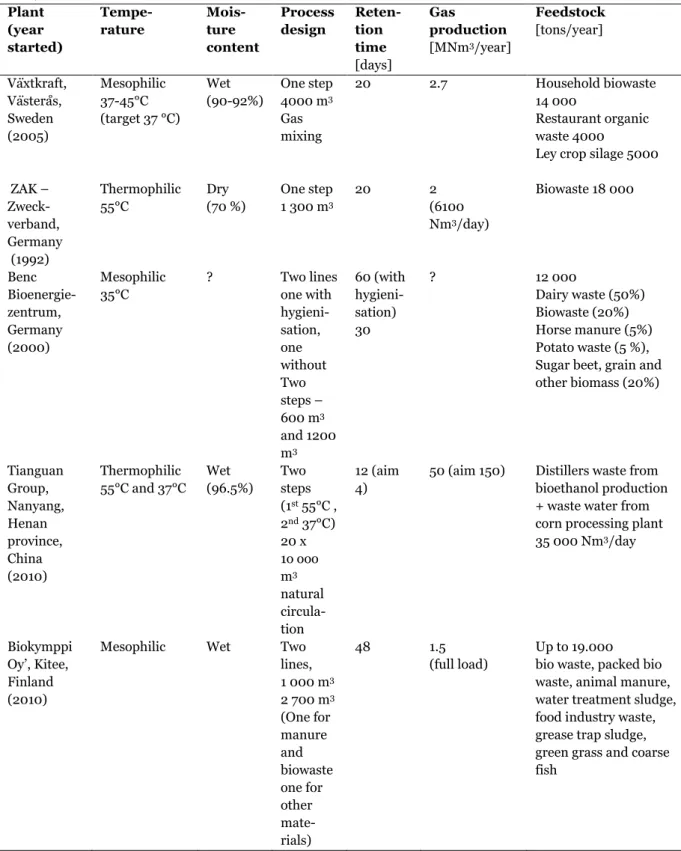
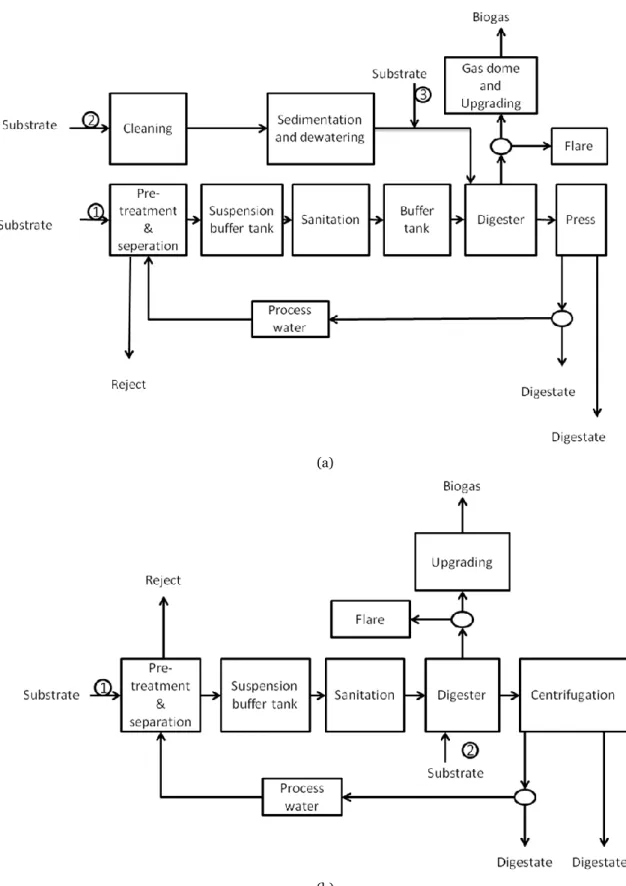
In Table 2.1.2 data for some existing biogas plants are given. In Figure 2.1.3 examples of process layouts for biogas plants using waste as substrate are presented and Figure 2.1.4 shows a biogas plant in Kitee, Finland.
Table 2.1 .1 Design and operation parameters used for classification of anaerobic digestion plant types. (De Baere et al., 2010)
Parameter Characteristics
Temperature Mesophilic (35°C to 40°C) Thermophilic (50°C to 55°C).
Moisture content in reactor Wet (< 10 % dry solids) Dry (> 15 % dry solids)
Complexity One step/phase Two steps/phases
Number of feedstock Single material Co-digestion of several
materials
Type of feedstock Residual/mixed waste Biowaste
Temperature
Mesophilic operation temperatures are more common than thermophilic for digestion of MSW and biowaste. About 70 % of the installations done in Europe from 1991 are mesophilic even though thermophilic installations have increased after 2005 (De Baere et al., 2010). Also for agricultural biogas production mesophilic operation is most common (Weiland, 2010). Weiland also points out that with increased use of heat from combined heat and power (CHP) biogas plants or biogas production where the gas is not used for CHP but for example is upgraded and injected into the natural gas grid the mesosophilic process could also be more energy efficient. Suryawanshi et al. (2010) summarise knowledge about thermophilic anaerobic digestion. They present data from 12 studies of thermophilic
anaerobic digestion of waste of which 9 were lab-scale studies. Most studies concerned MSW or cow manure as substrate but there are also some studies on industrial wastes. Their conclusion is that thermophilic operating temperature is interesting since it gives faster reaction rates and higher gas production but also because of better possibilities for
destruction of pathogens at high operating temperature. The drawbacks mentioned are high energy demands, long start-up time, higher sensitivity of the microorganisms for
environmental changes and with that a more unstable process. Moisture content in the reactor
The dry digestion process is an anaerobic digestion technology for solid, stackable biomass and organic waste, which cannot be pumped. It is mainly based on a batch wise operation with a high dry matter content ranging from 20 to 50 % at mesophilic temperatures.
According to De Baere et al. (2010) about 60 % of the installed capacity in Europe in 2010 for digestion of MSW uses dry processes and the plug flow type reactor is the most commonly used technique in Europe. Compared to wet digestion, the demands on feedstock are extremely low. Any organic solid mass that can be tipped, such as biowaste, cuttings and manure with up to 60% of dry substance can be used. Another advantage is also higher loading rates for the reactor in a dry process and with that smaller reactor for the same amount of substrate compared to a wet process. However, a disadvantage is that the
equipment for handling of the dry material has to be more robust and with that usually more expensive. (De Baere et al., 2010; Kayhanian et al., 2007). The Dranco (Dry ANaerobic COmposting) process was developed in Belgium for high-solids anaerobic digestion of refuse derived fuel (RDF). The RDF is prepared by sorting incoming urban solid waste. The Dranco system is capable of removing most metals, glass, plastic, stone, recoverable paper, and other non-biodegradable items. The anaerobic treatment takes place in a vertical digester for a
13 Table 2.1.2 Biogas production techniques in some existing biogas plants using waste as feedstock. (Svensk
Växtkraft, 2007; Malo and Turunen , 2010; Tianguan Group, 2011; Juvonen, 2010; Juvonen, 2011, Bioenergia, 2011) Plant (year started) Tempe-rature Mois-ture content Process design Reten-tion time [days] Gas production [MNm3/year] Feedstock [tons/year] Växtkraft, Västerås, Sweden (2005) Mesophilic 37-45°C (target 37 °C) Wet (90-92%) One step 4000 m3 Gas mixing 20 2.7 Household biowaste 14 000 Restaurant organic waste 4000
Ley crop silage 5000 ZAK – Zweck-verband, Germany (1992) Thermophilic 55°C Dry (70 %) One step 1 300 m3 20 2 (6100 Nm3/day) Biowaste 18 000 Benc Bioenergie-zentrum, Germany (2000) Mesophilic 35°C ? Two lines one with hygieni-sation, one without Two steps – 600 m3 and 1200 m3 60 (with hygieni-sation) 30 ? 12 000 Dairy waste (50%) Biowaste (20%) Horse manure (5%) Potato waste (5 %), Sugar beet, grain and other biomass (20%) Tianguan Group, Nanyang, Henan province, China (2010) Thermophilic 55°C and 37°C Wet (96.5%) Two steps (1st 55°C , 2nd 37°C) 20 x 1o ooo m3 natural circula-tion 12 (aim 4)
50 (aim 150) Distillers waste from bioethanol production + waste water from corn processing plant 35 000 Nm3/day
Biokymppi Oy‘, Kitee, Finland (2010)
Mesophilic Wet Two lines, 1 000 m3 2 700 m3 (One for manure and biowaste one for other mate-rials) 48 1.5 (full load) Up to 19.000 bio waste, packed bio waste, animal manure, water treatment sludge, food industry waste, grease trap sludge, green grass and coarse fish
(a)
(b)
Figure 2.1.3 Examples of two biogas plants using several waste streams (co-digestion) as substrate. In process (a) the substrates are organic MSW (1), sewage sludge (2) and fat removal sludge, distiller's waste, remains from bio oil production and confiscated liquor (3) and in process (b) the substrates are organic MSW and grease trap sludge (1) and ley crops silage (2). In both plants the raw biogas is upgraded to vehicle fuel.
15 Figure 2.1.4. Biokymppi Oy‘s biogas plant in Kitee, Finland. Photo: Nikon Kuvauspalvelu.
period of 12–18 days, followed by a post-digester with a retention time of 2–3 days. The digester operates under mesophilic conditions. (Kayhanian et al., 2007)
Through the pre-treatment by mixing and storing the substrates first aerobic biological conversion is provoked in the material for dry digestion. The temperature increase in this aerobic phase is catalysing the start of the anaerobic mesophilic or thermophilic operation. The initial self-heating reduces the heat requirements during the process. The biomass is digested under airtight conditions after inoculation or flooding with digested substrate. The further inoculation with bacterial matter is taking place through recycling of a bacteria rich percolation liquid, which is sprayed over the biomass. When necessary the temperature of the process can be regulated through a built in floor heating system in the digester and an
installed heat exchanger in the tank for the percolation liquid. (Köttner, 2002)
The wet digestion process is the most common used in agricultural biogas plants (Weiland, 2010) and usually continuously stirred tank reactors (CSTR) are used (De Baere et al., 2010; Weiland, 2010). In the wet biogas production process the substrate needs to be mixed with water if the dry solids content is too high. One area with improvement possibilities in the wet biogas production process is the handling of process water. To reduce the amount of fresh water needed, it can be of interest to recirculate water in the process. At Mälardalen
University studies have been done to investigate the possibility to improve the performance of a biogas production plant by membrane filtration of the process water (Thorin et al., 2009, Lindmark et. al, 2010). Membrane filtration in connection with anaerobic digestion processes have been described in several studies, for example Pillay et al. (1994), Ince et al. (2001), Saddoud et al. (2007), Zhang et al. (2008), and Stamatelatou et al. (2009). The main focus in those studies was, however, to use the digestion process and membrane filtration for waste water treatment to reduce the COD (chemical oxygen demand) of a stream to be emitted.
Complexity
Another area of importance for the process design and performance is the circulation of the material in the digester. The biogas production process inside the digester is dependent on good and even mixing for distribution of microorganisms and nutrition, inoculation of fresh feed, homogenizing of the material and for the removal of end products of the metabolism (Deublein and Steinhauser, 2011). Good mixing also gives a uniform temperature gradient in the reactor, destructs floating and sinking layers and prevents the substrate from leaving the digester prematurely because of short circuiting of the flow (Deublein and Steinhauser, 2008;Weiland 2010). There is a lack of knowledge about how much mixing is needed to get a good gas production. A general recommendation from the United States Environmental Protection Agency (EPA) is a power input of 5 to 8 W/m3 of digester volume (US EPA, 1979).
Many researchers today argue the case that too much mixing could be bad for the process and that a reduction in mixing intensity leads to better process performance (Stroot, et al., 2001; Vavilin, et al., 2005). The microorganisms themselves are sensitive to too intense mixing and can be harmed because of it (Deublein and Steinhauser, 2008). Even though mixing is considered to be an important parameter for the biogas production few publications on work being done in this area can be found. Weiland (2010) points out the development of new mixing technologies as one area of importance for development of the biogas production process. The mixing inside the digester can be made in several ways. It can be made mechanically, hydraulically by using pumps and pneumatically by using the gas itself for mixing the liquid. Mechanical mixing with different types of agitators is the most common type of mixing being used in Europe today (Deublein and Steinhauser, 2008; Weiland 2010). Pneumatically forced circulation stands for about 12 % of the used mixing systems in Europe and can be used for wet processes. An advantage of the pneumatically forced circulation is that there are no moving parts in the digester (Weiland, 2010). However, studies have shown the risk for poorly mixed zones when using this technique (Karim et al., 2004; Karim et al., 2007; Lindmark et al., 2009). The hydraulically mixing with pumps is only used for some few specific types of reactors (Weiland, 2010).
Due to the possibility to optimize the conditions for the different steps in the anaerobic digestion process (see Chapter 2.1.1) a two phase process with two reactors in series can be used in the biogas production process. Concerning digestion of MSW De Baere et al. (2010) conclude that the share of two phase processes has declined during later years and only about 5 % of the new installations during 2005 to 2010 was two phase systems. This is due to that the benefit of higher output is not considered to compensate for the higher complexity and higher costs for a two phase system. Weiland (2010) also point out the difficulty of
controlling the process parameters for achieving the wanted conditions in the two different phases. For energy crop digestion processes it is an advantage to have a two-step process with two reactors but here both hydrolysis and methanation takes part in both reactors (Weiland, 2010). It is also possible to have two steps with different temperatures, a so called
temperature-phased process, which has been shown to give higher methane production than a two phase process for some co-digestion cases (Schmit and Ellis, 2001).
17 Feedstock
Co-digestion of different substrates can be done to improve the biogas yields due to better balance of nutrients in the mixed substrate or to lower costs due to more efficient use of equipment (Alatriste-Mondragón et al., 2006). Alatriste-Mondragón et al summarised the results of 22 co-digestion studies. Organic MSW, MSW and cattle manure were the most common substrates studied and the most common co-digestates were agriculture material, industrial wastes and municipal food and vegetable wastes. The conclusion is that most studies show good results with an increase in biogas production of up to 60% mainly due to increased organic loading rates.
2.1.4 Process modelling and control
The microorganisms in the biogas production process are sensitive to changes in their environment and because of this, controlling and predicting the process is challenging. Accroding to Weiland (2010) process monitoring and control are among the improvements needed for further development of the biogas production process. By process modelling the process can be studied in a cost and time efficient way to get a better understanding of the process and its optimal working conditions. Furthermore, a model also offers the possibility to control the process and predict its outcome. The development of mathematical models for describing anaerobic digestion has a long history. The first dynamic mathematical model was developed by Andrews in 1969 (Lübken et al., 2010). This model and many following models, were based on the concept of a rate-limiting step. The models assumed that the aceticlastic methanogenic process step was rate limiting and therefore the models only considers this step. However, later studies found that this is not always true. Instead the first step,
hydrolysis, was more likely to be limiting (Tomei et al., 2009). Tomei et al. made a review on the modeling of anaerobic digestion of sludge and divided the models in three main groups, classified according to how advanced the characterization of the substrate is: simple substrate characterization models, intermediate substrate characterization models and advanced substrate characterization models. The simple substrate characterization models do not distinguish between different components of the substrate. These models are early models (1980s) and are also of rate-limiting step kind. The modern models are classified as advanced characterization models. Tomei et al. describes three such models: Angelidaki et al. model, Siegrist et al. model and Anaerobic Digestion Model No. 1. In Angelidaki et al‘s model (Angelidaki et al., 1999) the substrate is defined by its organic and inorganic composition. The organic components are carbohydrates, proteins, lipids and their degradation
intermediates. The inorganic components included are: ammonia, phosphate, carbonate, hydrogen sulfide, anions and cations. There are six kinetic equations used in the model, one for each step. The steps are: (1) hydrolysis, (2) acidogenic glucose-degrading, (3) lypolytic, (4) LCFA-degrading acetogenic, (5) VFA- degrading acetogenic and (6) aceticlastic methanogenic steps.
The ADM1 model
In 1998 the International Water Association (IWA) formed a task group called the IWA Task Group for Mathematical Modelling of Anaerobic Digestion Processes to create a common platform for anaerobic process modeling and simulation. The model was first presented in 2001 and is called Anaerobic Digestion Model No. 1 (ADM1). The task group had several
members and it can be noted that both Angelidaki and Siegrist (mentioned above as researchers behind two of the more modern models) were members of it. The model
considers both biochemical processes (involving living organisms) as well as physicochemical processes (not involving living organisms). The biochemical processes described are
disintegration, hydrolysis, acidogenesis, acetogenesis and methanogenesis. Concerning the physicochemical processes, liquid-gas processes (liquid-gas transfer) and liquid-liquid processes (ion association/dissociation) are described but not solid-liquid processes due to difficulties in describing them. (Batstone et al., 2002). However, Kleerebezem and van Loosdrecht have pointed out some weaknesses in ADM1. Their three main points were that there are inaccuracies in the stoichiometry, some problems with the solid retention time and that there is a lack of restrictions for the thermodynamic boundaries. (Kleerebezem and van Loosdrecht, 2006).
The ADM1 has been used by several researchers. Blumensaat and Keller (2005) used it to model a two-step digester (a digester that has a thermophilic pre-treatment step and a mesophilic main treatment step) and needed to make several modifications in order to get the model to be in agreement with the data from their pilot-scale process. Derbal et al. (2009) used the ADM1 to model co-digestion of organic waste with activated sludge and found the model to show ―acceptable simulating results, regarding the number of parameters involved and processes considered‖. However, the authors mean that the model is limited in simulating complex processes. They admit that it may be due to that some of the input parameters were obtained from literature. Furthermore, Lübken et al. (2007) used ADM1 to model an anaerobic digester with cattle manure and energy crops feed stock. They also had some trouble in setting up the parameters for the model and also utilized literature values to some extent. This illustrates one of the greater difficulties with ADM1, that it requires a detailed characterization of the substrate (Daels et al., 2009, Kleerebezem and van
Loosdrecht, 2006), requiring measurements that are not usually made when investigating a biogas plant or wastewater treatment plant and that might not be possible to do on a regular basis. There have been some attempts to circumvent this problem.
Kleerebezem and van Loosdrecht described one method for waste characterization that only needs measurements of Chemical Oxygen Demand (COD), Total Organic Carbon (TOC), organic nitrogen (Norg) and alkalinity (Alk) that, according to the authors, are usually
included in periodic measurements of anaerobic digesters. Zaher et al. (2009a) also created a procedure to characterize waste in order to generate input variables for ADM1. They based their procedure on methods previously created by others, among them Kleerebezem‘s and van Loosdrecht‘s method and later on generalized their procedure and implemented it as a general transformer model that can interface ADM1 to ―any combination of co-digestion wastes‖ (Zaher et al., 2009b).
Other modeling approaches
However, ADM1 is not the only model used at present. An example of another model is a model developed by Abu Qdais et al. (2010) which models biogas production with the aim of optimizing the process, using an artificial neural network. The input for their model was temperature, total solids, total volatile solids and pH and the output is the percentage of
19 methane in the gas stream. Abu Qdais et al. tested their model with input data was gathered from a full-scale biogas plant and there was a good match between the model data and the actual data. There are a few other artificial neural network models in the field but none that has been directly aimed at modeling the amount of biogas produced. Nopharantana et al. (2003) created a model describing the operation of a sequential leach bed even though the focus was not on biogas production. Nopharantana et al. (2007) also created a model for anaerobic batch digestion of MSW. The model is described as a dynamic mass balance. The substrate is represented by two components, an insoluble part and a soluble part. The biodegradable proportions of these parts were determined by experiments. Four bacterial groups were identified and stoichiometry equations were set up for each group as well as rate expressions. The kinetic parameters were then either determined through experiments or from literature.
2.1.5 Gas upgrading
Upgrading the biogas includes removing carbon dioxide to increase the content of methane and to remove hydrogen sulphide and water which can cause damage in the gas utilization system (Weiland, 2010; Petersson and Wellinger, 2009). Other possible impurities are nitrogen, oxygen, ammonia, siloxanes, and particles (Petersson and Wellinger, 2009). Desulphurisation can be done biologically, either in the reactor headspace or in filters outside the reactor, or it can be done by binding to ferrous compounds (Weiland, 2010). Carbon dioxide can be removed by scrubbing with water or organic solvents, pressure swing adsorption with activated carbon or molecular sieves, chemical washing with alakanol amines, using membrane technology or cryogenic separation where the two first techniques are the most common (Weiland, 2010) and cryogenic separation is a new technology under development (Petersson and Wellinger, 2009). Other methods to separate carbon dioxide studied on the research level are in situ methane enrichment, with desorption of carbon dioxide from digester sludge recirculated to the digester, and ecological lung using the enzyme carboanhydrase (Petersson and Wellinger, 2009). Adsorption with activated carbon and molecular sieve is also mentioned as possible processes to remove water (Petersson and Wellinger, 2009). Other alternatives for removing water are cooling, compression,
adsorption on silica oxide or absorption in glycol solutions or hygroscopic salts (Petersson and Wellinger, 2009). According to Petersson and Wellinger (2009) the most used
techniques for biogas up-grading are pressure swing adsorption, water scrubbing, organic physical scrubbing and chemical scrubbing.
The main driving forces for development of the gas-upgrading techniques are to lower the costs both for investment and operation and to decrease the methane emissions (Petersson and Wellinger, 2009).
2.1.6 The use of residuals
Biogas residues can be used as fertilizer on farmland supplying the soil with both nutrients and organic carbon. This is for example done with the residues from the Växtkraft biogas plant in Västerås, Sweden and from the Biokymppi Oy plant in Kitee, Finland, both presented in Table 2.1.2. Their fertilizers are also approved as organic fertilizers. To make this possible
the Biokymppi Oy plant has two process lines, one line is for raw materials which are accepted for organic fertilizers such as manure and separately collected biowaste and the other line is for municipal sewage treatment sludge and other materials which are not accepted for organic fertilizers. The Växtkraft biogas plant only use feedstocks accepted for organic fertilizers. The Biokymppi Oy plant can produce fertilizers for 1 000 - 1 500 hectares. (Svensk Växtkraft, 2007; Juvonen, 2010; Juvonen, 2011; Bioenergia, 2011). In a study by Odlare et al. (2010) it is shown that the biogas residue can provide the necessary plant nutrients and has the ability to produce nearly 88 % of the crop yield compared to mineral fertilizer.
The main product from a dry digestion process, apart from biogas, is compost. Especially for sanitation purposes the quality of the compost in terms of heavy metals and pathogens has to be taken into consideration (Köttner 2002). Rösch et al. investigated the use of hay together with corn silage as a substrate for a dry biogas process. As it was assumed that the grassland was not fertilised, the residues from the fermentation process could be used completely as fertilizer for the corn plants. (Rösch et al., 2009)
2.2 Ethanol from waste
Among the circumstances, pointing at that ethanol produced from agricultural waste can become a promising alternative from energy, cost and environmental perspectives are that agricultural crop residues, for example of cereal straw, usually have lower market prices than e.g. cereal grains and do not compete with food production, and the potential to minimize CO2 emissions, as long-distance transport can be avoided (compared with e.g. imported
biofuels). However, the introduction of local, lignocellulose based ethanol production is limited by some factors, such as the higher market price compared with ethanol derived from sugarcane and imported from Brazil. The current cost of ethanol production in Brazil is about 0.2 €/l, while ethanol derived from lignocellulosic feedstock in Europe costs about 0.4-0.5 €/l (SEKAB, 2010b).
Ethanol is considered as one of the important alternatives to fossil fuels. The whole world‘s ethanol production is estimated to pass 91 Gl in 2012 (Market Research Analyst, 2008). In EU, the biofuels directive sets the target of 2 % substitution of conventional transport fuels by biofuels by December of 2005 and a further substitution of 5.75 % by December of 2010 (European Parliament and Council, 2003). The leading country for ethanol production, Brazil, provided almost one third of the global ethanol production, equal to 25 Gl, in 2009 (Renewable Fuels Association, 2011) and has become the only country, which can not only increase significantly the ethanol production to meet the expected domestic demand but also has the excess of capacity to provide ethanol to the world.
2.2.1 Waste feedstock for ethanol production
Ethanol can be produced from the raw materials, which contain sugars or can be converted into sugars. The raw materials can be grouped as directly fermentable sugary materials, starchy materials, lignocellulosic materials/wastes and urban/industrial wastes. For the
21 substrates that are not directly fermentable, substrate pre-treatment for conversion into sugar monomers are necessary.
Biofuels produced with conventional technology from easily convertible raw materials, such as direct fermentable sugary material, are often referred to as first generation biofuels, while biofuels produced in more advanced processes from lignocellulosic material are called second generation biofuels (UN-Energy, 2007). Examples of sugary waste materials that can be used for ethanol production are sugarcane molasses by-product of sugar industry, but also some wastes from food industry such as fruit juice industry.
Sources of lignocellulosic materials suitable for ethanol production are agricultural wastes, for example straws and wood wastes. On the basis of the technology available today, about 409 litres of ethanol can be produced from one ton of lignocellulose. Despite the strong interest also in other feedstock materials to produce ethanol, there are studies pointing out that the long-term sustainability of ethanol production will ultimately depend on the use of lignocellullosic wastes (Flavell, 2007; Farrell et al., 2006; Kszos et al., 2001; Kim and Dale, 2005a; Kim and Dale, 2005b; Adler et al., 2007). Considerable efforts have been made to develop new technical routes for ethanol fuel production from the lignocellulosic wastes. Given the arable lands constrains, there is a policy of diversifying the feedstock used to produce ethanol in China. Some pilot plants are established to use the acid and enzymatic hydrolysis of sawdust, rice straw and stalk of sugar sorghum for ethanol production (Zhenhong, 2006). Recently, some lignocelluloses-based plants started that operate on a commercial scale, though there exit some technical, economical and commercial barriers (Japan for Sustainability, 2007).
Part of the MSW could be used for ethanol production. Also wastewater generated in certain industrial plants like breweries, sugar mills, food-processing industries, tanneries, and paper and pulp industries could also be reused to produce ethanol (Prasad, 2007)
2.2.2 Pre-treatment
Pre-treatment is a very important step of the bioconversion process of celluloses and
hemicelluloses into ethanol. The primary goal of any pre-treatment is to alter or remove the structural and compositional impediments to hydrolysis so as to improve the rate of enzyme hydrolysis and increase the yield of fermentable sugars, mainly in the form of hexose and pentose as well as reduce the size of feedstock (Mosier et al., 2005). A successful
pre-treatment should follow the rules:1, improve and increase the ability of sugars formation; 2, decrease and avoid the degradation or loss of carbohydrate; 3, reduce the formation of by-products inhibitory to the sequent hydrolysis and fermentation process; 4, be cost-effective (Silverstein, 2004). Possible pre-treatment methods for ethanol production are:
Steam explosion pre-treatment
Ammonia fibre/freeze explosion
Acid pre-treatment
Alkaline pre-treatment
Steam explosion is a process where high-temperature and high-pressure steam is used for segregating the individual fibres with minimal loss of materials (Mosier et al., 2005). There is evidence that steam explosion pre-treatment is a cost-effective pre-treatment method for hard wood, while it is less effective for soft wood (Silversterin, 2004).
In ammonia fibre/freeze explosion pre-treatment pre-wetted lignocelluloses are placed into a pressure vessel with a loading of NH3 at 1-5kg/kg dry biomass. Pressure over 12 bar is
needed for the process at ambient temperature (Silversterin, 2004). It is effective for the pre-treatment of corn stover, but less effective for those lignocellulosic wastes, which contain high content of lignin. The ammonia can be recovered by an evaporation operation (McMillan, 1997).
Many types of acids, such as sulfuric acid (McMillan, 1997), hydrochloric acid (Kurakake et al., 2005), peracetic acid (Teixeira et al., 1999), nitric acid (Brink, 1993) and phosphoric acid (Hussein et al., 2001), can be used for acid pre-treatment. In general, acid pre-treatment can utilize dilute or concentrated acids to improve the hydrolysis of lignocellulosic material. However, the former one is the most studied and used (Karimi et al., 2006; Dale and Moelhman, 2000; Tucker, 2003; Chung et al., 2005). There are mainly two types of dilute acids pre-treatment processes: one is a continuous-flow process with low solids loading (5-10 mass-%) and high temperature (higher than 160 °C); the other is a batch process with high solids loading (10-40 mass-%) and low temperature (lower than 160 °C) (Wyman, 1999). In recent years, treatment of lignocellulosic biomass with dilute sulfuric acid is adopted widely for hemicelluloses hydrolysis and pre-treatment before enzymatic hydrolysis of celluloses. Some improvements of the dilute acid method are presented by Knauf and Moniruzzaman (2004), which combines the high-temperature separation and washing treatment of pre-treated solids, preventing the re-precipitation of lignin and xylan. The re-precipitation of lignin will negatively influence the following enzymatic hydrolysis of pre-treated solids. Alkaline pre-treatment can be operated at ambient temperature and lower pressure
compared to other types of pre-treatment, whose reaction time is measured in terms of hours or days rather than minutes and seconds at ambient conditions. Contrary to the enzyme-catalyzed acid pre-treatment, some part of alkali is converted into irrecoverable salts or incorporated as salts into the biomass (Börjesson, 2006) but alkali pre-treatment can more easily remove the lignin content from the lignocelluloses with little effect on other
components (McMillan,1997). Dilute NaOH solution is mostly used, due to its lower price and less impact on the environment than concentrated solution.
Biological pre-treatment can simplify the pre-treatment process, but the reaction time is very long and little experience of this process exists. In addition, the special microorganisms needed are very expensive (Wyman, 1999).
2.2.3 Process design and operation
Currently, there is a large amount of studies regarding the utilization of lignocellulosic
wastes/materials as a feedstock for ethanol production. There are several technical options to design the production process, but regardless of which is chosen, the following features
23 should be considered carefully and comprehensively in comparison with the sugar- or starch-based production (Dong et al., 1997)
Efficient de-polymerization of cellulose and hemicellulose to soluble sugars.
Efficient fermentation of a mixed-sugar hydrolysate containing six-carbon (hexoses) and five-carbon (pentoses) sugars as well as fermentation inhibitory compounds.
Advanced process integration to minimize process energy demand.
Lower lignin content of feedstock decreases the costs.
The ethanol production process from lignocellulosic wastes/materials will contain five steps : 1,feedstock pretreantment; 2,cellulose hydrolysis; 3,fermentation of hexoses; 4,separation and distillation; 5, effluent treatment , seen in Figure 2.2.1 (Carlos et al., 2007).
Hydrolysis and fermentation can be designed according to several approaches: separate hydrolysis and fermentation (SHF), with C5 and C6 fermented in different reactors; simultaneous saccharification and fermentation (SSF), with cellulose hydrolysis and C6 fermentation carried out in the same reactor (Öhgren et al., 2007) or simultaneous
Fig.2.2.1 Generic block diagram of fuel ethanol production from lignocellulosic biomass. Possibilities for reaction integration are shown inside the shaded boxes: CF, co-fermentation; SSF, simultaneous saccharification and fermentation; SSCF, simultaneous saccharification and co-fermentation; CBP, consolidated bioprocessing. Main stream components: C, cellulose; H, hemicellulose; L, lignin; Cel, cellulases; G, glucose(C6); P, pentoses(C5); I, inhibitors; EtOH, bioethanol (Carlos et al., 2007)
Pretreatment Detoxification Cellulose Hydrolysis Hexose Fermentation Pentose Fermentation Production of Cellusases Conventional Distillation Ethanol Dehydration Effluent Treatment CBP SSF CF SSCF (EtOH+L) (EtOH) (G) (P+L) (Cel) (L) Anhydrous Ethanol Biomass(C+H+L)
Solid Fraction (C+L) Liquid Fraction (P+L)
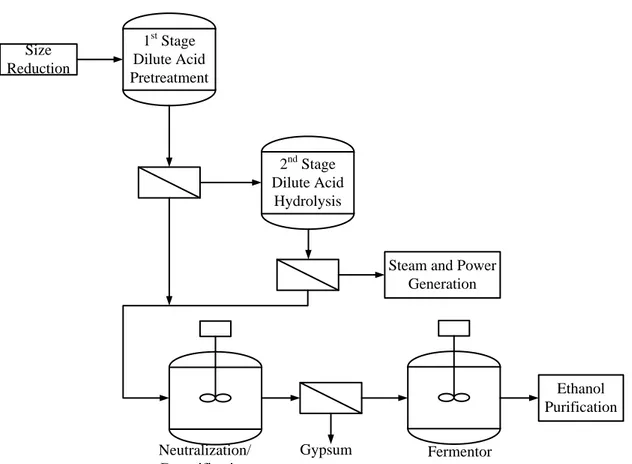
saccharification and co-fermentation (SSCF), with cellulose hydrolysis and fermentation of C5 and C6 simultaneously carried out in one reactor (Hamelinck et al.,2005). However, SSF is shown to be superior to SHF when the whole slurry from the steam pre-treatment of softwood is used (Söderström et al., 2005). Consolidating the two process steps also results in a lower capital cost by eliminating a separate hydrolysis reactor. More importantly, this strategy avoids the problem of product inhibition associated with enzymes; the presence of glucose inhibits hydrolysis (Aly and Megeed, 2008). The fact that the ethanol concentration is higher during SSF than SHF reduces the risk of contamination (Wyman et al., 1992). A two-step acid hydrolysis technology is developed in a pilot plant by SEKAB, see Figure 2.2.2 a, (SEKAB, 2010a) and another similar in Oregon, USA (Aden, 2000), see Figure 2.2.3. In figure 2.2.2 b a SSF process integrated with a combined heat and power (CHP) plant, also used at SEKAB (SEKAB, 2010a) is shown.
In the hydrolysis step, cellulose and hemicellulose is converted to mainly glucose and xylose. High pressure steam is used to get high C6 sugar yields. The process can be catalysed by dilute acid, concentrated acid or enzymes (cellulase) (Wyman, 1999). The latter is preferred due to their mild reaction conditions with temperatures in the range of 45-50°C and pH at 4.8. The maintenance of equipments is also relatively cheap and easy compared to the former two, which have serious corrosion problems (Chandel et al., 2007). Hydrolysis with
proceeding pre-treatment has a yield of more than 90 %, whereas yields are less than 20 % without pre-treatment (Zhang and Lynd, 2004). For a commercial-scale production, the enzymes are too expensive and instead sulphuric acid is widely utilized. A disadvantage of utilizing sulphuric acid in hydrolysis is that glucose readily degrades at high-temperature condition, which is usually needed for cellulose hydrolysis. It is more difficult to perform the hydrolysis of lignocellulosic biomass than of the pure celluloses because of the presence of non-glucan components like lignin and hemicelluloses (Zhang and Lynd, 2004). In the fermentation step C6 sugars are converted to ethanol. Glucose can be fermented with regular baker‘s yeast whereas xylose requires specially selected or genetically modified
microorganisms (Reith et al., 2001). The non-fermentable material, mainly lignin, is separated before or after fermentation depending on the configuration of the process. The feed to the fermentation step has to be cooled to 37 °C. The material from the fermentor is filtered, often in a membrane filtration unit, and the broth from filtration is distilled by super-heated steam and the ethanol product is obtained.
In Table 2.2.1 data for some exiting ethanol plants using waste as feedstock is presented.
2.2.4 The use of residuals
After membrane filtration of the effluent from the fermentation step, mainly solids of lignin can be collected. The moisture content (MC) of this material is 0.5 to 0.6 kg/kg. After drying,
25 Hydrolysis Pre-treatment Fermenta-tion Distillation Hydrolysis Cooling B io et h an o l 99.61℃/1bar L ig n in W at er C o n d en sa te /3 b ar C o n d en sa te /1 b ar Steam
Steam Cooling Water Steam
A ci d A ci d
375℃/30bar 20℃/1bar 207℃/6.2bar 296℃/15 bar (a)
Pre-treatment
Distilla-tion
CHP
Anaerobic
treatment
Lignocellulose
Enzymatic
hydrolysis
Fermenta-tion
SSF
Ethanol
Dissolved
materials
Biogas
Solid materials
Energy
Alt.use eg. biofuel
(b)Fig. 2.2.2 a) A two-step acid hydrolysis process developed in a pilot plant by SEKAB , b) A SSF based ethanol production process integrated with CHP plant(SEKAB, 2010a)
this material can be utilized as raw materials for pellets production or for combustion for heat and/or electricity production. The stillage can be used for biogas production by
anaerobic digestion (Callander et al.,1986). According to Morgen and Henriksen (2006) the use of the stillage to produce animal feed might be more economically rewarding. Börjesson (2006; 2009) points out that it is vital that the by-products are utilized efficiently and that the energy required for drying the by-products for animal feed production is substantial. So instead, the possibility to produce biogas by anaerobic digestion is more energy-efficient.
Size Reduction 1st Stage Dilute Acid Pretreatment 2nd Stage Dilute Acid Hydrolysis Ethanol Purification Steam and Power
Generation
Neutralization/ Detoxification
Gypsum Fermentor
Figure 2.2.3 Bio-ethanol production process in Oregon (Aden, 2000).
Table 2.2.1 Examples of some existing plants producing ethanol from waste feedstock. (Aden, 2002; SEKAB, 2010b; Shi and Chao, 2009), MC=Moisture content
Plant
(year started) Process design Ethanol yield Ethanol production Feedstock Comments
Pilot plant National Renewable Energy Laboratory (NREL), USA (2010) SSF, dilute acid pre-hydrolysis + enzymatic hydrolysis 449.5 l/ton oven dry feedstock 516.9 Ml/year Corn stover 2000 ton/day (15 % MC) Integration with CHP, 1,6 kWh electricity /l ethanol
Ethanol selling price 0.166 €/l
SEKAB, Örnsköldsvik, Sweden
SSF - 300-400
l/day wood chips (sugarecane bagasse, wheat ,corn stover, energy grass, recycled waste planned to be used)
Previously used two-step hydrolysis CHP, calculated total energy efficiency 80 % Tianguan group, China (2006) SHF, Enzymatic hydrolysis - 5000 ton/year (planned to increase to 10000 ton/year) straw CHP
ethanol production cost 0.51-0.55 €/l
CO2, from fermentation used for PPC plastic production
27
2.2.5 Other aspects
The technology for production of bio-ethanol is developing. However, at present, several non-technical factors limit the further development of the bio-ethanol industry. These limiting factors include feedstock prices, bio-ethanol production costs, enzymes prices, oil prices, taxation of energy products and stimulative policies from government. (Enguídanos et al., 2002).
It is hard to estimate the production cost of ethanol from wastes because it is greatly dependent on the specific process designs chosen by the investors (Wyman, 1999).
Furthermore, different studies often show different results, and poor economics are more often the consequence of poor process designs than a measure of the economic viability of the technology. Some process costs and by-product values are given in Table 2.2.3.
One important development area for ethanol production is integration to achieve the economic feasibility; another is how to cut down yeast costs to an acceptable level. Now, the Butalco Technology GmbH (Pressebox, 2010) has announced that genetically-optimized C-5 yeast can increase ethanol production by 30%, which really helps reduce the cellulose-based ethanol production cost to a competitive level, compared to traditional fossil fuel.
2.2.6 Utilization of bio-ethanol
Bio-ethanol is mixed with gasoline or diesel fuel in different proportions to produce fuel blends.
Low bio-ethanol / fossil fuel blends: mixture of 5-22 % bio-ethanol with gasoline (E5-E22G) and up to 15 % bio-ethanol (with special additives) in diesel fuel (so called ―Oxy-diesel‖, e.g. E10D, E15D).
High bio-ethanol / gasoline blends: e.g. 85 % bio-ethanol in gasoline (E85G), requiring engine modifications.
Bio-ETBE is produced by combining bio-ethanol and isobutylene . Bio-ETBT may be used in blends of 10-15 % in unmodified engines.
Utilized for production of hydrogen.
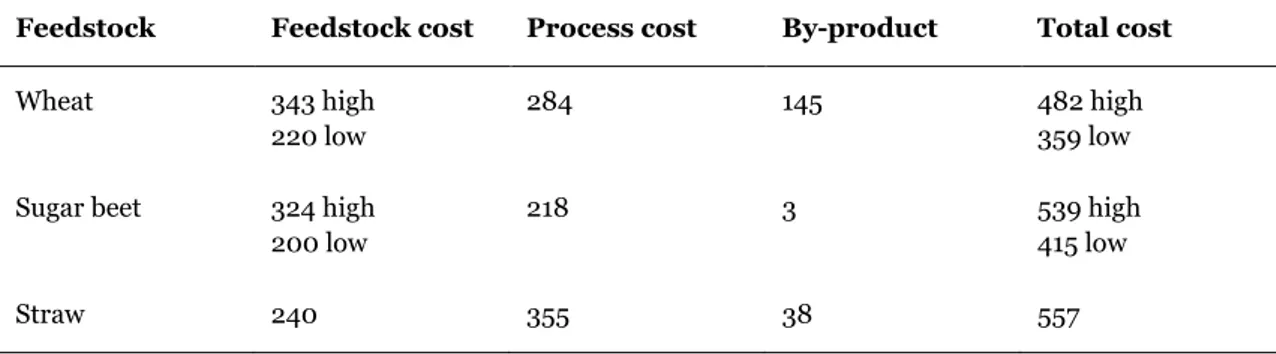
Table 2.2.3: Production costs of ethanol (€/1000 l ethanol) (Sourie and Rozakis , 2001; Teagasc, 2010)
Feedstock Feedstock cost Process cost By-product Total cost
Wheat 343 high 220 low
284 145 482 high
359 low Sugar beet 324 high
200 low
218 3 539 high
415 low
2.3 Butanol from waste
Butanol is a 4-carbon alcohol originally central to a number of industrial chemical processes. In recent years, butanol has gained attention within the scientific and environmental
community as a potential alternative fuel with superior characteristics compared to ethanol and used as a stand-alone transportation fuel or blended with petrol or diesel. The
production of biobutanol is similar to the process for producing ethanol, but using other microorganisms for the fermentation. Butanol can be produced from cereal crops, sugar cane and sugar beet, etc., but can also be produced from lignocellulosic materials and agriculture waste.
The properties of butanol share a closer similarity to gasoline than other biofuels. It has a higher energy density, lower evaporative emissions, is less corrosive and can be shipped through existing petroleum pipelines; and can with that be integrated directly into the existing petroleum infrastructure. (Shapovalov and Ashkinazi, 2008)
Some recent studies investigating the production of butanol from waste are laboratory experiments on production of butanol from agriculture waste in the form of corn stover and switchgrass (Qureshi et al., 2010) and in the form of steam exploded corn stover (Wang and Chen, 2011), experiments on butanol production in a continues packed bed from lactose-rich wastewaster in the form of cheese way (Napoli et al., 2010) and a review on butanol
production including yields for raw materials such as straw, corn stover and whey (Kumar and Gayen, 2011).
There are still questions to be solved to reach high yields of butanol and high production rates. One problem is that some compounds that are formed during the degradation of lignocelluloses inhibit the butanol producing microorganisms. Also the above mentioned studies indicate that the production of butanol from waste has still not been demonstrated in scaled up plants and still do not show economic feasibility.
29
3. Thermal processes
The energy in the waste can be converted to heat, electricity and gas by thermal processes like combustion, pyrolysis and gasification. This chapter begins with a description of possible pre-treatment of waste for thermal processes after which the different thermal processes for waste to energy purposes are described.
3.1 RDF- Refuse Derived Fuel
Solid waste usually has a calorific value of one-quarter to one-half of that of coal and an ash content between 20-40% (McDougall et al., 2008). Municipal solid waste can be pre-treated prior to thermal treatment. The high caloric fraction produced in by pre-treatment is called Refuse Derived Fuel (RDF). RDF is produced from the fraction of the solid waste containing plastics, paper, wood, textiles and rubber. The term RDF is sometimes also used in a wider sense, e.g. also including sorting residues from packaging wastes or processed industrial wastes. Also other terms are in use, such as Recovered Fuel (REF), Packaging Derived Fuel (PDF), Paper and Plastic Fraction (PPF) and Processed Engineered Fuel (PEF) (Gendebien et al., 2003). RDF is similar to Solid Recovered Fuel or Specified Recovered Fuel (SRF). SRF however, is produced according to the requirements of a quality label. Other advantages of using RDF in thermal conversion processes for utilizing the energy in waste, compared to using unsorted waste, besides the higher heating value, are:
RDF is more homogeneous and treatment technologies that have difficulties treating mixed waste directly (e.g. fluidised bed reactors) can be used
RDF is less contaminated than mixed waste, thus its thermal treatment needs less complex flue gas cleaning technologies
regular fuels can be directly substituted
(Cherubini et al., 2009; McDougall et al., 2008; European Commission, 2006).
In Figure 3.1.1 a simplified overview is given of the effects of the production of RDF (e.g. in a mechanical-biological pre-treatment plant. In this exemplary schedule it can be observed, that by splitting the input waste flow a high caloric flow of RDF originates.
3.1.1 Preparation of RDF
In a report from the European Commission (2006) techniques for preparing solid fuels from waste are described. They define two types of fuels- shredded or fluff like material and densified fuels (pellets, cubes and briquettes) but also mention that it is also possible to just separate out the non-combustible fractions and by that double the lower heating value of the material. Further they report on a big variation in the data on lower heating value for the densified fuels recovered from waste ranging from 3 and up to 40 MJ/kg. The different steps of preparing solid waste to fuels are illustrated in Figure 3.1.2. Cranes and wheel loaders are usually used for feeding the process. For some co-combustion applications shredding the fuel product to fluff, crushing it or pulverizing it before use can be necessary. (European
Commission, 2006)
Biological drying is a variation of aerobic decomposition, used to dry and partially stabilise residual municipal waste. Biological drying can produce a high quality RDF, high in biomass content. In the reactors waste is dried by air convection, while heat is provided by exothermic decomposition of the readily decomposable waste fraction. The main difference to biological stabilisation is that here the main goal is to dry and preserve most of the biomass content of the waste matrix, rather than fully stabilise it. Commercial process cycles are completed within 7–15 days, with mostly H2O and organics loses of ca. 25–30 mass-%, leading to
moisture contents of lower than 20 mass- %. The air leaving a drying box is normally close to 100% saturated with air (100% relative humidity). Typical water losses of 25% waste weight were reported by Rada et al. (2009), which constitute the sum of both water and organic matter loss. The ratio of weight losses between organic matter and condensed moisture is approximately 1:7 (Velis et al. 2009). The main goal of biological drying is to minimize the water content of the final product. On the other hand moisture is one of the main parameters of microbial activity. For the composting process water content of 20% was reported to prevent the microbial decomposition (Haug, 1993). In this case the temperature in the reactor will drop to the ambient temperature at which the efficiency of the drying process can be very low. High airflow rate and moisture removal in the re- circulated process air provide
Figure 3.1.2 Preparation steps for production of fuels from solid waste and techniques used for the different steps. (European Commission, 2006)
Separation
handpicking, drum sieve, air classifier, magnet, eddy current separator, dryer, screen, moving grate
Size reduction
mill (hammer, cascade) shredder (shear, single shaft)
rotary cutter
Size increasing
press (flat bed, ring die) disc agglomerator bales briquettes pellets Waste water, metal, stone, glass Fuel
31 for effective drying. Thus, the main objectives considered for the technology design are:
to achieve a good quality RDF, with
- increased energy content through moisture reduction (from above 40% to less than 20%) and separation of non-combustible materials,
- reduced contaminants content through mechanical sorting and removal of metals, fines, PVC etc
to pre-treat waste at the lowest possible residence time (5- 15 days, preferably less than 10 days)
to use heat from the exothermic biological decomposition process to dry the waste, but at a minimum organic matter loss in order to preserve the caloric value,
to deliver stable RDF, suitable for storage and transport
The biological drying reactors design includes a container coupled with an aeration system; containers can be either enclosed, or open tunnel-halls, or rotating drums.
Biological drying requires forced aeration in order to provide necessary air for the
decomposition process, heat transfer involving removal of excessive heat and adjusting the matrix temperature, and to transport out the water vapour. The main process parameters are described below.
Mechanical pre-processing
Mechanical pre-treatment operations include shredding and/or mixing, affecting the physical properties of the matrix, such as the resistance to airflow. Properties such as moisture
content, air-filled porosity, permeability, mechanical strength, and compaction of matrix, have the potential to affect the resistance to flow of air and, in turn, the level of airflow rate necessary for effective biological drying. Currently, the pre- processing strategy in most biological drying plants is limited to coarse shredding, e.g., at 300–150 mm maximum particle size (Velis et al., 2009).
Aeration system type
Air management in biological drying varies according to reactor design and process complexity. In enclosed reactors, the usual configuration is with overpressure, forcing air through the matrix flooring, and collecting off-gasses through openings located at the top. In static biodrying reactors problems with uneven air distribution occur, leading to uneven waste drying efficiency. To overcome this problem the bottom of a commercial biodrying reactor (Herhof Rottebox) is divided into 12 parts enabling airflow to vary in each segment, facilitating control of temperature and moisture in the whole reactor (Nicosia et al., 2007). Moreover, some problems may occur in the lower parts of the reactors due to the downwards leachate flow. Two solutions to mitigate this problem have been proposed: a) static reactors with alternating aeration systems: blowing and pulling air through the matrix: and b) rotating reactors, enabling constant mixing of waste, and even distribution of temperature and moisture (Bartha ,2008). These solutions have been tested in pilot applications and especially the latter one proved to improve the temperature distribution and homogeneity of dried waste (Velis et al., 2009). Air partial recirculation systems are often used in biological drying to reduce the volume of exhaust air requiring treatment. Additionally air recirculation