DiVA – Digitala Vetenskapliga Arkivet http://umu.diva-portal.org
________________________________________________________________________________________
This is an author produced version of a paper presented at 17th International Conference on Science and Technology Indicators, Montréal
This paper has been peer-reviewed but does not include the final publisher proof-corrections or journal pagination.
Citation for the published paper: Ahlgren P, Persson O
Globalization of citations and collaboration: a study of twelve journals
Proceedings of 17th International Conference on Science and Technology Indicators , 2012, pp. 23-32 URL: http://sticonference.org/Proceedings/vol1/Ahlgren_Globalization_23.pdf
Globalization of Citations and Collaboration: A Study of Twelve Journals
Per Ahlgren* and Olle Persson***
per.ahlgren@sub.su.se
Department of e-Resources, University Library, Stockholm University, SE-106 91 Stockholm, Sweden
** olle.persson@soc.umu.se
Department of Sociology, Inforsk, Umeå University, SE 901 87 Umeå, Sweden
Abstract
We treated citations and collaboration from a spatial point of view with respect to twelve journals. Eleven of the journals are from the field of information science, the remaining one from the nanotechnology field. Publication data from Web of Science were used. The twelve journals were compared with respect to mean global impact (in terms of geographical citation distance), citation impact, share of foreign country citation links, degree of concentration of country citation links, and mean geographical collaboration distance. The information science journals oriented towards research evaluation tended to have lower global impact than the more general information science journals, whereas a reversed pattern was observed regarding share of foreign country citation links. For the relation between global impact and citation impact, there was a weak similarity between the global impact ordering and the citation impact ordering of the journals. Regarding the degree of concentration of country citation links, the links were found to be highly concentrated to certain countries, irrespective of if cited or citing countries were considered. For geographical collaboration distance, the nanotechnology journal in the study, Nature Nanotechnology, had the highest indicator value, which is in agreement with the outcome for global impact.
Introduction
The citation impact of journals has since the start of the Journal Citation Reports (JCR), these days supplied by Thomson Reuters, gained a lot of interest, foremost in research evaluation exercises and for publishers who wish their journals to be ranked as high as possible. However, the scholarly journals are not only vertically ordered in terms of citation impact. There is also a horizontal dimension, meaning that journals play an important role in providing a channel for diffusion of research results directed to specific audiences. The communication function of scientific publishing, besides the reward function associated with citation impact, matters when authors select journals. Findings by Gordon (1984) suggest that the former function has more importance than the latter in the selection of journals, while Luukkonen (1992) found the two functions to be of equal importance.
One aspect of the horizontal dimension is geographical reach. If an author considers sending a manuscript to a given journal, what can be expected in terms of global impact? Evidently, some journals are more internationally oriented than others, which might be reflected by the share of international publications, the country of authors (the authors of the journal and/or citing authors), and the composition of editorial board members (Buela-Casal, Perakakis, Taylor & Checa, 2006; Calver, Wardell-Johnson, Bradley & Taplin, 2010). However, it does not follow that a journal that is regarded as international on the basis of one or more of these criteria has a large
geographical reach. One can therefore argue that we should try to get a more objective indicator of geographical reach by measuring the geographical distance between citing and cited papers.
Frenken, Hardeman & Hoekman (2009) proposed a research program to analyze spatial aspects of the science system, and introduced the term spatial scientometrics for research on (a) the globalization of knowledge production, and (b) the location of knowledge production in specific places. The work by Katz (1994), where the effect of geographical distance on intra-national institution-institution collaboration was studied, is an example of an early work on spatial scientometrics. In the recent past, several studies on spatial scientometrics have appeared in the literature. Leydesdorff & Persson (2010) mapped knowledge production of cities and institutions, and collaboration between such entities. Cities and regions of scientific excellence, in terms of citation impact, have been identified and mapped (Bornmann & Leydesdorff, 2011; Bornmann, Leydesdorff, Walch-Solimena & Ettl, 2011; Bornmann & Waltman, 2011), whereas geographical (and cognitive) diffusion of two emerging technologies were analyzed and visualized by Leydesdorff & Rafols (2011). Sin (2011) studied information science (IS) journals and reported that the concentration of the geographical distribution of authors decreased over time and that the variable continent was significantly related to citation impact. Yan & Sugimoto (2011) showed that citations between IS institutions generally decreased when the geographical distance between the institutions increased. Waltman, Tijssen & van Eck (2011) used geographical distance regarding collaboration and reported that the average collaboration distance per publication has increased considerably from 1980 to 2009. However, Hoekman, Frenken & Tijssen (2010) concluded that distance impedes research collaboration, and they did not find evidence that the importance of distance for collaboration is declining over time. Further, the results obtained by Hennemann, Rybski & Liefner (2012) conflict with the notion that science is a borderless human activity: a strongly decreasing relation between geographical distance and the probability of collaboration between organizations was observed.
Citations and geographical distance is to our knowledge a fairly neglected research theme. We know from previous studies that collaboration is dependent on distance, however less so as the globalization trend continues (Waltman & al., 2011). We should expect citations to be less dependent on distance, and increasingly so. Connecting people by readership is surely much easier than making them collaborate. The purpose of this work, which only uses information that can be derived from publication data, is to study citations, as well as collaboration, from a spatial point of view with respect to twelve journals. We explore the following research questions:
1. What is the global impact, in terms of geographical citation distance, for a given journal, and how is global impact related to the well-known journal impact factor (JIF)?
2. To which degree are the publications of a given journal cited by other countries relative to the countries represented in these publications?
3. What is, for a given journal, the degree of concentration of the country citation links to (a) cited countries, and (b) citing countries?
4. What is the average geographical collaboration distance for a given journal?
The remainder of this paper is organized as follows. Data and methods are treated in the next section, while the following section reports the results of the study. The final section contains a discussion, as well as conclusions.
25
Data and methods
In this work, the study objects are journals. We decided to study IS journals, and we selected one of the IS journal sets put forward by Leydesdorff & Persson (2010). The selected set, which contains eleven journals, is such that each journal in the set contributes more than 1% to the citations of the journal Scientometrics (the publication year equal to 2008). One journal—Nature Nanotechnology— not belonging to the field of IS was added to the set. We wanted to compare the IS journals with a journal within a field—materials science—that can be assumed to be more globalized than IS. Some empirical evidence for this assumption, with respect to collaboration, is given in Waltman & al. (2011). The total number of journals in the study is thereby twelve. Let J denote the journal set. The publication data for the study comes from Web of Science (WoS). For each of the twelve journals in J, we retrieved all publications in the journal published during the period 2008-2009. The total number of retrieved publications was 2,511. For the set of retrieved publications, each WoS publication published in 2010 and citing at least one of the publications in the set was retrieved.1 The total number retrieved citing publications was 5,777. Thus, 8,288 publications were retrieved. Since we investigate publications, and relations between publications, partly in terms of geographical distance between cities, each publication in the study should have at least one address.2 8,050 of the 8,288 publications satisfied this condition. Let P be the set of these 8,050 publications. In Table 1, the twelve journals are given, together with, regarding P, corresponding number of publications published 2008-2009.
Table 1. The journal set of the study (J), and, for each journal, the corresponding number
of publications published in 2008-2009.
Journal Short journal name # 2008-2009
publications Annual Review of Information Science and Technology ARIST 23
Information Processing & Management IPM 192
Information Research-An International Electronic Journal IRIEJ 118
Journal of Documentation J.Doc 128
Journal of Information Science J.Inf 99
Journal of Informetrics JOI 69
Journal of the American Society for Information Science and Technology JASIST 450
Nature Nanotechnology Nature.Nano 372
Online Information Review OIR 189
Research Evaluation Res.eval 67
Research Policy Res.policy 287
Scientometrics Sciento 321
∑ 2315
For each publication p in P, we reduced all addresses occurring in the address field (the C1 field) of the WoS record corresponding to p to city+country expressions (like “Leuven, Belgium”). These expressions were then standardized: variant expressions standing for the same city were mapped to a standard expression. For instance, “Amsterdam, Netherlands” and “Wx Amsterdam,
1 However, proceedings papers within WoS but not indexed in any of the databases SCI-Expanded, SSCI and
A&HCI are not included in the analysis, since we did not have access to such source items.
2 We ignored the reprint address of a publication. From the publishing year 1998, the reprint address is normally
included in the ordinary address list of the publication. Moreover, according to Waltman & al. (2011), in most of the cases when this condition is not satisfied, it seems that the corresponding author has moved to a new organization after the research mentioned in the publication was finished.
Netherlands” were mapped to “Amsterdam, Netherlands.” After standardization, duplicate city+country expressions within a publication were deleted. In order to obtain geographical distances between cities, a program was written that collected, for each standard city+country expression, values on latitude and longitude. The program collected the coordinates from two sources, Google Maps API Web Services and Yahoo! PlaceFinder.3 The total number of city+country expressions was 1,520. Yahoo! returned coordinates for all expressions, while Google failed to return coordinates for 14 expressions. For 107 of 1,506 expressions, the distance between the Google and the Yahoo! coordinates was greater than 50 km. We manually controlled the cases with distances greater than 300 km, 39 cases. The outcome was that Google was more accurate in 33 of the cases, Yahoo! in 4, whereas two cases were such that we could not determine the accuracy order of the two tools. Based on these observations, and the observation made by Waltman & al. (2011) that Google seemed to be more accurate that Yahoo! regarding geocoding, we decided to use the coordinates provided by Google in all cases except the 14 + 4 cases mentioned above, where the Yahoo! coordinates were used. With values on latitude and longitude at hand, the geographical distances between cities were calculated with the Haversine formula (Sinnott, 1984), multiplied by 6,371, the mean radius of the earth in km.
Citations
Cited references were extracted from the publications in P in order to generate citation links within P. 12,203 citation links were generated, where each link is from a P publication x to another P publication y such that y is represented in the reference list of x. We define the
geographical citation distance between a citing publication x and a cited publication y, GCitD, as
the maximum geographical distance between γ and δ, where γ is a city+country expression obtained from the record of x, and δ a city+country expression obtained from the record of y. For each of the 12,203 citation links, the GCitD for the link was recorded. Then, for each journal j in
J, the mean GCitD (MGCitD) for j was calculated, across all citation links such that (a) the cited
publication is published 2008-2009, (b) the cited publication belongs to j, and (c) the citing publication is published 2010. Thus, the MGCitD for j is a global impact analogue to JIF. We also calculated, for each j in J, the 2010 JIF for j in order to obtain information on the relation between MGCitD and JIF. Note that the values on JIF are derived from our data and not collected from JCR. In agreement with the calculation of the JCR JIF, only the document types Article and
Review were taken into account regarding the denominator of the indicator. We further calculated
the median GCitD (MdGCitD) for each j in J.
We were interested in the extent to which the publications in a journal in J are cited by other countries relative to the countries mentioned in the address field of the records corresponding to these publications. The city+country expressions already obtained for the publications in P were further reduced to their country part (like “Belgium”), and duplicate country names within a publication were deleted. Consider, for a given journal j in J, all citation links that satisfy the conditions (a), (b) and (c) above. For each such citation link, from a publication x to a j publication y, we generated all (there are at least one) country citation links (δ, γ), where δ is a country name obtained from the record of x and γ a country name obtained from the record of y, and we classified each generated link (δ, γ) as “foreign” if δ ≠ γ, othe rwise as “domestic.” For example, if x is associated with “Belgium” and “USA,” y with “Belgium” and “Japan,” we have 2 x 2 = 4 country citation links, and 3 of these are classified as “foreign,” one as “domestic”
3
http://code.google.com/intl/sv-SE/apis/maps/documentation/geocoding/ and http://developer.yahoo.com/geo/placefinder/, respectively.
27 (“Belgium” → “Belgium”). Now, we define the share of foreign country citation links for j, SFCCitL, as the number of country citation links for j that are classified as “foreign” divided by the total number of country citation links for j. A journal with a large value on the indicator SFCCitL may be associated with, though, a high degree of concentration of the involved country citation links to cited (or citing) countries. For each journal j in J, we used the Gini index (Cowell, 1995) to measure the degree of concentration of the country citation links for j (cf. the preceding paragraph) to cited countries, as well as to citing countries. The Gini index takes values in the interval [0, 1]. 51 cited and 81 citing countries occur in the data.
Collaboration
Regarding collaboration, we define the geographical collaboration distance of a publication x, GCD, as the maximum geographical distance between γ and δ, where both γ and δ are city+country expressions obtained from the record of x. If exactly one city+country expression is obtained from the record of x, we define the GCD of x as 0. For each publication in P, the GCD of the publication was recorded. Then, for each journal j in J, the mean GCD (MGCD) for j was calculated, across the publications of j published 2008-2009.
The definitions of GCitD and GCD
By defining GCitD and GCD in terms of a maximal geographical distance, we follow Waltman et al. (2011). An alternative to the max approach is a mean approach. In the citation case, the mean geographical distance across all pairs of citing and cited city+country expression would be calculated for the publications x and y, whereas, in the collaboration case, the mean geographical distance across all pairs of city+country expressions within a publication x would be calculated. However, the maximum approach, but not the mean one, has the good property of excluding several location links with very short geographical distances, links that presumably concern locations within the same city.
Results
In this section, we put forward the results of the study. We start with citations, and then we treat collaboration. Values on the used indicators are reported in Table 2.
Table 2. Values on the used indicators for the twelve journals in J. Geographical distances in km.
Journal MGCitD MdGCitD SFCCitL Gini index, cited countries
Gini index, citing countries JIF4 MGCD (2010) ARIST 6544 6522 0.814 0.921 0.921 1.59 1439 IPM 6221 6389 0.728 0.814 0.830 1.24 1413 IRIEJ 4692 1656 0.688 0.744 0.906 0.37 511 J.Doc 4999 3301 0.750 0.830 0.819 1.38 631 J.Inf 5348 5446 0.767 0.827 0.819 1.08 680 JOI 5223 3110 0.761 0.847 0.824 2.77 1325 JASIST 5533 5597 0.713 0.818 0.831 1.98 1420 Nature.Nano 7864 8962 0.785 0.836 0.836 27.29 1517 OIR 7445 9781 0.707 0.901 0.861 0.92 522 Res.eval 4493 1836 0.783 0.816 0.866 0.82 1281 Res.policy 5501 5821 0.836 0.781 0.775 1.99 1472 Sciento 5287 5258 0.784 0.701 0.799 1.55 1364 4
Citations
For global impact, measured by MGCitD (the 2nd column in Table 1), the only non-IS journal in
J, Nature.Nano, has the highest indicator value, 7,864 km. Among the IS journals in J, OIR has
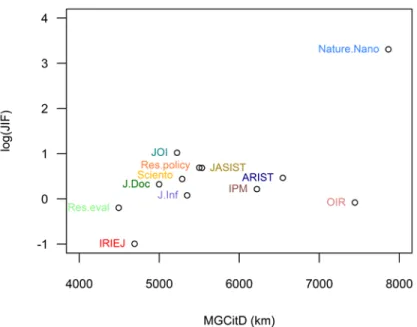
the highest value, 7,445, followed by ARIST (6,544). Res.eval has the lowest indicator value, 4,493. The journals oriented towards research evaluation tend to have lower global impact than the more general IS journals (like OIR, ARIST and IPM), with Res.policy (research evaluation), J.Doc and IRIEJ (both general IS journals) as deviations from the pattern. A similar pattern appears when the MdGCitD is considered (3rd column; the value on Pearson’s r for the two indicators is 0.93). A slightly positive rank correlation between MGCitD and JIF (7th column) exists (Kendall’s tau = 0.27). There is a weak similarity, then, between the global impact ordering and the citation impact ordering of the journals. The scatterplot of Figure 1 displays the values for the indicator MGCitD, and logarithms of the values for JIF (in order to handle the extreme, compared to the IS journals, JIF value for Nature.Nano, 27.29). Note that OIR has the third lowest JIF value (0.92; cf. Table 2, 7th column).
Figure 1. Scatterplot for the indicators MGCitD and JIF (2010). For JIF, logarithms are used.
In Figure 2, the global impact of the journals in J is visualized in terms of cumulative share of citation links. For instance, at the GCitD value 10,000 (km), the cumulative share for Nature.Nano is about 0.65, i.e., about 65% of the GCitD values for Natur.Nano is less than or equal to 10000. The figure illustrate that journals with less global impact cumulate faster. To contrast the journal that cumulate fastest with the journal that cumulates slowest, 50% of the citation links for IRIEJ are cumulated at the GCitD 1650, approximately, whereas 50% of the citation links for OIR are cumulated at the GCitD 9800. These two GCitD values are (approximately) equal to the MdGCitD values for IRIEJ and OIR, respectively (Table 2, 3rd column).
29
Figure 2. Cumulative share of citation links for the twelve journals in J over GCitD in km.
The outcome for the indicator SFCCitL, share of foreign country citation links, is graphically presented in Figure 3, with corresponding values in the 4th column of Table 2. Res.policy, not Nature.Nano, has the highest value, followed by ARIST. A pattern can be observed also here, but a reversed one compared to the MGCitD case: the research evaluation oriented journals tend to be cited by foreign countries, relative to the countries that appear in these journals, to a larger extent than the more general IS journals.
Figure 3. SFCCitL for the twelve journals in J.
From the 5th and 6th columns in Table 2 it is clear that the country citation links are highly concentrated to certain countries, irrespective of if cited or citing countries are considered. For cited countries (5th column), the two journals with the most equally distributed country citations links are Sciento and IRIEJ with 0.701 and 0.744 as values on the Gini index, respectively. ARIST has the highest concentration value, 0.921. For citing countries (6th column), Res.policy and Sciento have the most equally distributed country citations links, but with the order reversed compared to the cited case (Gini index equal to 0.775 and 0.779, respectively), while ARIST
again has the highest value, 0.921. Interestingly, IRIEJ, which has a relatively low level of concentration with regard to cited countries, has the next highest value on the Gini index (0.906) in case of citing countries. Further, for both the cited and the citing case, Nature.Nano has a relatively high value on the index.
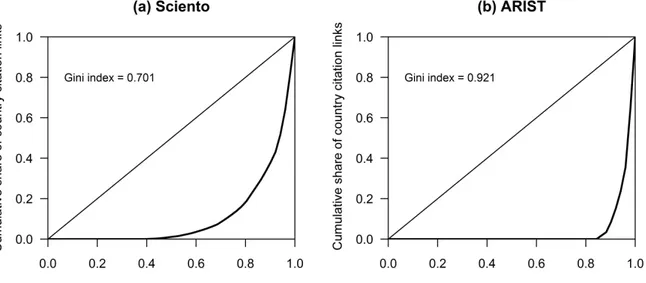
The Gini index is represented graphically by the area between the Lorenz curve and the line of perfect equality. In Figure 4, the Lorentz curves for Sciento (left panel) and ARIST (right panel), with respect to cited countries, are given. The countries are ordered, with regard to the x axis, ascendingly after number of country citation links. As is evident from above, Sciento and ARIST have the lowest and highest values on the Gini index regarding cited countries. For Sciento, when, for instance, 80% of the 51 cited countries have been cumulated, about 19% of the country citation links have been cumulated (Fig. 4a). Thus, 20%, 10 of the 51 countries, account for about 81% of the country citation links.5 For ARIST, when 80% of the cited countries have been cumulated, none of the country citation links have been cumulated (Fig. 4b).
Figure 4. Lorentz curves for the Gini index with respect to cited countries. (a) The curve for Sciento.
(b) The curve for ARIST.
Collaboration
We now draw the attention to mean geographical collaboration distance, MGCD. As for global impact (the indicator MGCitD), the only non-IS journal in J (Nature.Nano) has the highest indicator value, 1517 km (Table 2, 8th column). When the journals are ordered descendingly after MGCD, a block of eight journals (Nature.Nano, Res.policy, ARIST, JASIST, IPM, Sciento, JOI and Res.eval) appears and is such that the difference in MGCD between Nature.Nano and Res.eval (with the lowest value among the eight, 1281) is not more than 236. Next comes a block with the remaining four journals–J.Inf, J.Doc, OIR and IREIJ–all of which are general IS journals. Their indicator values range from 511 (IREIJ) to 680 (J.Inf). Noteworthy is that OIR, which has the second highest MGCitD value, has the next lowest MGCD value.
5
This result for Sciento agrees well with the Pareto principle (the 80-20 rule), which states that 80% of the effects come from 20% of the causes.
31
Discussion and conclusions
In this study, where publication data from WoS were used, we have treated citations and collaboration from a spatial point of view with respect to twelve journals. For global impact, measured by MGCitD, the journals oriented towards research evaluation tend to have lower global impact than the more general IS journals, whereas a reversed pattern was observed regarding share of foreign country citation links (SFCCitL). For the relation between MGCitD and JIF, there is a weak similarity between the global impact ordering and the citation impact ordering of the journals. Regarding the degree of concentration of country citation links, the links are highly concentrated to certain countries, irrespective of if cited or citing countries are considered. With respect to mean geographical collaboration distance, MGCD, the only non-IS journal in the study, Nature.Nano, has the highest indicator value, which is in agreement with the outcome for MGCitD. It was also observed that the general IS journal OIR, which has the second highest MGCitD value, has the next lowest MGCD value.
For a researcher that will select a journal to send a manuscript to, results like ours should be of interest. For instance, to be informed that some of the considered journals have less global impact (cumulate faster; cf. Figure 2 above) than the others would be an advantage for a researcher that lay stress upon geographical reach. The present authors would probably select a journal that has a high citation impact and at least moderately high values on global impact and share of foreign country citation links. One should bear in mind, however, that values on mean geographical citation distance, share of foreign country citation links and the Gini index are somewhat vague, since such values do not say anything about which countries or regions that are potential citers of one’s publication. For example, if one is working in Europe, a mean geographical citation distance of greater than 5,000 km could indicate either Asia, Africa or America. Perhaps a list of most frequently citing and cited countries would be more interesting if one strives to reach target audiences.
We recognize, as do Bornmann & al. (2011), that there are limitations inherent in bibliometric data. For instance, it is not necessarily so that the cities listed in a publication reflect the locations where the research was carried out. One should take this into account when considering the validity of an indicator like MGCitD, even if we have no reason to believe that the indicated problem is extensive. Similar to the 2-year JIF, MGCitD might be sensitive to small numbers and occasional distant locations. Calculations based on at least five years should be tested. In addition, stability analysis could be applied to indicate the sensitivity of the measurements (Colliander & Ahlgren, 2011). We also recognize that the Gini index is an absolute measure. In our case this means that it is absolute frequencies of country citation links across the involved countries (cited or citing) that are at stake, not such frequencies relative to, say, the population size of the countries. Further, in case of a large number of countries on the, for instance, citing side, the number of country citation links to a specific cited country will be inflated. However, when duplicate country citation links, i.e., country citation links within the same pair of a citing and a cited publication such that the cited country is constant across the links, are removed, only minor changes in the Gini values are observed with respect to our data. Moreover, the elimination of duplicate links yields that several citations between countries are ignored, which might be considered as a drawback.
Globalization is a trend. We, like Hennemann & al. (2012), analyzed a state, while, e.g., Waltman & al. (2011) analyzed (collaboration) trends. More extensive scientometric studies, compared to our study, on globalization issues are needed. Such studies might bring in large sets of journals
from different scientific fields. For future research on globalization issues, we would like to focus on geographical citation distances, especially the development of these distances over time.
References
Bornmann, L. & Leydesdorff, L. (2011). Which Cities Produce More Excellent Papers Than Can Be Expected? A New Mapping Approach, Using Google Maps, Based on Statistical Significance Testing. Journal of the American Society for Information Science and Technology, 62 (10), 1954-1962.
Bornmann, L., Leydesdorff, L., Walch-Solimena, C. & Ettl, C. (2011). Mapping Excellence in the Geography of Science: An Approach Based on Scopus Data. Journal of Informetrics, 5 (4), 537-546. Bornmann, L. & Waltman, L. (2011). The Detection of "Hot Regions" in the Geography of
Science-A Visualization Science-Approach by Using Density Maps. Journal of Informetrics, 5 (4), 547-553.
Buela-Casal, G., Perakakis, P., Taylor, M. & Checa, P. (2006). Measuring Internationality: Reflections and Perspectives on Academic Journals. Scientometrics, 67 (1), 45-65.
Calver, M., Wardell-Johnson, G., Bradley, S. & Taplin, R. (2010). What Makes a Journal International? A Case study Using Conservation Biology Journals. Scientometrics, 85 (2), 387-400. Colliander, C. & Ahlgren, P. (2011). The Effects and their Stability of field Normalization
Baseline on Relative Performance with Respect to Citation Impact: A Case Study of 20 Natural Science Departments. Journal of Informetrics, 5 (1), 101-113.
Cowell, F.A. (1995). Measuring Inequality (2nd ed.). Hemel Hempstead: Harvester Wheatsheaf. Frenken, K., Hardeman, S. & Hoekman, J. (2009). Spatial Scientometrics: Towards a Cumulative
Research Program. Journal of Informetrics, 3 (3), 222-232.
Gordon, M.D. (1984). How Authors Select Journals—A Test of the Reward Maximization Model of Submission Behavior. Social Studies of Science, 14 (1), 27-43.
Hennemann, S., Rybski, D. & Liefner, I. (2012). The Myth of Global science Collaboration— Collaboration Patterns in Epistemic Communities. Journal of Informetrics, 6 (2), 217-225. Hoekman, J., Frenken, K. & Tijssen, R.J.W. (2010). Research Collaboration at a Distance: Changing
Spatial Patterns of Scientific Collaboration within Europe. Research Policy, 39 (5), 662-673.
Katz, J. S. (1994). Geographical Proximity and Scientific Collaboration. Scientometrics, 31 (1), 31-43. Leydesdorff, L. & Persson, O. (2010). Mapping the Geography of Science: Distribution Patterns and Networks of Relations Among Cities and Institutes. Journal of the American Society for
Information Science and Technology, 61 (8), 1622-1634.
Leydesdorff, L. & Rafols, I. (2011). Local Emergence and Global Diffusion of Research Technologies: An Exploration of Patterns of Network Formation. Journal of the American
Society for Information Science and Technology, 62 (5), 846-860.
Luukkonen, T. (1992). Is Scientists Publishing Behavior Reward-Seeking? Scientometrics, 24 (2), 297-319.
Sin, S.-C. J. (2011). Longitudinal Trends in Internationalisation, Collaboration Types, and Citation Impact: A Bibliometric Analysis of Seven LIS Journals (1980-2008). Journal of Library and
Information Studies, 9 (1), 27-49.
Sinnott, R.W. (1984). Virtues of the Haversine. Sky and Telescope, 68 (2), 159-159.
Waltman, L., Tijssen, R.J.W. & van Eck, N.J. (2011). Globalisation of Science in Kilometres.
Journal of Informetrics, 5 (4), 574-582.
Yan, E.J. & Sugimoto, C.R. (2011). Institutional Interactions: Exploring Social, Cognitive, and Geographic Relationships Between Institutions as Demonstrated Through Citation Networks.