Evaluation of gene amplification for development of high
producing biopharmaceutical cell lines
Ellen Gustafsson
Master of Science Thesis
Södertälje, Sweden 2010
Supervisor at RecipharmCobra Biologics
PhD. Gittan Gelius
Examiner at Mälardalen University
Prof. Carl Pålsson
Svensk sammanfattning
För att kunna producera rekombinant protein från mammalieceller i stor skala för kliniska studier är det bra att utgå från en högproducerande stabil cellinje. Syftet med detta projekt har varit att med avseende på tid och titer utvärdera steg i en processplatform för utveckling av höguttryckande stabila cellinjer. Genamplifiering genom tillsatts av metotrexat (MTX) till odlingsmedim, utifrån Invitrogens OptiCHO system, har studerats. 17 strategier för MTX amplifiering har utvärderats på tre antikroppsuttryckande chinese hamster ovary (CHO) cellpooler. Proteinproduktionen har bestämts i supernatant från 14-dagars-batch i skakflaska efter odling i respektive MTX koncentration. Denna studie har visat att det är möjligt att genom amplifiering i cellpool öka antikroppsproduktionen från 1 mg/L till 190 mg/L. Den amplifieringsstrategi som efter denna studie kan rekommenderas med avseende på tid och titer har varit att stegvis ökad MTX koncentration från 500 nM till 1.000 nM MTX. Denna amplifieringsprocess har tagit 47 dagar att genomföra och har maximalt gett titrar på 150 mg/L.
För att ge en indikation om de mest lämpade klonerna för storskalig produktion kan väljas i ett tidigare skede har en mindre fed-batch-studie utförts. En initial tillsatts av Invitrogens Efficient Feed B till batch skulle kunna öka chansen att välja de mest lämpade klonerna för produktion till uppskalning. Med stor sannolikhet kan utvecklingsprocessen för högproducerande cellinjer kortas samtidigt som proteinproduktiviteten ökar. Ytterligare studier krävs för att visa detta.
Abstract
It is crucial to have a high producing stable cell line to be able to produce recombinant proteins from mammalian cells in large scale for clinical trials. The aim of this study has been to evaluate steps in a process platform for development of high producing sable cell lines with respect to time and titer. Gene amplification through addition of methotrexate (MTX) based on Invitogen’s OptiCHO system have been studied. In this study 17 strategies of MTX amplification have been evaluated on three antibody expressing Chinese hamster ovary (CHO) cell pools. Protein production has been monitored in supernatants from 14-days-batch in shake flask after each MTX level. This study has shown that it is possible to increase protein production through amplification from 1 mg/L to 190 mg/L. The amplification strategy which can be recommended with respect to time and titer is stepwise increasing MTX concentration from 500 nM to 1.000 nM. This amplification process took 47 days to proceed and gave titers of IgG up to 150 mg/L.
To get an indication if the most preferable clones for large scale production can be selected in an earlier stage a small fed-batch study was preformed. An initial addition of Efficient Feed B to batch could be an option to increase the possibility to select the most productive clone for scale up. The development process for high producing stable cell lines can most likely be shortened while protein production can be increased. Further studies remain to prove this statement.
Table of contents
Introduction ... 5
Background ... 5
Biopharmaceuticals ... 5
RecipharmCobra Biologics ... 5
Cell line development ... 5
The OptiCHO system ... 6
Dihydrofolate reductase ... 6
Gene amplification by Methotrexate addition ... 6
Aim of this study ... 7
Materials and Methods ... 8
Gene amplification ... 8
Cell line ... 8
Cell culture ... 8
Batch evaluation ... 9
Cryo preservation ... 9
Monitoring protein expression ... 9
Evaluation of feed strategies in shake flasks ... 10
Cell culture ... 10
Determination of protein production ... 10
Results/Discussion ... 11
Gene Amplification ... 11
First amplification ... 12
Increasing MTX concentration ... 14
Multiple small steps ... 15
Highest titers ... 17
Rapid process ... 18
Amplification with respect to time and titer ... 19
Fed-batch modification ... 21
Conclusion ... 23
Introduction
Background
Biopharmaceuticals
During the last decade biopharmaceuticals has become more and more common. The far largest categories of biopharmaceuticals are vaccines and monoclonal antibodies1. The most common way to produce recombinant glycoprotein for clinical use is to culture mammalian cells which express the protein of interest. There are high needs involving equipment and expertise to master this process of drug production.2
RecipharmCobra Biologics
RecipharmCobra Biologics, Södertälje, is a newly founded contract service provider, supporting pharmaceutical and biotech companies. They can offer a wide range of services within development and manufacturing of mammalian cell derived products. The needs from the market range from small quantities of proteins for pre-clinical studies to larger amount for clinical trails. In all cases it will be a winning concept to offer cell lines with high titers and rapid delivery.3 Therefore, RecipharmCobra Biologics has a team focused on cell line development.
Cell line development
To be able to produce recombinant proteins in large scale it is crucial to have a high producing stable cell line. There is a need for a robust and efficient protein expression system when developing these cell lines. Today one expression system under evaluation at RecipharmCobra Biologics is the protein expression system OptiCHO from Invitrogen. The system is design for transfection of Chinese hamster ovary (CHO) cells and development of stable cell lines for protein production. To increase the protein expression from the cells in the OptiCHO system the cells can undergo gene amplification.3
To increase throughput and reduce development costs the Cello robotic system for clone screening and handling of static cultures, has been acquired at RecipharmCobra Biologics. By screening and expanding a high number of clones the chance to find the most productive clone increase. The clones in the Cello system are first screened for titer in 24-well plates. The high producing clones are then
evaluated in a 14-days-batch in shake flasks. Then a fed-batch evaluation in shake flasks takes places, before moving on to bioreactor evaluation.4
There are companies that after process optimising can offer cell lines providing titers in the range of 0.8 – 8 g/L in bioreactors, even though most expression processes do not give titers over 4 g/L.3
The OptiCHO system
Dihydrofolate reductase
For production of recombinant proteins one expression system is the OptiCHO system from Invitrogen. It is based on dihydrofolate reductase (dhfr) selection in CHO cells in suspension. CHO cells are commonly used for transfection, expression and large-scale production of recombinant proteins. The CHO-DG44 cell line, used in the OptiCHO system, is a dhfr-deficient cell line derived from suspension CHO cells.5 CHO-DG44 cells are cultured in the chemically defined medium, CD OptiCHO. The medium is developed for production of biopharmaceuticals and does not contain any proteins, hydrolysates, sera or animal-origin components.6
The dhfr gene is coding for the DHFR enzyme that catalyzes the reduction of dihydrofolate to tetrahydrofolete witch is essential for DNA synthesis. Since the CHO-DG44 cells lack DHFR activity they must be successfully transfected with a vector witch expresses DHFR or propagated in medium supplemented with hypoxanthine and thymidine.7 When stable cell lines for protein production are made from CHO-DG44 cells the gene of interest is located on the same vector as a copy of the dhfr gene. The selection for integration into the genome is made in medium lacking hypoxanthine and thymidine.6
Gene amplification by Methotrexate addition
In the OptiCHO protein expression system it is suggested to do an optional step of gene amplification with methotrexate (MTX) to increase protein expression. Gene amplification can be carried out on a cell pool or a selected clone. After amplification a limiting dilution must be executed in order to get a clonal cell line.6 MTX inhibits the DHFR activity. When the folic acid antagonist MTX has been actively transported into the cell it is converted to a polyglutamate metabolite which binds to
DHFR and inhibits the enzyme activity. The cells can counteract the effect of MTX by making more copies of the dhfr gene.8 100 – 3000 kbp, surrounding the dhfr gene, is included in the still rather unknown coping mechanism. Genes located close to the dhfr will therefore also be amplified. Since the gene of interest is located in the same plasmid as the dhfr gene it is co-amplified. The co-amplification gives an increased productivity of the recombinant gene alongside dhfr. In general the degree of gene amplifiacation is proportional to the level of gene expression.7,9 In the OptiCHO system it is recommended to stepwise increase MTX concentration in multiple rounds after clone selection. This procedure may potentially increase the protein production and will take 4 – 6 month.6
Aim of this study
The aim of this project was to optimize parts of one process platform evaluated at RecipharmCobra Biologics to develop high producing stable cell lines for recombinant protein expression. This was done by evaluating strategies of gene amplification on CHO-DG44 cell pools through addition of MTX to cultivation medium. The aim was to develop an amplification method which provides high antibody titers in a rapid period of time but also to improve the knowledge about MTX amplification. Secondary the aim was to evaluate if the clone selection in 14-days-batch in shake flask can be more efficient by mimic the large scale process through fed-batch evaluation in an earlier stage. The project was designed to decrease the process time and increase protein production.
Materials and Methods
Gene amplification
Cell line
In this study two cell pools expressing a model antibody were used. Briefly, in a previous study CHO-DG44 cells were transfected with heavy and light chain constructs using the OptiCHO system. One of the two pools where split into two cultures which overall made three cell pools.
Cell culture
Cells were cultured in suspension in chemically defined CD OptiCHO Medium (Invitrogen), supplemented with 8 mM GlutaMAX (Invitrogen) and 500 µg/mL Geneticin (Invitrogen). When cultures reached viability over 90% gene amplification was carried out by addition of MTX to the medium. Medium containing the different MTX concentrations were prepared weekly. The three cell pools were seeded in 125-mL shake flasks at a density of 300.000 viable cells/125-mL in 30 125-mL medium containing respective MTX concentration. The cells were incubated at 150 rpm, 37 ˚C, 8% CO2. Cell conditions were analysed by Cedex cell counter (Innovatis). The cell-counting with Cedex is based on the traditional Trypan Blue exclusion method. The colour is used to separate dead cells from vital cells by selectively stain dead cells which membrane is not intact.10
Before every passage and medium change the cells were counted by transferring 300 µL cell suspension to a Cedex cup. Before the samples were taken the shake flasks were thoroughly swirled. 20 images were evaluated for each sample. Subcultures were passed twice a week to maintain a density of 300.000 viable cells/mL. The whole medium volume where changed at least once a week by centrifugation of the cells at 200 × g for 5 minutes. After old medium was aspired and the pellet was resuspended in medium containing the respective MTX concentration to a total volume of 30 mL. If the cells grew slowly i.e. the cell density was less then 600.000 viable cells/mL the whole medium volume was changed. When cell viability had reached approximately 90%, or after 14 days in the case of high viability during MTX pressure the next level of MTX was introduced by a total medium change.
Shake flask batches were prepared and cells were cryo preserved. All solutions and equipment that came in contact with the cells were sterile. Proper aseptic technique was used in uni-directional flow benches.
Batch evaluation
Batches were seeded at 300.000 viable cells/mL in medium as above and with the same MTX concentration as during amplification. The cells were pelleted as above and seeded in 250-mL shake flask in a volume of 50 mL. Cells were incubated at 120 rpm, 37 ˚C, 8% CO2.
At day 14 batches were harvested. The shake flasks were thoroughly swirled before 1.2 mL cell suspension was taken to a 2-mL eppendorf centrifuge tube. 100 µL from this volume was diluted (1:3) with 1 × PBS for cell count on Cedex. The eppendorf tubes, containing 1.1 mL cell suspension were centrifuge at 2.000 × g for 5 minutes. The supernatant was transferred to two eppendorf tubes and stored at – 80 ˚C for IgG titer determination.
Cryo preservation
After each MTX amplification the cell pools were cryo preserved. The cells were seeded in 50 mL medium, as above, at a viable cell density of 300.000 cells/mL. When cells were in the exponential phase and had a viable cell density >500.000 cells/mL (approximately 48 hours after passage) the cells were cryo preserved in 90% CD OptiCHO medium (Invitrogen) without additives and 10% DMSO (Sigma). The cells were counted and pelleted by centrifugation at 200 × g for 5 minutes. The pellet was resuspended to 10 miljviable cells/mL in freezing medium and 1 mL of the cell suspension was distributed into each cryovial. The cells were placed in Mr. Frosty buckets containing isopropanol and frozen at – 80 ˚C.
Monitoring protein expression
IgG titer determination by GyroLab Bioaffy
The concentration of secreted antibody in the batch supernatants were measured by using Gyros Bioaffy on CD microlaboratory 20 HC, SIA Application. The Gyrolab is an automated immunological assay performed on a CD laboratory based on the principle as a sandwich enzyme-linked immunosorbent assay (ELISA). Protein levels down to 0.3 mg/L can be detected.11
Fragment Z, anti IgG biotin conjugated was used as capture. AffiniPure F(ab’)2 Fragment Goat Anti-human IgG, were used unlabelled and Alexa labelled as detection. A standard curve was prepared by using serial dilution of standard IgG.
IgG titer determination by affinity chromatography
The concentration of secreted antibody in the batch supernatants were measured with affinity chromatography by using high performance liquid chromatography (HPLC),
Waters 2795 Alliance HPLC. The affinity between the IgG molecule and a Protein A derivate separates the IgG molecules from the rest of the suspension. The detection range of this method starts at 5 mg/L.12
The column: Atoll MediumScout® MiniChrom (MabSelect SuRe). PBS pH 7.3 was used as binding buffer. Phosphate buffer pH 2,5 was used as eluation buffer. A standard curve was prepared by loading different volumes of the IgG standard solution.
Evaluation of feed strategies in shake flasks
Cell culture
Four different stable clones expressing a model antibody were used to evaluate different feed strategies. The clones were previously MTX amplified in two steps and had been selected after limiting dilution using the Cello robotic system. Cells were cultured in CD OptiCHO medium (Invitrogen) supplemented with 8 mM GlutaMAX (Invitrogen). The clones were cultured in 250-mL shake flask and feeded or non feeded with 30 vol% of Efficient Feed A (Invitrogen) or Efficient Feed B (Invitrogen) to an initial volume of 52 mL and a viabel cell density of 300.000 cells/mL. The cultures were harvested from day 4 to 14, as described above.
Determination of protein production
Results/Discussion
Gene Amplification
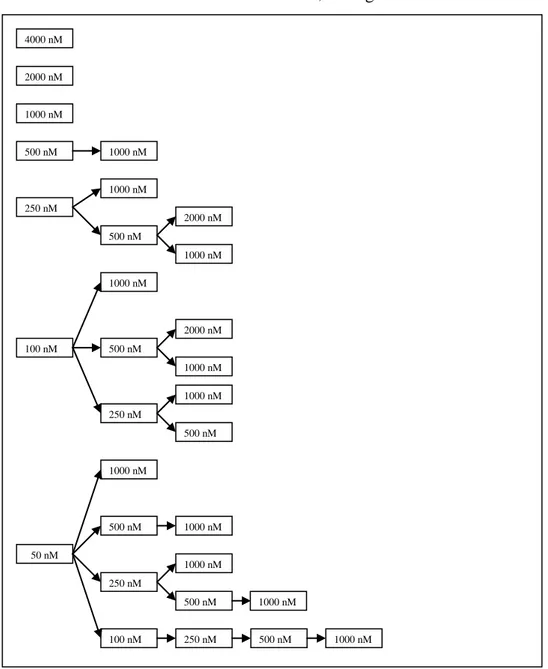
To approach an amplification strategy which provides high antibody titers in a rapid period of time gene amplification with MTX was evaluated. Gene amplification was carried out on three antibody expressing CHO-DG44 cell pools through addition of different concentrations of MTX to medium, see fig. 1.
Figure 1. The different strategies of stepwise increasing, and single levels of MTX concentration to achieve gene amplification. Three different cell pools were parallel exposed to each strategy to approach the optimal amplification method with respect to time and titer.
4000 nM 2000 nM 1000 nM 500 nM 1000 nM 250 nM 1000 nM 500 nM 2000 nM 1000 nM 100 nM 500 nM 1000 nM 250 nM nM 2000 nM 1000 nM 1000 nM 500 nM 100 nM 1000 nM 50 nM 500 nM 250 nM 500 nM 500 nM 1000 nM 1000 nM 250 nM 1000 nM 1000 nM
First amplification
The three cell pools were cultured in shake flasks when first introduced to MTX to achieve gene amplification. During adaptation to new culture condition cell viability was monitored. Each cell pool was analysed on Cedex every 3-4 days to determine cell density for passage and to determine cell viability.
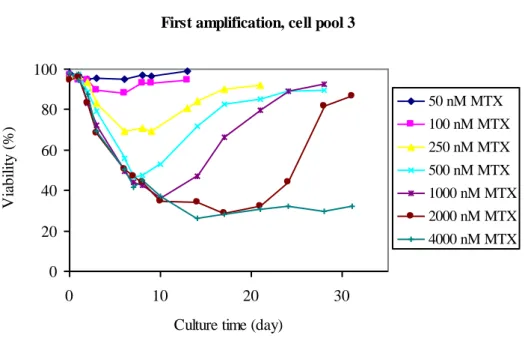
The decrease in cell viability was shown to be related to the amount of MTX cells were exposed to, see fig. 2.
First amplification, cell pool 3
0 20 40 60 80 100 0 10 20 30
Culture time (day)
V ia bi li ty ( % ). 50 nM MTX 100 nM MTX 250 nM MTX 500 nM MTX 1000 nM MTX 2000 nM MTX 4000 nM MTX
Figure 2: Recovery profile of cultures from cell pool 3 from amplification with different amount of MTX. Tracking the percent viability of each culture against days of exposure to various initial concentrations of MTX.
The other two cell pools showed the same pattern in viability recovery profiles as cell pool 3, data not shown. The loss in viability correlates to increased MTX concentration. The time required for the culture to reach viability over 90% was generally proportional to the concentration of MTX in the medium. The higher the MTX level was, the lower the cell viability and the longer it took for the cell pool to recover. This trend was clear during the initial round of amplification, when cells were first introduced to MTX. Amplification with low MTX concentrations did not give the significant drop in viability as shown for higher concentrations. Viabilities for cell pools exposed to low concentrations of MTX did not undergo 90%. This indicates that these cells were not as affected as the cells at a higher MTX pressure.
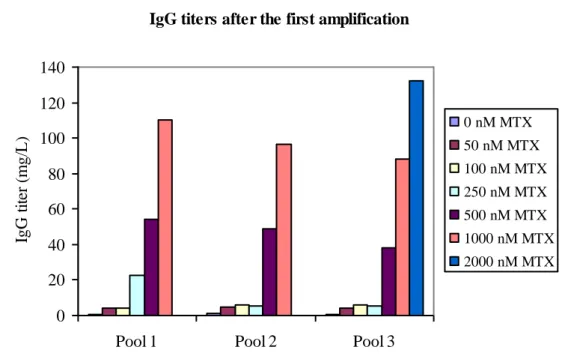
After the first round of MTX amplification a 14-days-batch process was performed. IgG titers in supernatant from the cell cultures subjected to batch process were determined. A clear pattern in protein expression levels was identified. Generally the higher the MTX concentration cells were exposed to, the more IgG the cell pools expressed, see fig. 3.
IgG titers after the first amplification
0 20 40 60 80 100 120 140
Pool 1 Pool 2 Pool 3
IgG t it er ( m g/ L ). 0 nM MTX 50 nM MTX 100 nM MTX 250 nM MTX 500 nM MTX 1000 nM MTX 2000 nM MTX
Figure 3: IgG titers measured in 14-days-batch supernatants from the three cell pools after the first amplification with MTX added to medium of MTX. The columns show the different MTX concentrations, including no addition. Batches with cell pool 1 and cell pool 2 with 2.000 nM MTX was not seeded at correct conditions and are therefore not included in the figure.
Reference cell pools, not exposed to MTX, gave titers of 1 mg/L. MTX concentrations under 500 nM did not give a preferable increase in protein expression. Batch of cell pool 2 at initial MTX concentration of 2.000 nM was seeded at a viable cell density of 40.000 cells/mL with a viability of only 51%. Even with these poor cell conditions cells produced 90 mg/L IgG, data not shown. With only one level of MTX for 30 days (2.000 nM,) titers of 140 mg/L IgG can be reached after amplification on cell pool. The highest initial MTX concentration tested was 4.000 nM. However, after one month of cultivation with medium change twice a week
viabilities were still low, approximately 30%. The batch evaluation of these cells gave very low levels of antibody at day 14, data not shown.
Increasing MTX concentration
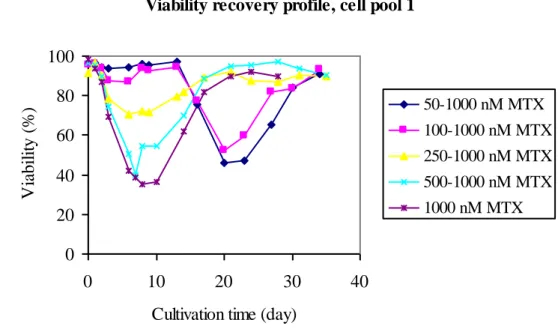
Three cell pools were amplified through stepwise increasing MTX concentrations to increase the expression of the gene of interest, see fig. 1. Cell viabilities were monitored and IgG titers were determined in 14-days-batches supernatants after each MTX concentration. The cell response to a particular MTX concentration seemed to be related to the level of MTX cells had been exposed to earlier, see fig. 4.
Viability recovery profile, cell pool 1
0 20 40 60 80 100 0 10 20 30 40
Cultivation time (day)
V ia bi li ty ( % ). 50-1000 nM MTX 100-1000 nM MTX 250-1000 nM MTX 500-1000 nM MTX 1000 nM MTX
Figure 4: Viabilities during stepwise increase in MTX concentrations in medium during gene amplification of cell pool 1. The lines show the different ways to reach 1.000 nM MTX included 1.000 nM MTX initially. MTX concentrations were increased at day 13 (50 to1.000 nM MTX, 100 to1.000 nM MTX) and at day 21 (250 to 1.000 nM MTX, 500 to 1.000 nM MTX).
Trends regarding the recovery profile of cell pool 1 are the same for the other two cell pools, date not shown. Cells that once survived a high level of MTX were less vulnerable during the next increase in MTX concentration, compare 50 to 1.000 nM MTX to 500 to 1.000 nM MTX.
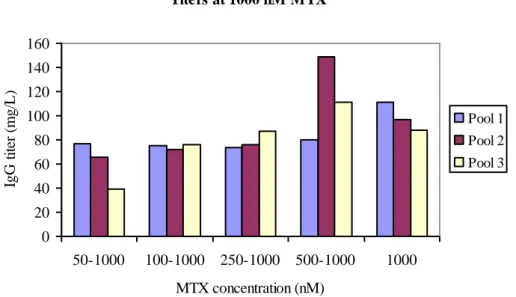
The protein expression results start to get more complex after the second round of amplification. The different strategies to reach 1.000 nM MTX in two steps were compared to each other and to the method of 1.000 nM MTX initially, see fig. 5. The
titer range from these strategies was 39 mg/L (Pool 3, 50 to1.000 nM MTX) to 149 mg/L (Pool 2, 500 to1.000 nM MTX). Cell pool 1 showed the lowest increase in titer during increased initial MTX concentration. The strategy of amplification in two steps with the end concentration of 1.000 nM MTX giving the highest titer was 500 to 1.000 nM MTX. This amplification process took 47 days, excluding batch evaluation. Titers at 1000 nM MTX 0 20 40 60 80 100 120 140 160 50-1000 100-1000 250-1000 500-1000 1000 MTX concentration (nM) IgG t it er ( m g/ L ). Pool 1 Pool 2 Pool 3
Figure 5: IgG titers from three cell pools at 1.000 nM MTX with different initial MTX concentrations, including 1.000 nM MTX as initial concentration. IgG titers were measured in supernatants on day 14 in shake flask batch with 1.000 nM MTX included in medium.
Multiple small steps
To approach the amplification method which gives the highest antibody titers in a rapid period of time several MTX concentration strategies were set up, see fig. 1. Chusainow et al mean that the highest protein expression is reached through stepwise increasing MTX concentrations up to 500 nM MTX, then titers decrease by further increasing MTX addition.13 Others have shown that the highest titers are achieved through multiple small steps up to 4.000 nM MTX.14 That strategy (50, 100, 250, 500, 1.000, 2.000, 4.000 nM MTX) is also recommended by Invitrogen.6 The recommendation by Invitrogen with the OptiCHO system was tested on the three cell pools. Viabilities and IgG titers were monitored.
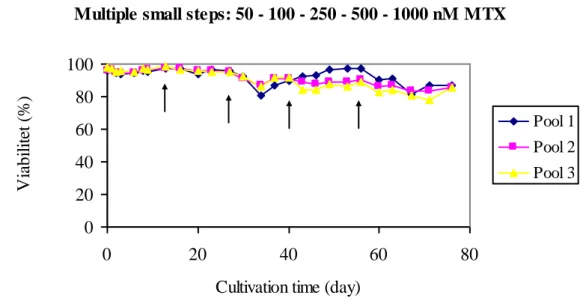
During multiple small steps of increased MTX concentration the viability stayed high throughout the whole amplification process up to 1.000 nM, see fig. 6. The variability between the cell pools regarding viability increase at 500 nM MTX.
Multiple small steps: 50 - 100 - 250 - 500 - 1000 nM MTX
0 20 40 60 80 100 0 20 40 60 80
Cultivation time (day)
V ia bi li te t ( % ). Pool 1 Pool 2 Pool 3
Figure 6: Viability recovery profile from three cell pools from amplification through multiple rounds of stepwise increasing MTX concentrations (50, 100, 250, 500, 1.000 nM MTX). The arrows show when MTX concentrations were increased.
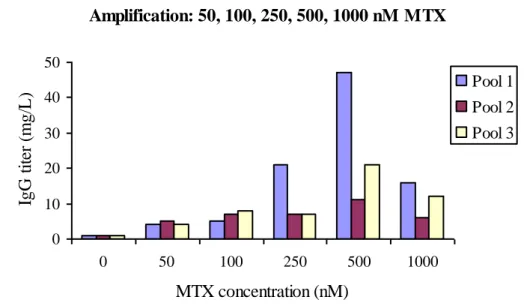
When developing cell lines for production of biopharmaceuticals the time aspect is critical. The amplification process recommended by Invitrogen (50, 100, 250, 500, 1.000, 2.000, 4.000 nM MTX) is said to be time consuming (4-6 month). Due to time and to the results given during the stepwise amplification, see fig. 7, the last levels of 2.000 nM and 4.000 nM MTX were not carried out in this study. The process up to 1.000 nM MTX took 76 days to completing, excluding batch evaluation.
Amplification: 50, 100, 250, 500, 1000 nM MTX 0 10 20 30 40 50 0 50 100 250 500 1000 MTX concentration (nM) IgG t it er ( m g/ L ). Pool 1 Pool 2 Pool 3
Figure 7: IgG titers after each level of MTX concentration during the beginning of the amplification strategy recommended in the OptiCHO system on cell pool 1, 2 and 3.
When applying the stepwise strategy recommended by Invitrogen the highest levels of antibody in the batch supernatant at day 14 was 48 mg/L at 500 nM MTX, cell pool 1. MTX concentrations higher then 500 nM did not give higher titer in any pool, instead the antibody levels decreased at 1.000 nM MTX. This was seen in some cases during increasing MTX concentration in multiple steps, data not shown. To understand why this occur further studies on the molecular level most be executed.13
Highest titers
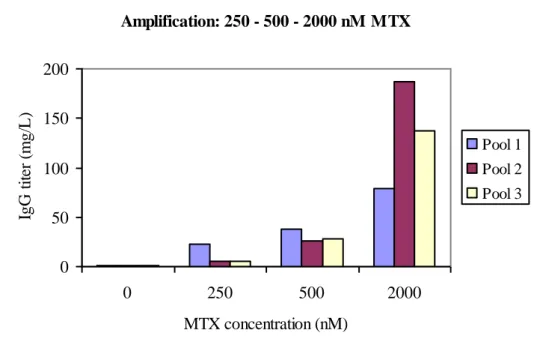
One aim of this project was to evaluate in what extend amplification through MTX addition to cell pool could increase protein expression. The strategy which resulted in the highest IgG titer was stepwise addition of MTX in rounds of 250, 500 and 2.000 nM. Almost 200 mg/L IgG was produced after 14 days of batch from pool 2, see fig. 8. The process took 71 days to complete, excluding batch evaluation. However, this amplification process was not preferable with respect to time.
Amplification: 250 - 500 - 2000 nM MTX 0 50 100 150 200 0 250 500 2000 MTX concentration (nM) IgG t it er ( m g/ L ). Pool 1 Pool 2 Pool 3
Figure 8: IgG titers after each MTX level measured in supernatants from 14-days-batches from the three cell pools, including titers before amplification. This
method of stepwise increasing MTX concentrations gave the highest titer over all.
Depending on the heterogeneity of the pool this method can be more or less efficient. It is important to have in mind that these antibody levels are produced by cell pools. No clone selection has occurred either before or after gene amplification. In previous non published studies, it was shown that titers can increase with 100% by the clone selection that follows after amplification.
There is a large variability between the cell pools regarding protein expression after 2.000 nM MTX, see fig. 8. However, all pools responded with increased IgG expression with increasing MTX concentration which was not seen when increasing in small steps upto 1.000 nM MTX, see fig. 7.
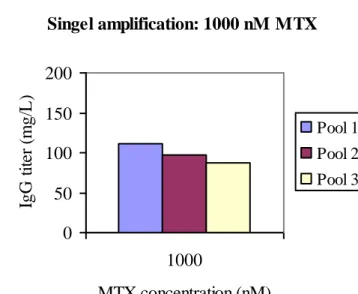
Rapid process
The process of developing high producing stable cell lines is time consuming. One aim of this project was to evaluate if the time for amplification when producing cell lines could be shorted. With respect to primarily time and secondary titer the most recommended amplification strategy would be a single round of MTX concentration of 1.000 nM. This strategy gave after 28 days of amplification, excluding batch evaluation, titers around 100 mg/L from cell pool, see fig. 9.
Singel amplification: 1000 nM MTX 0 50 100 150 200 1000 MTX concentration (nM) IgG t it er ( m g/ L ). Pool 1 Pool 2 Pool 3
Figure 9: IgG titers from amplification with only initial MTX concentration of 1.000 nM MTX for the three cell pools. IgG titers were measured in supernatants from 14-days-batches.
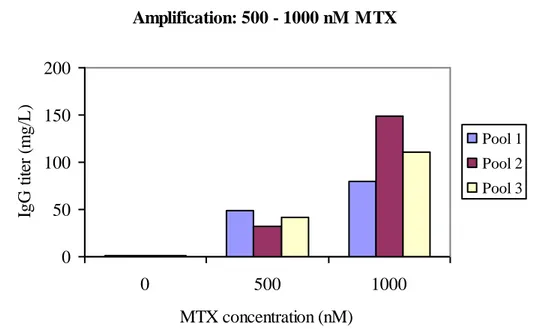
Amplification with respect to time and titer
One of the negative effects from increasing the protein expression by MTX amplification is the loss in productivity during long time cultivation without MTX, which is not evaluated in the study due to time. Scientists around the world have been trying to answer the question why this occurs. The answers are controversial. It is reported that the unstable protein expression is caused by loss of amplified gene copy number.15 Others show that the decrease in volumetric productivity is primary caused by a significant decrease in mRNA levels with little change in the transgene copy number.13It is also reported that the stability of the cell line is depending on the degree of stepwise increasing MTX to achieve gene amplification. Yoshikawa et al have shown that the chromosome locus in which the gene is inserted is important for stability of expression in the absence of MTX in the culture medium. The most stable cell lines have the highest rates of genes integrated into the telomeric regions of the chromosomes, due to gradually increasing MTX levels.16
With this in mind it might be preferable to introduce the cells to 500 nM MTX before increasing the concentration to 1.000 nM. This will take approximately two extra weeks but will lead to a higher protein expression level, see fig.10. The highest IgG titer was 150 mg/L after 47 days, excluding batch evaluation.
Amplification: 500 - 1000 nM MTX 0 50 100 150 200 0 500 1000 MTX concentration (nM) IgG t it er ( m g/ L ). Pool 1 Pool 2 Pool 3
Figure 10: IgG titers after each MTX level (0, 500, 1.000 nM MTX) measured in supernatants from 14-days-batches from three cell pools, including titers before amplification.
Fed-batch modification
The clones that are ranked as the most productive in small scale process, with no feed added, may not be the most productive clones in large-scale since they are not cultured under the same conditions. Due to this issue it is important to have a batch evaluation which does not differ too much from the large scale process. It has previously been shown that there is a correlation between titer in 24 well over grown batch cultures and overgrown batch cultures in shake flasks. However, the correlation is poor. (A. Salmen et al, unpublished data).
The aim of this study was to evaluate if a single addition of feed to cultures set for 14-days-batch would effect protein production. To evaluate if the large scale process could be better mimicked through feed addition to small scale batches the change in protein production was studied. In this experiment two feeds from Invitrogen was tested by addition at one occasion. This was done by cultivation of four different stable high producing clones in suspension in shake flasks, see Table 1.
Table 1: Feed addition to shake flasks with two different feeds at day 0 and day 7. All cultures had the same volume and cell density at day 0, after the 30 % feed addition.
Shaker ID Feed
Culture volume (mL)
Feed Day
Control --- 52 ---
Ad0 Efficient Feed A 52 0
Bd0 Efficient Feed B 52 0
Bd7 Efficient Feed B 52+12* 7
*12 mL Feed B was added to Bd7 at day 7. Results were corrected with respect to this dilution effect.
In this study it was show that one initial feed with 30% Efficient Feed A gave the highest overall increase in titer. Protein production increased at all four clones with 67-98%, at day 14, as compared to batch without feed, see fig. 11. One feed occasion with Efficient Feed B did not give an increase in protein production except clone Sh4 which increased the production with 77%. Further studies remain to evaluate the feeding strategy in 14 day batch culture can be used to select the highest producing clone.
Control: No Feed 0 50 100 150 200 250 300 4 7 8 9 10 11 14
Cultivation time (day)
T it er ( m g /L ) Sh4 Sh18 Sh38 Sh822
Ad0: Initial Feed A
0 50 100 150 200 250 300 4 7 8 9 10 11 14
Cultivation time (day)
T it er ( m g /L ) Sh4 Sh18 Sh38 Sh822 Bd0: Initial Feed B 0 50 100 150 200 250 300 4 7 8 9 10 11 14
Cultivation time (day)
T it er ( m g /L ) Sh4 Sh18 Sh38 Sh822 Bd7: Feed B, day 7 0 50 100 150 200 250 300 4 7 8 9 10 11 14
Cultivation time (day)
T it er ( m g /L ) Sh4 Sh18 Sh38 Sh822
Figure 11: IgG titers from four different clones cultured in shake flasks with different feed techniques. Titers from IgG analyses from Bd7 were corrected with factor 1.3 due to the dilution effect during feeding.
Conclusion
The aim of this study was to evaluate amplification and feeding strategies for the development of high producing stable cell lines for recombinant protein production with respect to time and titer.
By setting up 17 different MTX amplification strategies, on three cell pools, a suggestion of an amplification method could be generated. The results from this project show that protein expression increases by MTX addition to the cell pool. The decrease in cell viability during amplification is correlated to the level of MTX cells are exposed to. Furthermore, the decrease in cell viability is correlated to protein expression. This study shows that it is possible to increase protein production from 1 mg/L to 190 mg/L in cell pool by amplification through MTX addition to stable transfected CHO-DG44 cells. One rapid strategy to reach titers around 100 mg/L is shown to be addition of a single MTX concentration of 1-2 µM MTX. The most preferable MTX amplification strategy with respect to both time and titer would be to increase the MTX concentration in two steps, 500 and 1.000 nM MTX. Due to the variations seen between the cell pools I suggest to do the MTX gene amplification in more then one transfected and selected CHO-DG44 cell pool. A gene amplification strategy recommended for the CHO-DG44 cells, with multiple rounds, was shown not to be efficient regarding time and titer. Further studies addressing expression stability and cell pool heterogeneity is crucial to determine which amplification strategy is the most suitable for protein production.
I also did an initial experiment to evaluate if a single addition of feed to 14-days-batches could be used to improve the correlation between small scale and large scale batch evaluation. Further studies with a larger, more heterogenic clone panel included is needed to draw any conclusions based on feed and clone ranking. However, this study indicates that addition of Efficient Feed B to shake flask batch could be an option to increase the possibility to select the most productive clone for scale up.
The development process of high producing cell lines can be shortened and titers can most likely be increased. Further studies remain to prove this statement.
Acknowledgements
I would like to express my deepest gratitude to my supervisor Gittan Gelius at RecipharmCobra Biologics for all her appreciated support and help. I also want to thank her for putting her trust in me and giving me the confidence and the opportunity to work independently. I would like to thank Sephide Lalehzari, Andrea Salmén and Ulrica Skoging-Nyberg for always taking the time to support me in the lab. I would like to show my appreciations to Lovisa Bylund, Sephide Lalehzari and Anna Lönnerbro for letting me assist during antibody analyses and for taking the time to teach me.
References
1. Coco-Martin M José, 2004. Mammalian expression of therapeutic Proteins. BioProcess International, 32-35.
2. Wurm M Florian, 2004. Production of recombinant protein therapeutics in cultivated mammalian cells. Nat Biotechnol 22(11), 1393-1398.
3. Howard RG Clarke, Bruce J Comptom. 2008. Comparing mammalian expression systems. BioProcess International, 24-28.
4. Lindgren K, Salmén A, Lundgren M, Bylund L, Ebler Å, Fäldt E, Sörvik L, Fenge C, Skoging-Nyberg U. 2009. Automation of cell line development. Cytotechnoloyg 59, 1-10.
5. Urlaub G, Kas E, Carothers A, Chansin L. 1983. Deletion of the Diploid Dihydrofolate reductase Locus from Cultured mammalian cells. Cell 33, 405-412.
6. Invitrogen: User Manual - OptiCHO Protein Expression Kit. 2009. Catalog no. A10999-01, Version A.
7. Kaufman RJ, Wasley LC, Spiliotes AJ, Gossels SD, Latt SA, Larsen GR, Kay RM. 1985. Coamplification och coexpression if human tissue-type plasminogen activator and murine dihydrofolate reductase in Chinese hamster ovary cells. Mol Cell Biol 5, 295-298
8. Tanaka H, Tapscott S, Trask B, Yao M-C. 2002. Short inverted repeats initiate gene
amplification through the formation of large DNA palindrome in mammalian cells. PNAS 99, 8772-8777
9. Kaufman RJ. 1990. Selection and coamplification of heterologous genes in mammalian cells. Methods enzymol 185, 537-566.
10. http://www.innovatis.com/products_cedex, Innovatis, 2010-01-07
11. http://www.gyros.com/en/technology/principles/index.html, Gyros, 2009-12-27
12. http://www.waters.com/waters/nav.htm?cid=10048919&locale=en_US, Waters, 2010-01-07
13. Chusainow J, Yang YS, Yeo J, Toh PC, Asvadi P, Wong N, Yap M. 2009. A study of monoclonal antibody-production CHO cell lines: What makes a stable high producer. Biotech and Bioeng 102(4), 1182-1196.
14. Kim SJ, Kim NS, Ryu CJ, Hong HJ, Lee GM. 1998. Caracterization chimeric antibody producing CHO cells in the course of dihydrofolate reductase-mediated gene amplification and their stability in the absence of selective pressure. Biotechnol Bioeng 58(1), 73-84.
15. Kim NS, Kim SJ, Lee GM. 1998. Clonal variability within dihydrofolate reductase-mediated gene amplified Chinese hamster ovary cells: Stability in the absence of selective pressure. Biotechnol Bioeng 60(6), 679-688.
16. Yoshikawa T, Nakanishi F, Ogura Y, O1 D, Omasa T, Katakura Y, Kishimoto M, Suga K. 2.000. Amplified gene location in chromosomal DNA affected recombinant protein production an d stability of amplified genes. Biotechnol Prog 16(5), 710-715.