Does audit independence
have an impact on issued
sanctions?
MASTER THESIS WITHIN Business Administration
THESIS WITHIN: Accounting NUMBER OF CREDITS: 30 hp
PROGRAMME OF STUDY: Civilekonom AUTHOR: Simon Ekström & Tim Ainemo JÖNKÖPING May 2019
- A quantitative study of listed companies in the
Swedish setting
i
Master Thesis in Business Administration
Title: Does audit independence have an impact on issued sanctions?
Authors: Simon Ekström & Tim Ainemo
Tutor: Argyris Argyrou Date: 2019-05-20
Key terms: Audit Independence, audit quality, Audit tenure, Client Importance, Non-Audit Service, Sanction, Sweden, Nasdaq Stockholm,
Abstract
This study investigated the relationship between audit independence and audit quality, which is measured by sanctions issued by Nasdaq Stockholm Exchange. Sanctions as a tool to measure audit quality is uncommon, this study is one of the first studies using this approach in Europe. The investigation was based on a sample size of 49 company-years, and a total of 16 unique companies that are or were listed on either Nasdaq Stockholm or Nasdaq First North between the years of 2008-2018. The study used a logistic regression model to investigate the relationship between the dependent and independent variables since the dependent variable was classified as a binary variable. Three different proxy variables were used to measure audit independence, Audit Tenure, Client Importance and Non-Audit Services. The study found indications about a negative relationship with each proxy variable, however the findings were not strong enough to be statistically significant, which led to the conclusion that this study did not find any association between sanctions and the chosen variables.
ii
Table of Contents
1
Table of Contents
1 Introduction ... 1 1.1 Background ... 1 1.2 Problem ... 2 1.3 Purpose ... 31.4 Structure of the thesis ... 4
2 Literature Review ... 4 2.1 Audit independence ... 4 2.1.1 Audit Tenure ... 5 2.1.2 Client importance ... 7 2.1.3 Non-audit services ... 8 2.2 Sanctions ... 10 2.3 Regulation... 12 2.5 Agency Theory ... 13
3 Methodology and hypothesis. ... 14
3.1 Methodology ... 14
3.2 Sample selection ... 14
3.3 Data collection ... 19
3.4 Measure for Audit independence ... 20
3.4.1 Audit Tenure ... 20 3.4.2 Client Importance ... 21 3.4.3 Non-Audit services ... 21 3.5 Control variables ... 21 3.6 Sanctions ... 22 3.7 Hypotheses development... 22
3.8 Logistic regression model ... 24
4 Empirical Findings ... 25
4.1 Descriptive statistics for variables used in logistic regression ... 25
5 Conclusion ... 31
5.1 Suggestions for Future Research ... 32
iii
Table 1: Distribution of decisions made by Nasdaq Stockholm ... 15
Table 2: Company distribution regarding industries ... 16
Table 3: Company distribution of stock market ... 16
Table 4: Company-year distribution of for Sample A ... 17
Table 5: Company-year distribution for sample B ... 18
Table 6: Sample distribution ... 19
Table 7: Descriptive statistics for variables used in logistic regression ... 28
Table 8: Omnibus Tests of Model Coefficients ... 28
Table 9: Variables in the Equation ... 31
Equation 1: Client importance ... 21
Equation 2: Non − audit services ... 21
Equation 3: Return on assets ... 22
Equation 4: Debt − ratio ... 22
Appendix 1: Sample A ... 38
Appendix 2: Sample B (Post breach) ... 39
1
1
Introduction
______________________________________________________________________
This chapter presents a background of the topics, audit independence and audit quality. It is followed by a problem discussion, that lastly leads to the purpose of the study.
______________________________________________________________________
1.1 Background
After the Enron scandal in 2001 and the collapse of Arthur Andersen in 2002, legislators needed to restructure and improve the regulations, therefore, the Sarbanes-Oxley Act of 2002 was enacted (U.S. Congress, 2002). The act included regulation changes regarding the audit profession and disclosure of audit related information. After the act, companies were forced to disclose the structure of the audit fees, the amount of non-audit services and amount of audit related services. This led to new possibilities and gave researchers incentive to investigate audit independence, since such data were not public information prior to the act. As a result of the Sarbanes-Oxley Act, audit independence eventually became a more common area of focus for researchers. (Brandon & Mueller, 2009; Chen et al., 2010; Zhang et al., 2016).
Increased attention regarding audit independence came to occur after the financial crisis of 2008, which had a worldwide impact and led to further changes on regulations regarding the audit profession. The financial crisis made the European Commission act towards stricter laws in the audit profession. In 2010 the European Commission published a green paper regarding improvements of the rules (European Commission, 2010), each member country could provide their thoughts and ideas which later in 2014 resulted in a new directive (Regulation (EU) No 537/2014). The directive included, for instance mandatory key auditor rotation and restrictions on the amount of non-audit services that the audit firm can provide to their client. The European Commission introduced a sub-group to the Committee of European Auditing Oversight Bodies (CEAOB), European Markets and Securities Authority (ESMA) which had the goal to provide stricter supervision on the audit sector.
2
Prior literature mainly investigated audit independence and audit quality, the largest difference between studies is the way to measure audit quality. Studies often use earnings management as a proxy for audit quality or material misstatements. Accounting restatements is another way used to measure material misstatements, Accounting auditing enforcement releases (AAER) is another (Dechow et al., 2011). Most of the existing literature is focused on U.S. companies since the sample size and data available are to a vast amount superior compared to European countries (Velte and Loy, 2018).
AAERs is enforcement actions by the United States Securities and Exchange (SEC) and a substitute to that tool is sanctions that are issued by the national stock exchange. The national stock exchange in Sweden is called, Nasdaq Stockholm and it do not have a specific action to accounting error like the AAER. This limits the amount of research in the subject because it requires the researchers to gather the sanctions that are in regard to accounting errors themselves.
1.2 Problem
The European Commission stated that the audit profession is a key aspect to create and maintain trust between a company and its stakeholders. Stakeholders representing the society relies on the auditors unbiased judgement when dealing with client’s financial statements. Correct financial information is an important part of the company’s information to the society, where both individuals, and other organizations have an interest in the health of the companies (Reynolds et al., 2004). As Velte & Loy (2018) claimed that to ensure adequate quality of the financial reports, the auditors independence must remain intact.
There are many reasons to why the auditor’s independence can be compromised. For example, some studies have found that long tenure has a positive association with higher audit quality. Also, that long tenure often results in lesser accounting auditing enforcement releases (AAER) (Defond & Zhang, 2014). However, the European Union consider that long audit tenure could result in lower audit quality, which can be interpreted by the auditor rotation rule that was implemented as a directive in the European Union (Regulation (EU) No 537/2014). There is a viewpoint that the relationship between the
3
auditor and the client can grow strong enough for the auditor that the auditor’s objective view gets clouded by the relationship.
The client’s value for the auditor and audit firm is another reason that audit independence might get compromised, since it exists an incentive to keep big and profitable clients, which also can be connected to the non-audit service fees (Tepalagul & Lin, 2015). Defond & Zhang (2014) states that studies with a focus on threats against audit quality have found limited or sometime contradictory evidence.
Velte & Loy (2018) called for more research in the European setting regarding audit independence, due to the fact that the majority of studies focus on U.S. companies. Although, research in Europe has become more frequent these last years, but most studies measures audit quality by using abnormal accruals.
Instead of using abnormal accruals, this study contributes to the growing body of literature regarding audit independence by using sanctions issued by Nasdaq Stockholm Exchange to measure audit quality. To investigate whether audit independence has an impact of sanctions issued, information regarding these could help both regulators, shareholders and auditor oversight boards. A relation between audit independence and sanctions could give indication to the shareholders if the auditor’s independence is compromised or not, by this vote for a rotation of audit firm to ensure safety in the audit. Such information could also give oversight boards indications to investigate an auditor’s independence.
1.3 Purpose
The purpose of this study is to investigate whether a relationship between sanctions issued by Nasdaq Stockholm Exchange and audit independence exists. By conducting this investigation, the results could provide legislators, shareholders and monitoring authorities valuable information regarding if sanctions can be an indicator of impaired audit independence. This leads to the research question: Does audit independence have an impact on sanctions issued by Nasdaq Stockholm Exchange, in the Swedish setting?
4
1.4 Structure of the thesis
The second chapter in this thesis presents a literature review of findings from prior studies regarding audit independence and audit quality. The third chapter explains the research methodology. The fourth chapter introduces the empirical results and analysis of the results. Chapter five presents the conclusion, limitation and future research.
2 Literature Review
______________________________________________________________________
This chapter provides information on relevant studies previously performed about audit independence and the selected proxy variables, as well as prior studies regarding audit quality. Relevant regulation and agency theory are also included.
______________________________________________________________________
2.1 Audit independence
The paper by Brandon & Mueller (2009) states that it was after 2001 when the SOX act was enacted which required companies to disclose both audit fees and non-audit fees that the subject of audit independence started to gain interest from the researchers. According to the literature review by Tepalagul & Lin (2015), the paper by DeAngelo (1981) was one of the first papers to touch the subject.
DeAngelo (1981) investigated the association between the size of audit firm and audit quality. The paper defines audit independence as the likelihood that the auditor discovers a breach and reports it. If an auditor's independence is compromised, then it becomes more unlikely that the discovered breach will be reported. DeAngelo (1981) stated that auditors independence could be compromised in order for them not to lose the client. Retaining the client for either reputational or financial reasons could get the audit firm to overlook their responsibility of being independent as auditors, which would lead to lower audit quality (DeAngelo, 1981). This has been supported by several papers (DeFond et al., 2002; Chung & Kallapur, 2003; Ratzinger-Sakel, 2013; Svanström, 2013; Zhang et al., 2016).
5
Tepalagul & Lin (2015) performed a literature review based on published manuscript regarding audit quality and audit independence from the nine leading auditing journals, between the years 1976 to 2013. In their research they found four main threats towards audit independence. “Auditor Tenure”, “Client Affiliation”, “Client Importance” and “Non-audit Services”.
Client affiliation occurs when the auditor values the relationship with the client higher than the responsibility towards society and performing an objective audit. Reasons could be that the auditor identify the client as a potential future employer, or it is a former employer and still has very strong personal relation towards that client. To have association to someone in management, like family member or spouse is also considered to be client affiliation. Overall, research indicate that client affiliation is a rare event, and when it occurs there are limited evidence that it has any impact on the audit quality and audit independence (Tepalagul & Lin, 2015).
According to Swedish audit regulation, the auditor is not allowed to have any strong relation to the company that is getting audited. Revisionslagen 17§ states that it is prohibited by law for the auditor to own shares in the company group, be active in a close competitor, have a close family relation to a person who is active in the management or being in debt to the company (Revisionslagen, w.y.). Therefore, client affiliation is an aspect that is not relevant for this study and will be excluded.
2.1.1 Audit Tenure
Researchers are divided on whether long audit tenure has a positive or negative impact on audit quality. Some argue that positive aspects of long audit tenure improve the auditor’s expertise about both the client and the industry which the client operates in. Others argue that the negative aspects of long audit tenure are the risk of forming a strong relationship between the client and auditor which can influence the independence of the auditor when conducting the audit (Bedard & Johnstone, 2010; Tepalagul & Lin, 2015; Garcia-Blandon et al., 2017).
6
Carey & Simnett conducted a research about the association between audit tenure and audit quality in 2006. They used 1 021 Australian companies which were listed on the Australian stock exchange in the year of 1995 for their study. Their study provided evidence that mandatory audit rotation is good in the aspect of audit quality. There exist an association between decreased audit quality and increased audit tenure, which confirms their hypothesis, mostly because longer tenure creates stronger bond which reduce the auditor’s ability to perform critical appraisals. Carey & Simnett (2006) research gave indications of that there is a connection between audit tenure and the likelihood of that the auditor issue a going-concern opinion, which is one of their measurements for audit quality.
A negative association between the likelihood of issuing going-concern opinion and audit tenure got further supported by the paper by Knechel & Vanstraelen (2007). They used Belgian private companies during the time frame from 1992 to 1996 as their setting and investigated in total 618 audit reports, while examining the association between audit tenure and audit quality. However, they found no indications about any connection between loss of audit independence and audit tenure. Instead their study indicated that audit tenure could have positive effects in regard to audit quality. Because their data showed that higher tenure resulted in more effective audit.
The findings by Knechel & Vanstraelen (2007) indicated that the auditor becomes more effective with long audit tenure and with that have a positive impact on the audit quality. That received further support by Chi et al. (2012). Chi et al. (2012) findings about client importance and audit partner independence indicate that audit quality increases with long audit tenure. Similar findings were found by Chen et al. (2018), which indicate that audit quality have a positive association with audit tenure. Svanström (2013) describes the reason behind it to be knowledge spillover. The argument is that with a stronger relationship, the auditor’s knowledge about the business and industry will increase, which will influence the audit quality in a positive manner.
The length of the auditor and client relationship is the most common measure for audit tenure. The study by Knechel & Vanstraelen (2007) measured it with a dummy variable which got the value of 1 if the relationship lasted for more than 3 years, otherwise it was
7
given a value of 0. They had a variable that measured the total length of the relationship between the audit firm and the client as well. Geiger & Raghunandan (2002) found that the audit quality might be more influenced by clients in the early years of partnership. This is supported by the findings of Velte & Loy (2018) who found that the risk of mistakes being made is noticeably higher for the first two years of auditing rather than for the third and fourth. (Myers et al., 2003; Velte & Loy, 2018).
2.1.2 Client importance
A financially important client could have an impact on the auditor's incentive to perform the audit. The pressure of not losing a multi-billion corporation is much higher than losing a small local coffee-shop around the block. However, it exists claims that the reputational consequences of losing a large client outweighs the financial aspect of not losing it (Tepalagul & Lin, 2015).
The study by DeFond et al. (2010) indicated that the audit firms’ incentives to keep a good reputation and avoid litigation costs outweighs the financial aspect of retaining a client, which implies that audit independence remains uncompromised. This is based on distressed companies in the U.S. during 2001, the samples consisted of 1 158 companies. This got supported by the study by Ratzinger-Sakel in 2013 when she investigated if non-audit services had any association with compromised non-audit independence.
Chen et al. (2010) investigated legal and regulatory changes in China, and how it affected the relation between client importance and audit quality. Their study observed 8 917 firm-year during a 10-firm-year period, from 1995 to 2004. They found that when laws and regulations became stricter regarding audit failures, then audit firms got more thorough when dealing with more financially important clients and were more likely to issue a modified audit opinion (reporting errors that the auditor find in the financial reporting). However, when regulation is less strict, then audit firms are less likely to issue modified audit opinion when dealing with important clients.
The study by Chen et al. (2018) continued further on the findings of Chen et al. (2010) and found evidence that auditors from smaller audit firms are more likely to compromise
8
their audit independence for financially important clients. This evidence was based on data gathered between the years 2007 to 2012, which included 8 551 firm-year observations on Chinese listed companies. Chen et al. (2018) investigated about if the economic bond between client and auditor could impair the audit quality, by using audit adjustments as a proxy for audit quality. They stated the following hypothesis “There exists a negative association between client importance and the likelihood of an audit adjustment”. Their research confirmed the hypothesis which indicated that if the client increases in importance for the audit firm then it will in more cases than not mean a decrease in audit quality, if it helps keeping the client by having their independence compromised.
Chung & Kallapur (2003) stated that the auditor is facing a choice when discovering a breach, either report it with a risk of losing the client, or having their independence compromised and lower audit quality by not reporting the breach. They investigated the association between client importance and audit quality, by using abnormal accruals as a measurement of audit quality. Their total sample consisted of 1 871 clients that published information about their audit and non-audit fees in the first half of 2001 in the U.S., which did not reveal any significant association between client importance and audit quality. These findings got supported in the Taiwanese setting by Chi et al. (2012). Their study also failed to find any association between auditors compromising their independence for more important clients, based on a sample of 22 978 firm-year observations of both unlisted and listed companies between the years 1990 to 2009.
A way to measure client importance is to calculate the auditor’s capability to see how big that specific client is in a sales ratio divided to the total sales of all clients (Stice, 1991). This method is also used in other studies such as Chung & Kallapur (2003).
2.1.3 Non-audit services
Non-audit services are services that are not directly linked to the audit, such as tax advisory services and legal services. Non-audit services have been stated to be more profitable for audit firms than actual audit services (Tepalagul & Lin, 2015). Non-audit service fees have for many years been perceived to be one of the key factors that could
9
potentially compromise the independence of an auditor (Frankel et al., 2002; Francis, 2006).
Kinney et al. (2004) refer to non-audit services as “lucrative consulting contracts”. They performed a study by investigating 949 firm-years in the US between 1995 to 2000 in order to investigate the association between non-audit services and restatements. Restatements was used as a measurement for audit quality. Their observation failed to find any association between non-audit fees and restatements, however they found a negative association between tax services fees and restatements.
One of the earlier studies to perform an investigation regarding non-audit services was Frankel et al., (2002). They investigated 3 074 firms that made a proxy statement on the SEC’s EDGAR database during the first half of 2001. Frankel et al. (2002) tested the association between non-audit fees, audit fees and total audit fees with audit quality. They found a positive association between high non-audit service fees and lower audit quality, meaning that the auditor let go of their independence by letting the client have more influence over the auditor’s decisions making, such as allowing more audit adjustments. At the same time, they found a negative association between audit fee and audit quality, but their data for the total audit fee indicated no association (Frankel et al., 2002).
Svanström (2013) found a positive association between higher audit quality and non-audit service fees. Svanström (2013) had a sample of 420 private firms in Sweden during the year 2006 when investigating the association between different types of non-audit services with audit quality, by using earnings management as a measurement for audit quality. Similar to the findings by Svanström (2013), Zhang et al. (2016) did not find any indication that non-audit fee has any association with compromised independence either. They conducted their research to find if auditors independence got affected by providing non-audit services. Their study was computed in a Norwegian setting and based on 415 Norwegian companies which data were available on Compustat Global between 2008 to 2010.
The study by DeFond et al. (2002) argued that the risks of jeopardizing reputation and litigation costs are of greater importance for auditors and audit firms than the economic
10
benefits of high non-audit service fees. This implies that auditors will act more independently since the potential consequences of doing the audit with a compromised independence outweighs the financial aspect of losing a client
Both Svanström (2013) and Zhang et al. (2016) used non-audit ratio as a measurement for non-audit services, meaning they divided the total non-audit service fee with the total audit fee. In fact, this method is used by the majority of previous research (Reynolds et al., 2009; Ferguson et al., 2014; Hohenfels & Quick, 2018). Ashbaugh et al. (2003) used both absolute numbers and ratio, however they were more positive towards ratio and motivated it by stating that it captures other aspects such as the monetary value the audit services bring to the company in relation to audit services, which using total non-audit service fees fail to do. Non-non-audit fee ratio is also preferred because it follows the recommendations from SEC about the proportion of non-audit fees to total client fees (DeFond et al. 2002).
2.2 Sanctions
It is the auditor’s duty to ensure the stakeholders that the financial report does not contain any frauds or misstatements. If the audit does not require any corrections like restatements or receive any accounting auditing enforcement releases (AAERs) then it is assumed that quality of the audit is high. However, only because no restatements have been made or AAERs been issued, it is does not automatically imply that the audit quality is high. Because not every misstatement gets detected (Srinivasan, 2005; Dechow et al., 2011; DeFond & Zhang, 2014). Compromised audit independence could lead to that the auditor would accept more aggressive accounting decisions, which in the end could lead to that the amount of misstatements would increase (Mayers et al., 2003). The main ways to measure material misstatement, is by either restatement which is the most recurrent one (Kinney et al., 2004; Archambeault et al., 2008; Chin & Chi, 2009; Wang et al., 2015) or AAERs, which is issued by the SEC (Srinivasan, 2005).
Dechow et al. (2011) made an observation of 2 190 AAER releases during the time period 1982 to 2005, which in total consisted of 676 unique companies. They focused on AAERs that were released as a result of overstated earnings in order to develop a model that would
11
predict misstatements, which was the purpose of their study. They found that sales experience an increase during the year when the misstatement took place. They stated two reasons for it: 1. Companies that have errors in their financial report tend to expand their business and by increasing their capital base. 2. Their study indicated a connection between AAER and transaction management, that the firm tries to influence the reported cash flow by using illegal methods to effect when and how the customer will purchase the good / service. They provided an indication that there exists a connection between reductions of employees and misstatements. The company which performed the error tend to experience a decrease in number of employees during the period when the misstatements take place. The reason behind it is often that the company try to influence their short-term earnings.
However, a downside of using AAER as a measurement for audit quality is the limited selection of sample. The researcher can only choose data regarding those cases that are published and pursued by the SEC. Also, according to Dechow et al. (2011) SEC lacks the ability to pursue every case available, thus are forced to make decisions about which ones to drop and which ones to pursue further. The study argued that the cases which causes the highest stock decline is the priority in the selection process for the SEC, because they are the ones that have the largest impact on investors. Therefore, there exist a possibility for selection bias, which can lead to that some manipulated earnings may go undetected.
AAERs are very similar to the sanctions that can be issued by the Nasdaq Stockholm Exchange. Listed companies can get sanctioned if they breach either, the Nasdaq Nordic Member Rules, Swedish law, or other regulations which include general accounting standards and IFRS as an example. The disciplinary committee of the exchange determines the sanctions and fines issued (Nasdaq Nordic Member Rules, 2019). The companies which have breached the rules can get the sanctions a couple of years after the breach, since some cases takes time to evaluate.
Chen & Chi (2009) study about restatements association to industry expertise provided evidence that companies which are smaller compared to their competitors, less profitable and more debt-burdened have higher likelihood making frauds or mistakes, which results
12
in restatements or AAERs. The study was conducted in Taiwan and used a total sample size of 326 restatements firm-years and 34 683 firm-years of non-restatements based on Taiwanese listed companies that had a Big 4 audit firm as their key auditor between 1990 to 2004.
2.3 Regulation
The European Commission states that one of the biggest factors which could impact audit independence is providing high amount of non-audit services. Thus, in order to limit the amount of non-audit services provided, a cap was introduced in the regulation of 2014. The cap means that the non-audit service fee cannot take up more than 70 % of average the audit fee that has been paid by the client to the audit firm during the last three years (Regulation (EU) No 537/2014). The European Commission states that another key aspect of maintaining audit independence is that the relationship between auditor and client does not get too personal. Therefore, in the same regulation got it established that the key auditor must be rotated at least every seventh year (Regulation (EU) No 537/2014).
The directive on Statutory Audit (2006/43/EC) requires statutory auditors to be independent and follow member states’ ethical principles which among other things includes guidelines of fees, rotation, ownership and behavioral aspects to be considered independent. These are based on either the countries own specific codes or through principles based on the IFAC Code of Ethics (Green Paper, 2010). IFAC divides independence into two categories, independence of mind and independence in appearance. Where independence of mind is explained as being able to make conclusions without compromised professional judgement, thereby being objective and sceptic in a professional way. Independence in appearance is referred to be able to keep distance from information that are of large significance and circumstances which could lead to compromised integrity, objectivity and professional skepticism (IFAC Code of Ethics, 2006).
A framework was created with the European Commission’s new directive of 2016, which is a co-operation between oversight bodies in the European Union. This Committee of
13
European Auditing Oversight Bodies (CEAOB) was referred to as one of the key objectives with the new legislation on statutory audit (European Commission, w.y.). The Swedish representative of the CEAOB is the Swedish Inspectorate of Auditors (SIA). SIA work to secure qualified auditors by ensuring stakeholder and the society with auditors who can perform professional audits. But also developing the auditing standards and ethics (Revisorsinspektionen, w.y.).
2.5 Agency Theory
Agency theory is a theory that is frequently used in research regarding audit independence, especially non-audit services. This is because the theory says that an auditor can only perform a fully objective audit and ensure quality if they are free from influence of management (Velte & Loy, 2018). The theory’s foundation lays in that it exists an issue of separation of ownership and control. The theory explains the relationship between an agent and principal. In companies the agent are referred to as the managers, and the principal as the shareholders, where the agent is hired to conduct the operations on behalf of the principals, and the costs that occur with this relationship is referred to as agency costs. The theory states that the agent might act towards maximizing his or her own profit instead of the principals. This is something that the principals want to avoid, they of course want the managers to act in their interest and not in a self-interest way. However, it can be difficult to do so because it is the managers that operate the day-to-day business and are the ones that receive information about the business firstly and decide when and how to share it with the shareholders (principals). The managers have so called asymmetric information, more knowledge than the other party (Jensen & Meckling, 1976).
In a relationship between an auditor and managers, the manager wants the auditor to act in the interest of the manager and allow practices that maximizes the managers profit. For instance, disclosure of a weakness in internal control could have a negative effect for the company in the eyes of the market, which is something that the management want to avoid and therefore they will try to maximize their maximum value by influencing the auditor's independence so that it will not be reported. The theory suggests further that a way to reduce the risk of compromised audit independence is to rotate both key auditor and audit firm (Velte & Loy, 2018).
14
3 Methodology and hypothesis.
______________________________________________________________________
This chapter describes the methodology of the study, by firstly provide information about the sample selection and data collection. It is then followed by providing specifications of the different measurements, lastly describing the hypotheses development and explanation of the logistic regression model.
______________________________________________________________________
3.1 Methodology
Data for this study has been gathered by using a quantitative approach through observations of annual reports and statistics (Bryman 2012). The study selects of 49 year observations during the years 2005-2018. 19 of the observed company-years are for the period when the company committed the breach, 15 are from one year post the breach and 15 are from the year prior to the breach. The observed companies are from 8 different industries and are listed on either Nasdaq Stockholm or Nasdaq First North. Information for which company got sanctioned and the reason for it was manually collected from the Nasdaq Stockholm webpage where documents about which companies got sanctioned and the reason for the decision regarding the sanctions are available.
The necessary data in order to measure audit independence were collected manually from each of the sanctioned company’s annual report for the given year. Data regarding the audit firm revenue was collected manually from allabolag.se. However, all necessary numbers were not available on allabolag.se, and in those cases the data was collected directly from the audit firms’ annual reports. In some cases, older annual reports were not available online and were thereby collected by contacting the audit firm by email for the necessary information. To investigate the hypotheses the data were later used in a logistic regression model.
3.2 Sample selection
This study focused on companies that were listed on Nasdaq Stockholm and Nasdaq First North, which received either a warning or sanction by the Nasdaq Stockholm Exchange during the period 2008-2018.
15
The sample selection for this study consisted of 5 different steps. The first step was to identify all sanctions or warnings that were issued during the selected time period of 11 years (2008-2018). The amount of sanctions/warnings that were issued for each year is explained in table 1. Table 1 further presented that during these time period, there were in total 95 sanctions or warnings issued by the Exchange. That is an average of around 8,6 decisions per year, and as seen in table 1 most decisions were issued during 2016 (18). However, a big majority of the breaches were of a nature that was not relevant for this study, such as the sanctioned company published information on the wrong channel or failed to provide information in the right time to the Exchange.
Therefore, step 2 in the sample selection was to identify those sanctions or warnings that were of financial nature, such as accounting errors or incorrect financial statement. 0,832 of the total sample were excluded, due to the fact that they were not based on breaches of financial kind, such as accounting errors or incorrect financial statements. The total sample of 95 sanctions got reduced to 16 breaches which presents the final sample this study investigated. The distribution of final sample is presented in table 1, explained which years the sanctions or warnings were issued and how many of them were of financial nature and also that 2014 was the year which had the most breaches that were of financial kind (4).
Table 1: Distribution of decisions made by Nasdaq Stockholm
Year of Decision Total (financial kind)
2018 11 (1) 2017 11 (1) 2016 14 (4) 2015 7 (1) 2014 7 (2) 2013 8 (1) 2012 7 (1) 2011 7 (1) 2010 6 (0) 2009 3 (1)
16
2008 13 (3)
Total 95 (16)
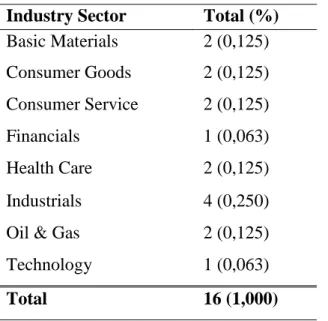
Table 2 presents which industries the sanctioned companies operated in. In total, the sample consisted of 8 different industries, and the most common industry was Industrials which represented 0,250 of the sample (4). 0,250 of the sanctioned companies were listed on Nasdaq First North, and 0,750 on Nasdaq Stockholm, which is illustrated in table 3.
Table 2: Company distribution regarding industries
Industry Sector Total (%)
Basic Materials 2 (0,125) Consumer Goods 2 (0,125) Consumer Service 2 (0,125) Financials 1 (0,063) Health Care 2 (0,125) Industrials 4 (0,250)
Oil & Gas 2 (0,125)
Technology 1 (0,063)
Total 16 (1,000)
Table 3: Company distribution of stock market
Stock Market Total (%)
NASDAQ Stockholm 12 (0,750) NASDAQ First North 4 (0,250)
Total 16 (1,000)
The next step in the selection process were to identify the years each breach occurred. The distribution of this is illustrated in table 4, it presents that breaches were made in 9 different years. Year 2015 and 2013 had the most breaches, with 4 financial breaches each. 4 given years had 0 breaches, 2018, 2014, 2010 and 2009. As seen in table 4, the total number of company-years of observation are 19 for sample A. However, table 1
17
illustrated that there were 16 decisions issued by Nasdaq Stockholm, the reason behind why sample A consists of 19 company-years and not 16 is that there were 3 breaches which were made over a two years period. This study chose to investigate both years for those 3 cases for when the breach occurred, making the final company-years for sample A to an amount of 19 company-years.
Table 4: Company-year distribution of for Sample A
Year of breach Total (%)
2018 0 (0,000) 2017 1 (0,053) 2016 1 (0,053) 2015 4 (0,211) 2014 0 (0,000) 2013 4 (0,211) 2012 3 (0,158) 2011 1 (0,053) 2010 0 (0,000) 2009 0 (0,000) 2008 2 (0,105) 2007 1 (0,053) 2006 2 (0,105) Total 19 (1,000)
Step 4 in the sample selection process were in regard to Sample B. Sample B consisted of companies which is later referred to as “non-sanctioned companies”. The observations for sample B were based on the same companies that were selected in sample A, but the data consists of the year pre and post the breach. Thus, compared to sample A the data for sample B is gathered for the fiscal year before and after the company made the breach.
As illustrated in table 5, two company-years were excluded from sample B. One because it required data regarding an audit firm’s revenue in order to calculate client importance for 2018. That given audit firm used as many audit firms do, a broken fiscal year, meaning that their data for 2018 were not published by April 2019. The other company-year were
18
excluded because that company did not exist the year before they made the breach, which made it impossible to gather any data regarding that given year. Making the total amount of company-years for sample B to 30. As seen in table 5, 15 of the company-years were from pre sanction and 15 post breach. The table illustrate the amount of company-years for each year between 2005 and 2018, more than 0,250 of the sample was gathered from 2014 (8). 2014 was also the year with the most observations for both post and pre sanction, 4 each. Three years had 0 observations, 2018, 2015 and 2006.
Table 5: Company-year distribution for sample B
Sample B Post (Pre)
2018 1* (0) 2017 1 (0) 2016 4 (1) 2015 0 (1**) 2014 4 (4) 2013 1 (0) 2012 1 (2) 2011 0 (3) 2010 0 (1) 2009 2 (0) 2008 1 (0) 2007 1 (2) 2006 0 (0) 2005 0 (2)
* Missing data regarding audit firm
** Given company had no data for that year
Total 15 (15) (1,000)
Table 6 presented the total amount of company-years for this study. 0,388 of the observations was from sample A (19) and 0,612 is from Sample B (30). Therefore, the majority of the observations are of non-sanctioned companies in this study.
19 Table 6: Sample distribution
Distribution of Samples Total (%)
Sample A 19 (0,388)
Sample B 30 (0,612)
Total 49 (1,000)
3.3 Data collection
The data collection process for this study were conducted in 6 different steps. The first step was to collect data manually from Nasdaq Stockholm webpage. Which were compiled and stored on a Google Drive spreadsheet. The first thing was to identify companies that had been sanctioned or received a warning, which was put into the spreadsheet together with which date the decision was made, the year of the breach and what type of breach it was. This was in regard to sample A and therefore had a time period of 11 years between 2008 to 2018.
The next step was to extend the spreadsheet by manually gather information regarding the sanctioned company. By using Nasdaq Stockholms webpage, this study collected information about the sanctioned companies ID-number, what industry they operated in, if they were listed on Nasdaq Stockholm or Nasdaq First North. The following step was to extend the spreadsheet even further by manually collecting numbers regarding the sanctioned companies. By looking at their respective annual report and their notes for the given year the study gathered information regarding which key audit firm they had, how long tenure they had with that audit firm, how many audit firms they had on their payroll and finally the structure of their total audit fee, how much was audit related and how much was related to non-audit services. The study also investigated the given company’s financial statement and balance sheet in order to collect the needed financial data such as, revenue, net income, total assets, total liabilities which were all included in the spreadsheet.
The fourth step was to repeat step number 3 for sample B (the non-sanctioned companies) by collecting the same items as for the sanctioned companies in sample A. After this step all key auditors were identified which made step 5 possible. Because the study had at this
20
stage the information for which years and for which audit firms it needed to collect their total sale for, which is required in order to calculate the independent variable client importance. Therefore, step 5 was to collect total sales for given year and given audit firm by manually gather that information. The first approach to gather the information was to use webpage allabolag.se. However, all information needed were not available on allabolag.se, which made this study to move on by searching for given audit firms annual report for that missing year. Also, in some cases the required annual reports were not available online, which allowed the study to try the database Thompson Reuter Eikon Datastream, yet, the study had no success in gather the total sales for given audit firm at given year. That forced this study to contact those audit firms directly in order to gather their total sale for given year. This process took time, which delayed the study but after several attempts all necessary data were collect and implemented into Google Drive spreadsheet.
3.4 Measure for Audit independence
As mentioned in section 2.1, the definition of audit independence is the likelihood of that the auditor discover a breach and report it (DeAngelo, 1981) and there are four main threats towards audit independence;
1. Client importance, 2. Non-audit services, 3. Auditor tenure and 4. Client affiliation with audit firms (Tepalagul & Lin, 2015). However, as explained in section 2.1, the threat of client affiliation is not as great as the other three elements. Therefore, it is a variable that is not commonly used when measuring audit independence, thus the proxy variables that was used in this study to determine audit independence will be Client importance (CI), Non-audit services (NAS) and Audit tenure (AT).
3.4.1 Audit Tenure
This study measured audit tenure by the amount of years each company has been a client to the same audit firm. Following the approach of Knechel & Vanstraelen (2007), this study measured audit tenure with the length of the current key audit firm. The variable for audit tenure is referred to as AT. However, prior studies have shown that it is during the beginning of the audit tenure that the most changes in audit quality occurs (Geiger &
21
Raghunandan, 2002; Myers et al., 2003; Velte & Loy, 2018) therefore a maximum value was set at 10 years. Similar to the study by Carey & Simnett (2006) that had a maximum of 7 years. The proxy variable audit tenure is referred to as AT.
3.4.2 Client Importance
This study measured client importance by calculating the total audit fee purchased by the client to the audit firm compared to the total revenue for the audit firm during the given year. This provide a ratio that can be interpreted as client importance. A similar method was used by Stice (1991), which were further developed later by Chung & Kallapur (2003) and provided the foundation for this study measurement for client importance. The variable for client importance is referred to as CI. CI is calculated by the following method:
Equation 1: Client importance
(%) 𝐶𝐼 = 𝐶𝑙𝑖𝑒𝑛𝑡 𝑡𝑜𝑡𝑎𝑙 𝑎𝑢𝑑𝑖t 𝑓𝑒𝑒 𝐴𝑢𝑑𝑖𝑡 𝑓𝑖𝑟𝑚′𝑠 𝑡𝑜𝑡𝑎𝑙 𝑠𝑎𝑙𝑒𝑠
3.4.3 Non-Audit services
This study used audit service fees in relation to the total audit fee to measure non-audit service, as the majority of previous literature has done (Reynolds et al., 2009; Svanström, 2013; Ferguson et al., 2014; Zhang et al., 2016). This method is also recommended by SEC (DeFond et al., 2002). The variable non-audit services is referred to as NAS, this study calculated NAS the same way that each paper listed above calculated non-audit service.
Equation 2: Non − audit services
(%) 𝑁𝐴𝑆 =𝑁𝑜𝑛 − 𝑎𝑢𝑑𝑖𝑡 𝑓𝑒𝑒 𝑇𝑜𝑡𝑎𝑙 𝑎𝑢𝑑𝑖𝑡 𝑓𝑒𝑒
3.5 Control variables
Similar to prior studies in the subject, this study chose to include control variables. Chin & Chi (2009) and Wang et al. (2015) showed that companies with material misstatements
22
tend to have higher debt ratio and be less profitable, thus in order to enhance the findings this study chose to include debt ratio (LEV) and return on assets (ROA). They were calculated the following way:
Equation 3: Return on assets
(%) 𝑅𝑂𝐴 = 𝑁𝑒𝑡 𝐼𝑛𝑐𝑜𝑚𝑒 𝑇𝑜𝑡𝑎𝑙 𝑎𝑠𝑠𝑒𝑡𝑠 Equation 4: Debt − ratio
(%) 𝐿𝐸𝑉 =𝑇𝑜𝑡𝑎𝑙 𝐿𝑖𝑎𝑏𝑖𝑙𝑖𝑡𝑒𝑠 𝑇𝑜𝑡𝑎𝑙 𝑎𝑠𝑠𝑒𝑡𝑠
This study chose not to include any more control variables, for instance the variables size or profit margin were excluded. This for the reason that this study found too high correlation for size and profit margin with ROA. Therefore, in order to avoid the threat of multicollinearity those two variables were excluded in this study.
3.6 Sanctions
Sanction is measured as a binary variable which can only take a value of 0 or 1. If the company got sanctioned, then it received a value of 1 and if they did not get sanctioned then they got a value of 0. This approach follows the method of Chin & Chi (2009) which gave companies that made restatements an indicator of 1 and 0 if no restatements were made.
3.7 Hypotheses development
Association between audit independence and audit quality is a subject that has an extended literature base, but the relation between audit independence and sanction as a measurement for audit quality is limited in the European setting. However, this study considered the paper by Kinney et al. (2004) to be one of the most similar studies to this research. They investigated the association between audit independence and restatement (measurement for audit quality) and found no significant association between the
23
variables. This study predicts to receive a similar result, which leads to the following proposed hypothesis (stated in null form):
H1: There is no relationship between audit independence and sanctions (audit quality).
This study used three different proxy variables to measure audit independence (AT, CI and NAS), for the reason that they are considered to be the three main threat against audit independence. Therefore, this study investigated all three variables in order to find how they influence sanction independently. This study predicted that each variable will have a negative relationship with sanction, meaning that if the independent variable increases, the dependent variable will decrease. Thus, this study proposed the following alternative hypotheses that will be tested.
H2a: There is a negative relationship between AT and sanctions H2b: There is a negative relationship between CI and sanctions H2c: There is a negative relationship between NAS and sanctions
Each hypothesis have a null hypothesis, which each states that the independent variable does not have any association with audit independence. Both Carey & Simnett (2006) and Wang et al. (2015) expected to find a negative relationship between AT and audit quality. However, Wang et al. (2015) was the only one that found a negative value for AT, but they were not able to confirm the association due to that they found the relation not to be statistically significant.
In regard to the variable CI, this study expected to follow the study by Chung & Kallapur (2003). They found indications that higher CI equals higher audit quality, but the association was not strong enough to fully be confirmed because their findings were not statistically significant.
For NAS this study predicted to find indications similar to Svanström (2013), that higher NAS contributes to higher audit quality. Each hypothesis will be tested with help of a logistic regression model.
24
3.8 Logistic regression model
Following both Dechow et al. (2011) and Wang et al. (2015) this study chose to develop a logistic regression model to test the different hypotheses regarding the impact audit independence has sanctions. This study came up with the following model:
Model 1:
𝑆𝑎𝑛𝑐𝑡𝑖𝑜𝑛 = 𝛽0+ 𝛽1𝐴𝑇 + 𝛽2𝐶𝐼 + 𝛽3𝑁𝐴𝑆 + 𝛽4𝐿𝐸𝑉 + 𝛽5𝑅𝑂𝐴 + ε
This model was inspired by the model developed in the paper by Wang et al. (2015), which investigated the association between audit-partner quality and accounting restatements. As Wang et al. (2015) this model included control variables. Wang et al. (2015) provided evidence that companies that have flaws in their financial reporting tend to be more debt-burdened and less profitable than those companies that does not breach the rules. Therefore, LEV and ROA are included as control variables to enhance the study. LEV equals total liabilities divided on total asset. ROA equals the company's income divided on total assets. With help of SPSS version 25 the model is used to show how the independent variables affect audit quality by having sanctions as a measurement.
The independent variables:
AT = Audit Tenure (The length of the audit firm and client relationship, measured in years).
CI = Client Importance (Total client audit fees in relation to audit firm’s total sales). NAS = Non-Audit services ratio (Total non-audit fee in relation to total audit fee). LEV = Debt ratio (Total debt in relation to total assets).
25
4 Empirical Findings
______________________________________________________________________
This chapter presents the findings that were made of the collected data from the 16 companies and the total observations of 49 company-years and the logistic regression model.
______________________________________________________________________
4.1 Descriptive statistics for variables used in logistic regression
Table 7 consists of descriptive statistics for the variables included in the study. The data in Table 7 were divided in three different categories, sample A, sample B and differences. Sample A consists of the mean and median values of the year(s) the companies received sanction is based upon. Sample B shows the mean and median value for the combined data of one year before and one year after the companies breached the Nasdaq Stockholms rules. Table 7 then presents the difference of mean and median between sample A and sample B, and lastly data of the mean for the total 49 company-year observations is presented.
Table 7 shows a value of 0,388 as a sanction mean for the observation. Thus, for the entire sample of 49 company-years, 0,388 of them are sanctioned company-years, and therefore the sample consisted of 0,612 non-sanctioned company-years. This is a very low number compared to Chin and Chi (2009), which sample consisted of 99 % non-restatement firm-years and 1 % restatement firm-firm-years. 0,388 is lower than the sample for Kinney et al. (2004), whose sample consisted of 0,458 restatement firm-years.
As predicted, this study found a relatively low score on the total mean of audit tenure (6,112 years), due to that a cap of 10 years. Compared to the study by Svanström (2013), which also used Swedish setting but with private companies. Svanström (2013) had a mean of 14,383 years, which is considerably higher, but he had no set maximum cap, he received a maximum value of 90 years which boosted the mean. However, sample A in this study were lower compared to sample B, in both median and mean. A score in mean of difference of -0,963 strengthens the view of that sanctioned companies have in general lower audit tenure. In addition, a difference of median of nearly -0,5 further indicate that
26
the audit tenure was in fact significantly lower in sample A compared to sample B. These findings are in line with the study by Wang et al. (2015), which also found a negative mean difference in audit tenure (-0,300). For restating companies, they found a mean of 5,019 which is very similar to the value presented in this study (5,526).
Table 7 presented an indication that higher client importance equals higher audit quality by showing a mean of difference of -0,505, and a difference of median of -0,202, this strengthen that view. The total mean of 0,015 is higher than Chung & Kallapur (2003), which had 0,005. This implies that the audit paid by the public Swedish companies in this study have a bigger proportion of the given audit firm’s revenue than the given audit firms that are U.S. based in the study by Chung & Kallapur (2003).
The findings regarding NAS are similar to Svanström (2013), he found a mean value for NAS of 0,226 and this study found a result of 0,248. This give an indication of that the public companies in this study have higher NAS ratio compared to private companies in Sweden, at least when comparing Svanströms (2013) to this study. Further comparisons showed that this sample of Swedish public companies are more likely to purchase non-audit services than private companies. Because in the study by Svanström (2013) 0,503 did not purchase any non-audit related services, compared to this study which showed that around 1/10 of the public companies purchased 0 non-audit services. The findings indicated that non-sanctioned companies have higher NAS, with a negative difference of mean and median, -0,896 and -1,029. This implied that when NAS is higher when audit quality is higher. That is in line with the findings by Svanström (2013), who also found a positive indication that higher proportion of non-audit fees result in higher audit quality (measured by discretionary accruals).
Sample A showed a mean value of 0,670 LEV, this number is higher compared to other studies. Chin & Chi (2009) got a mean of 0,445 of LEV for restating companies and Wang et al. (2015) had a mean of 0,283. Continuing comparing the findings in this study of the mean for LEV in sample B, the value showed that there is a quite large difference from what Chin & Chi (2009) and Wang et al. (2015) found. Chin & Chi (2009) found a mean LEV value of 0,425 for non-restating companies and Wang et al. (2015) 0,264, while this study found a mean LEV of 0,585. The difference of mean of 0,769 between sample A
27
and B provided a stronger indication that as predicted, sanctioned companies has higher debt ratio. Therefore, even that the value of LEV is considerably higher in this study compared to previous literature, it follows the same trend, that companies that perform accounting errors or commit accounting frauds have higher debt ratio. Because both Chin & Chi (2009) and Wang et al. (2015) presented positive mean of difference and median of difference for leverage, which this study did as well.
The findings in this study followed previous research, and the predictions of that companies that makes accounting errors or commit accounting frauds tend to be less profitable. Table 7 presented a mean of difference of -0,365 and a median of difference of -0,152. This is for instance in line with both Chin & Chi (2009) and Wang et al. (2015), which had negative value for both mean difference and median difference. However, both the papers had positive values for mean and median for both their samples, this study presented positive values for median but had negative mean for both samples. Implying the companies in their samples are more profitable than the Swedish public companies in this study. However, Svanström (2013) presented a mean of ROA 0,046, which is higher than any number than those presented in either Chin & Chi (2009) or Wang et al. (2015), the indication of that Taiwanese or Chinese companies would have higher return on assets requires further observations.
A side note to these finding is that this study only found one observation that had a NAS over 0,700. Therefore, at least in regard to this sample, there seems not to be a great threat for the audit firms to change their approach after Regulation (EU) No 537/2014 got implemented in mid-June 2016. Because 0,980 observations are already below the cap that was set, and that cap was set for a three years average and for this sample, no one of the 16 companies exceeded that restriction over a three-year period. In fact, for this sample only one of the 16 companies had an average of NAS over 50 %.
Of the total 49 observations 0,490 had seven or more in AT. Of the 16 companies investigated, 10 of them had at least one observation that included AT of seven or more, meaning that if the company has not assigned a new key auditor, 0,625 of companies in this sample would get affected by the regulation. Another point regarding this subject is that, it was only one company that changed audit firm after the breach was made.
28
Table 7: Descriptive statistics for variables used in logistic regression
Variables Sample A n= 19
Sample b n=30
Difference
Mean Median Mean Median Mean diff. Median diff. Total mean Sanction 1,000 1,000 0,000 0,000 0,388 AT 5,526 6,000 6,500 6,500 -0,963 -0,494 6,112 CI (%) 0,012 0,016 0,018 0,025 -0,505 -0,202 0,015 NAS (%) 0,221 0,215 0,264 0,265 -0,896 -1,029 0,248 LEV (%) 0,670 0,638 0,585 0,582 0,769 0,473 0,618 ROA (%) -0,056 0,017 -0,018 0,032 -0,365 -0,152 -0,033
Table 8 included the results from a Omnibus Test of model coefficient. The p-value of 0,592 indicated that the model which included the variables AT, CI, NAS, LEV and ROA do not add any improvement to the intercept model, which only include the dependent variable (sanction). A p-value of less than 0,05 would have indicated that the model is an improvement of the intercept model.
Table 8: Omnibus Tests of Model Coefficients
Step 1 Chi-square Df Sig.
Model 3,710 5 0,592
Table 9 presented that AT had a 𝛽 -coefficient of -0,138, this indicated that companies which have shorter AT have higher odds of receiving a sanction. However, the odds ratio of 0,871 is very close to 1, which means that changes in AT have low impact on the odds of a company receiving a sanction. These findings are similar to the ones in the paper by Wang et al. (2015), which presented similar numbers compared to this study and their result showed indications that longer AT equals higher audit quality.
29
Nonetheless, similar to this study they found AT not to be statistically significant, they had a p-value of 0,18, which is a bit higher than this study, which found a p-value of 0,162. However, these findings go against Carey & Simnett (2006) which, opposite to this study had a positive value, which implies that higher AT reduce the audit quality. It is worth mentioning that Carey & Simnett (2006) result regarding AT went against their own expectations. The p-value for AT showed that the variable was not statistically significant, therefore the null hypothesis which states that there is no association between AT and sanctions, cannot be rejected. The findings do not provide support to the agency theory either, which stated that rotation of audit firm and audit partner increases audit independence. If that was the case then this study would have found a positive value, similar to Carey & Simnett (2006) which would have indicated that audit quality gets reduced with longer audit tenure. Instead, this study found signs of the findings by Svanström (2013), that longer tenure increases the audit quality by the phenomena knowledge spillover, meaning that if the auditor gets more familiar with the client's business and industry it will have a positive effect on the audit quality.
CI got a value of -0,013 which indicated that companies that have lower CI are more likely to receive a sanction. This result is very low and the odds ratio of 0,987 indicates that changes in CI have a very low impact of companies receiving sanctions or not. The p-value for CI is 0,880, which is higher than the alpha of 0,05 and therefore CI is not statistically significant. This result followed the result by Chung & Kallapur (2003), they also found a negative value and gave indications that if CI increases then the audit quality increases (measured by abnormal accruals). However, their values were larger and had a lower p-value, but not low enough to be significant (0,381). They could not fully confirm the findings about a negative relationship, and neither can this study due to that the relationship is not statistically significant. Therefore, the null hypothesis for the variable CI cannot be rejected.
The NAS value of -0,023 implied that companies that increases their level of NAS, reduce the odds of receiving a sanction compared to those companies that have lower NAS. Although, the value of -0,023 is very small, and the odds ratio of 0,977 indicated that the odds for a company to receive a sanction or not due to changes in NAS is very unlikely. The p-value of 0,284 is higher than alpha of 0,05, which indicated that NAS is not
30
statistically significant for this study. These findings are in line with previous literature, like Svanström (2013) who also received a negative value for NAS in relation to his measurement of audit quality (less discretionary accruals = higher audit quality). However, these finding go against Hohenfels & Quick (2018) who found a positive association between NAS and audit quality. Nevertheless, this study cannot reject the null hypothesis regarding NAS because the p-value is not statistically significant, even tho the study found indications of a negative relationship it was not viable enough.
The findings regarding LEV is in line with what the study predicted. The findings indicated that those companies that have higher debt ratio are more likely to make account error or frauds which results in that the company get sanctioned. This give support to Chin & Chi (2009), which received positive values, but no statistically significance. Because this study found a positive value for LEV (0,011) and no statistically significance due to that the p-value of 0,288 is higher than alpha of 0,05. The study predicted to get a higher odds ratio, because 1,011 is very small and barely have any effect on the odds. It is worth mentioning that the findings regarding LEV are stronger in this study than in Wang et al. (2015), they received a lower value (0,004) and higher p-value (0,830) for their control variable LEV making their finding not to be statistically significant either.
The ROA value of 0,002 is very small, which indicated that the changes in ROA does not affect the likelihood of receiving a sanction, this is supported by the odds ratio of 1,002. ROA is not statistically significant since the p-value of 0,873 is higher than the alpha of 0,05. These findings followed the result by Chung & Kallapur (2003) and Svanström (2013), they received a very low positive value and found it not to be statistically significant. However, this study predicted to be closer to the findings by Chin & Chi (2009), they found a strong negative value and found ROA to be statistically significance since their p-value was lower than 0,001.
31 Table 9: Variables in the Equation
Variables Predicted
sign
𝛃-coefficient Sig. Odds ratio
AT - -0,138 0,162 0,871 CI - -0,013 0,880 0,987 NAS - -0,023 0,284 0,977 LEV + 0,011 0,288 1,011 ROA - 0,002 0,873 1,002
5 Conclusion
______________________________________________________________________This chapter provide a summary and conclude the findings regarding the relationship between audit independence and audit quality (sanction). Limitations of the study is discussed. It ends with some suggestions for future studies.
______________________________________________________________________ The purpose of this study was to find out if audit independence has any relationship with sanctions issued by Nasdaq Stockholm, between the years 2008-2018.
The hypothesis regarding that audit independence has no relationship with the sanctions is not rejected in this study. Because even though the study found, as predicted, negative indications of relationships between each proxy variables for audit independence and sanction, not one of the stated alternative hypotheses for the variables could be accepted. That is because none of the proxy variables were statistically significant. That was the case for the chosen control variables as well, neither LEV nor ROA were found to be statistically significant. That none of the chosen variables were statistically significant led to that the chosen logistic model did not improve the intercept model. Because the findings indicate that there is no relationship between audit independence and sanction. Since prior studies have found indications that the chosen variables of AT, CI and NAS