The Demography Unit at the Department of Sociology In unity with The Department of Human Geography
The Integration of Ethiopian immigrants
in Sweden, 1990-2000
Author: Lars Agnarson
Master Essay (Magisteruppsats) in Human geography and Demography 10 credits (15 ECTS-credits), spring semester 2006
Supervisor: Bo Malmberg Methodology supervisor: Ying Hong
Abstract
The main purpose of this Master Essay is to analyse the integration of Ethiopian immigrants in Sweden between 1990 and 2000. My hypothesis has been that Ethiopian immigrants in Sweden constitute a group whose prospects to integrate are fairly low, but whose prospects to integrate also depend on the sex-composition and the length of staying in Sweden. In my analysis of the chosen group’s immigration pattern and integration, I have used a longitudinal database of the Swedish population where information on income and employment are included. I have analysed the group’s labour market participation and their prospects to reduce and eventually close the income gap in relation to the working aged population in Sweden.
The regime of control in Ethiopia between 1977 and 1991 forced hundreds of thousands of mostly young Ethiopians to flee to Europe and USA. Between 1985 and 2000, 8033 Ethiopians immigrated to Sweden. The peak years were 1989 and 1991, preceded by a dramatic increase of the number of Ethiopians who immigrated to Sweden. After 1991 the immigration from Ethiopia to Sweden declined rapidly to a similarly low level as before 1985. Nevertheless, when analysing the age-composition, those aged 18-29 years were shown to be in majority throughout the whole period as mostly young Ethiopians were forced to flee before 1991. Also, younger persons are more likely to migrate than older persons. The spectacular decrease of Ethiopian immigration to Sweden was probably linked to the former regime’s capitulation in 1991. In addition, Eritrea’s outbreak from Ethiopia in 1991 also had consequences on the numbers of Ethiopian immigrants to Sweden as Eritreans were no longer categorized as Ethiopians. Up to 1991, men were more likely to immigrate, but after then females were clearly in majority.
The frequency of not being employed has decreased considerably among Ethiopian
immigrants throughout the period. At the same time, the income gap between them and the population in general was reduced even though it remained large in the whole period. The decrease in the proportion of Ethiopian immigrants without employment was larger for the females than for the males, and even if men had higher incomes throughout the period, women’s income approached that. Thus it seems that the integration process is on its way for Ethiopian immigrants, especially for the women. The age-composition is probably an
important factor behind the group’s relatively successful integration given the large share of working aged persons.
Key words: Integration, Migration, Ethiopians, Labour market, Demography, Population
Table of Contents
1. Introduction ... 1
1.1. Purpose of the essay ... 1
1.2. Disposition ... 2
1.3. Methods and sources ... 2
1.3.1. A brief description of Louise database... 3
1.4. Methodological problems and limitations... 3
2. Human geography and Demography as tools of understanding migration... 4
2.1. Population geography... 4
2.2. Demography and migration... 5
3. Migration... 6
4. Integration... 7
4.1. How to define integration... 7
4.2. Integration in Swedish immigration politics ... 8
4.3. Early studies about Ethiopian integration in Sweden?... 8
5. Ethiopia ... 9
5.1. An overview of Ethiopia’s history of modern time... 11
5.2. Ethiopian migration – Main trends and Causes ... 12
6. Ethiopian immigration to Sweden ... 13
6.1. Age and sex-composition of Ethiopian immigrants to Sweden during 1985-2000 ... 15
6.2. Summary ... 18
7. Integration of Ethiopian immigrants in Sweden, 1990-2000... 19
7.1. Employment of Ethiopian immigrants ... 19
7.2. Income prospects among Ethiopian immigrants between 18 and 64 years of age who arrived to Sweden in 1990 and stayed until 2000 ... 21
7.3. Sex-specific changes in incomes among Ethiopian immigrants between 18 and 64 years of age who arrived to Sweden in 1990 and stayed until 2000 ... 23
8. Discussion and Conclusions... 24
8.1. Conclusions ... 25 References ... 27 Appendixes ... 29 Appendix 1. ... 29 Appendix 2. ... 30 Appendix 3. ... 36 Appendix 4. ... 37 Appendix 5. ... 38
1. Introduction
Migration is a major event for the migrants themselves, as well as for the people around them (family, friends etc.). In a structural perspective, migration can also be considered as a major event for the country of origin, for the receiver country but even at the global level. Both the country of origin and the receiver country are affected directly in that the population
structures will change, and dependent on changes in the societal structures there will be economic effects.
In an economic point of view, a country’s chances in the international economy are depending on its population – shaping the structures even at the global level. A country with a high level of immigration, but no intension to integrate the “newcomers” into the society, has a larger economic burden caused by the newcomers’ low labour market participation, and on their higher dependence on economic support. It was suggested that Sweden’s public economy would increase with about 40 milliard Swedish kronor per year if the labour market
participation of the foreign born population would increase to the level of the Swedish born population.1 Therefore, it is vital for a country’s economy as well as for its position in the international economy not to ignore the importance of a successful integration of their immigrants. Thus immigration can be a benefit for a country, instead of a burden.
This Master Essay is focused on the integration patterns of Ethiopian immigrants in Sweden between 1990 and 2000. As a base for this I analyse the immigration of Ethiopians to Sweden according to their age and sex-composition. The aim of this study is discussed in details in the following sub-chapter.
1.1. Purpose of the essay
The purpose of this Master Essay is twofold. The main aim is to analyze the integration of Ethiopian immigrants in Sweden between 1990 and 2000 with consideration to the sex-composition. The second aim is to analyse the Ethiopian immigration to Sweden according to the composition of age and sex between 1985 and 2000. This latter aim is a base to the former purpose: to find out which Ethiopian immigrants were to be integrated, and how this
composition influenced their integration. The reason to look at Ethiopian immigration
between 1985 and 2000 instead of between 1990 and 2000 is that the second half of the 1980s is an eventful period with considerable impacts on the demography of the immigrants. My hypothesis has been that Ethiopian immigrants in Sweden constitute a group whose prospects to integrate are fairly low (as shown by earlier studies on African immigrants2), but whose prospects to integrate also depend on the sex-composition and the length of the period they stayed in Sweden.
Even if I have focused on Ethiopian immigrants, the results may apply also to other non-European immigrant groups in Sweden as well as in other non-European receiver countries. It is important to increase the awareness of the difficult situation of especially non-European immigrants, but also to understand that even the receiver countries will be worse off if their immigrants are not integrated into the society. The age- and sex compositions are important to consider in order to optimize the society’s integration-efforts. This study can also be seen as a
1 Ekberg, 2006, p. 113
2 Englund (2003) shows that African immigrants in general are one of the most discriminated groups on the
small contribution to the research on exclusion, racism and xenophobia as the latter can be outcomes of an unsuccessful integration.
1.2. Disposition
Beside the introduction and the presentation of the purpose of the essay, chapter one also includes an overview of the methods and sources being used, as well as a discussion of methodological problems and limitations. In chapter two the theoretical framework is
discussed followed by a brief overview of migration as a demographic phenomenon (chapter 3). In chapter four, integration as a concept is presented, and in chapter five I discuss
Ethiopia, its history and the main trends and causes of Ethiopian migration. In chapter six an exploratory analysis of the Ethiopian immigration to Sweden is presented, followed by an analysis on their integration pattern. In chapter eight the main findings are discussed in relation to the literature. The conclusion is followed by the list of references and by the appendixes.
1.3. Methods and sources
In order to analyse the Ethiopian immigration to Sweden between 1985 and 2000, I have used a longitudinal database named Louise which contains data about, among others Ethiopian immigrants (the database is not limited to immigrants), with particular longitudinal data between 1990 and 2000. The data extracted from this database were analysed using SPSS. I have used the same database in the task to analyse the integration pattern of the selected group of immigrants. In this section (chapter 7), I have analysed the group’s integration by focusing on those aged 18-64 years who have stayed in Sweden between 1990 and 2000 based on their gross income-rate. The start and the end years of the integration-analysis depend on data limitations.3 As there is individual level data on the time of immigration, year of birth and sex, the database is useful to analyse immigration over a longer period. The earliest year of registered immigration is for example 1937.
In order to measure integration, I have compared the rate of immigrants with no labour market participation with the corresponding rate of the overall working aged population in Sweden (18-64 years of age). I have looked at those without registered taxable income, and in the next step at those whose yearly incomes were 5000 Swedish kronor or below (including those with no yearly tax-able income registered). Both were compared with the same group; the working aged population in Sweden with no labour force participation. The same “technique” was used when measuring the immigrants’ average yearly incomes. Six different income groups were distinguished at and compared with the average incomes of the working aged population in Sweden.
The essay also presents briefly the literature about Ethiopia, migration and integration, beside the data analysis. In addition I have used information (including statistical data) from Swedish National Encyclopaedia (NE) and Statistics Sweden (SCB) as well as from international organisations such as United Nations (UN), Population Reference Bureau (PRB),
International Labour Organisation (ILO) and UN Refugee Agency (UNHCR). The softwares I used were SPSS and Ms Excel. The two maps over Ethiopia (one over Ethiopia as a whole
3 The reason for the latter limitation is that I haven’t had access to the two last years (2001 and 2002) otherwise
and one over the north region) are borrowed from the website of the University of Texas Libraries at the University of Texas at Austin.4
1.3.1. A brief description of Louise database
The Louise database is a longitudinal database about the Swedish population, including data among others on education, income and employment. The version I have used in this study contains registered data from 1990 to 2000 but later versions have data up to 2002. The name of the database has now changed to LISA and is under development by the Swedish Central Bureau of Statistics (SCB). In this essay, however, the earlier version, Louise is used. Louise database contains information about the following categories of variables:
demography, education, income, occupation and family and household.5 The information included in Louise is based on other databases, but the structure is somewhat changed given regulations.6 Louise database is managed in SQL-server, which is a database application from Microsoft.7 The structure of the database is based on the individual, i.e. the basic unit is the individual him/herself. Other information, such as occupation as the source of income, are linked to the individual.8 In most cases, the structure of the database is tied to the calendar year.9 So if the user wants to find information e.g. on a specific immigrant group and the sex composition, the data will be provided by calendar years. The exceptions are those objects that are based on a specific date, such as marital status which is based on information from 31 December each year. In the following sub-chapter I discuss some other problems and
limitations one should be aware of when using the database.
1.4. Methodological problems and limitations
Eritrea’s independence in 1991 has had some consequences for the analysis of Ethiopian immigration to Sweden during the period. The reason for this methodological problem is that Eritreans were categorized as Ethiopian emigrants during the period when Eritrea was an Ethiopian “province”. After 1991 those emigrating from Eritrea are consequently regarded as Eritrean immigrants, rather than Ethiopians. This is taken into account in the essay.
As mentioned, I have limited the study of the Ethiopian immigration to Sweden to the period between 1985 and 2000. The reason for this is that African immigration to Sweden and not least immigration from the Horn of Africa (where Ethiopia is located) was fairly low before the end of the 1980s.10 The reason for the specific end-year (2000) is that the numbers of Ethiopian immigrants by the time had decreased to approximately the same low level as before 1985, and that the used statistical material does not include information for the years after the year 2000. In the task of analysing the immigrants’ integration into the Swedish society, I have limited the study to the period between 1990 and 2000 as information on the variables that is used for this task is limited to this 10-years period. The gross income rate used to measure the immigrants´ integration pattern in Sweden contains the gross income of
4 (Courtesy of the) University of Texas Libraries, the University of Texas at Austin,
http://www.lib.utexas.edu/maps 5 SCB, 2005:01, p. 8 6 SCB, 2005:01, p. 7 7 SCB, 2005:01, p. 10 8 Ibid., p. 13 9 Ibid., p. 14 10 Nilsson, 2004, p. 43
those individuals who have earned an amount of more than 100 Swedish kronor per year.11 However, as the gross income in Louise also includes other tax-based compensations such as sickness benefits from the employer as well as severance payments, this measure may show a somewhat misleading picture. These compensations are though less common among the immigrants of interest. In Louise database, the gross income variable is listed under “Loneink”. Furthermore, when analysing the immigration to Sweden as well as their
integration, the age of the immigrants used is not a precise measure as we don’t know the date of birth, only the year.
2. Human geography and Demography as tools of
understanding migration
In this essay, migration is the focus by two, in many ways, collaborating study fields; Human geography and Demography. In the discipline of Human geography, human activity is
considered as a variable that affects the environment just as much as the environment affects humans and their activity in an absolute and mutual relation. A central viewpoint in Human geography is that the environment and humans interact with each other.12 As a consequence, human beings and the environment shape each others uniqueness. However, some human geographers focus on the spatiality of population; they are population geographers. And since this is an essay partly within the discipline of Human geography, population geography is the main geographic approach to be used. In Demography on the other side, migration is
considered as one of the three main population processes (the two others are fertility and mortality). Demographers focus on the characteristics of the demographic event in mind. To give a deeper understanding of the nature of these tools I use when approaching Ethiopian migration to Sweden, each of the study fields is described in details in the followings mainly in relation to migration.
2.1. Population geography
A major question that population geographers are interested to explore is spatiality.13
Mapping is here of great importance, since the task to observe a phenomenon taking place on the earth’s surface is of major significance when it comes to understand a specific place or the interaction between several specific places. Mapping is then also important in the task to understand population, since – as stated earlier – the environment and humans interact with each other in an absolute and mutual relationship. As a consequence, population structures must be explored in the light of this interaction. After all, the distribution of population takes place over the surface of the earth. The reasons to why a specific population distribution takes place at a specific location can thus vary.14 A few examples of such causes are soil quality, climate, and the political and economic situation.15 By concentrating life to a place with a fertile soil and a favourable climate, humans can for example benefit more than moving to a place where these characteristics are less favourable to human needs. It is also more
11 SCB, 2005:01, p. 100
12 Knox & Marston, 2004, p. 8 13 Jones, 2002, p. 3
14 Knox & Marston, 2004, p. 88 15 Ibid.
favourable for the migrant to move to a country with more suitable political and economic structures. Hence this will make the migration process easier than migrating to a country where these characteristics are more hostile to the migrant – or where immigration is constrained by political and economic measures.
Population geographers’ aim is thus not limited to find out the reason behind population concentrations. By studying the characteristics of population, they also explore the future characteristics of a specific place. Population geography is therefore a non-isolated field. By considering the composition of population, population geographers also integrate demography into their analyses.16
2.2. Demography and migration
The relationship between demography and migration is strong. Migration is a vital event for not only the migrants themselves, but also for the society as whole. Migration is a just as strong determinant to population re-structuring as fertility and mortality. Just like the latter demographic events, migration is not an isolated phenomenon. Migration affects population structures as whole, just as much as migration patterns are influenced by other population characteristics as well as non-demographic features. One can then divide the demographic variables and the non-demographic variables in two sets; dependent variables and independent variables.17 The dependent variables can depending on the context ever be demographic or non-demographic (the demographic composition in a country may for example be dependent on the economic situation just as much as the economic situation may be dependent on the demographic composition). Both the demographic and the non-demographic variables are then consequently also independent variables since they could affect each other. Of course, demographic structures can also be affected by other demographic structures, e.g. if a large number of men immigrate to Sweden, the sex-composition will consequently be affected. The demographic composition of international migrants has therefore vital impacts on the societal structures in both the countries of origin and the host countries. An increased emigration of younger persons in working age from a country may for example create a deficit of manpower in the country of origin. Well in the host country, these younger now immigrants may have easier to integrate because of their young and to the labour market more suitable ages. It may be harder for the older migrants to integrate since these are less likely to get an employment (as will be discussed later, employment prospects is a vital part of a successful integration process).
The sex-composition in the country of origin may be affected negatively if one of the sexes is more likely to emigrate than the other (e.g. males for economic reasons). Not only does this mean less prospects for the females (if males are more likely to emigrate) to meet a spouse and have a family (the fertility will therefore be affected), it will probably also affect the future economic situation in the country of origin since the lower fertility caused by the females` decreased chances to meet a spouse and have children will also affect the future manpower negatively. Also the host country will be affected. Males are more likely to migrate for economic reasons (hence, younger males in general are most likely to migrate) and women (and consequently also children) may tend to migrate more often because of family reasons. 18
16 Knox & Marston, 2004, p. 92 17 Daugherty, 1995, p. 35, 43 18 Jolly & Reeves, 2005, pp. 11-12
The male immigrants may return to their country of origin to bring their family or to marry a woman whom they bring back to the host country. Family reunification may therefore be a more common reason behind the migration of women and children. This is probably also the case with many elderly migrants (they are probably brought to the “new” country by their younger relatives who have already settled down there). As a consequence, the demographic composition in both the country of origin and the host country will change.
3. Migration
As discussed in chapter two, migration is very much a demographic phenomenon. Migration is a major event for the migrants themselves (and for the persons around them, such as
relatives and friends), but also an important variable behind population re-structuring and just as much as an important variable to re-structuring of non-demographic variables, e.g.
economy.
In broad outlines, migration concerns two aspects; space and time. Migration occurs in space, because the route of the migration is between two or more places. The latter aspect (the time aspect) is an important aspect to consider since the migration process that occurs over space also occurs over time.19 Hence, it takes time to transport one self between two destinations, even if the distance between these destinations may be marginal. However, it is thus not the distance between two places that determine migration. Rather, it has to do with the crossing of an administrative politically defined border.20 Hence, to move within the same section of a
city without crossing an administrative border is not a migration, but rather considered as an “intra-urban residential mobility”.21 Nevertheless, it has also to do with the purpose of the movement. The vacation in a distant country is not considered as migration. Neither is the shopping tour to the neighbouring municipality, or the trip to one’s grandmother who lives in the neighbouring country (even if you would stay for a month or longer). If one would move to another country or only to another municipality in the purpose to study a four-year program at a University (which is common in not at least Sweden), this person would be considered as a migrant, although the migration is only temporary.22
To be regarded as a migrant, one must move permanently (or temporarily over a longer period as the case with the students exemplified above) from one administrative unit to another, and depending on which borders this person crosses, there are different definitions of the
migration process.23 First, when migrating from one country to another, the migration process
is defined as international migration. When the international migrants move away from the country of origin, they are defined as emigrants. When they move in to another country (to a receiver country), they are defined as immigrants. The Ethiopian migrants whom are the concern of this essay are clearly international migrants, since their migration occurs over national borders. More particularly, they are emigrants, since they have left Ethiopia, the country of origin. They are also immigrants since they have entered the receiver country (they 19 Boyle, 1998, p. 34 20 Ibid. 21 Ibid., p. 35 22 Ibid. 23 Ibid.
are immigrants in Sweden). Further on, when migration occurs within a country (internal migration) – between different administrative areas, those of the individuals who are leaving an administrative area are defined as out-migrants, while those of the individuals who are entering another administrative area are defined as in-migrants.
4. Integration
As the Swedish Integration Board has pointed out, a country that can successfully integrate her immigrants will have substantial competitive advantages in the global economy.24 Integrated immigrants can be regarded as an abundant supply of labour instead of an
economic burden. Integration can therefore be seen as an important economic tool, but also as an important tool for avoiding outcomes such as social exclusion and further on, xenophobia between the “ethnic” population and the immigrants. The labour market is a key factor for integration. Immigrants’ access to the labour market is of major importance not only for economic reasons and as a “gate” in to the “new” society, but also because a higher employment rate is likely to reduce the tensions between the “ethnic” population and the immigrants.25 It was shown that parties opposing immigration such as Sverigedemokraterna in western Scania, Sweden, have received more votes in municipal election in municipalities where the labour market participation rate among immigrants was low.26,27
In addition, it is said that the public economy would increase with about 40 milliard Swedish kronor per year (which equals about 2 % of Sweden’s GNP) if the labour market participation of the foreign-born population would be as high as that of the ‘native’ population.28 Similar calculations for Denmark and the Netherlands suggests 1 % increase of the GNP in Denmark and about 2 % in Netherlands, when considering their proportions of foreign born.29 However,
the task to increase the foreign born population’s participation in the labour market is not easy as several factors are working against so the tensions between the native population and the foreign born increase because of the latter groups high unemployment rates, which reduce the chances of integration. Also, many foreign born are unemployed for a longer time, making it especially difficult for a person (not only for the foreign born population) to enter or re-enter the labour market.30 The same applies to those with early retirements given the large
proportion of the foreign born population among them.31
4.1. How to define integration
As Hedberg pointed out in her dissertation, integration can be considered as a form of
successful participation in the society of the host country, although the process is also strongly related to the concept of assimilation.32 The integration process tends to “move” the
24 Swedish Integration Board, 2006, s. 11 25 Ekberg, 2006, p. 115 26 Ibid. 27 Widfeldt, 2006, p. 162 28 Ekberg, 2006, p. 113 29 Ibid., p. 114 30 Ibid. 31 Ibid. 32 Hedberg, 2004, pp. 36-38
immigrants closer to the native population, at the same time as the natives are influenced by the “newcomers”. Assimilation is then an outcome of integration. In the light of what have been discussed earlier about the relation between unsuccessful integration of the immigrants and the tensions between them and the “ethnic” population, this tendency can be considered as natural. As the successful integration facilitated by less obstacles for the immigrants to enter the labour market results in less tensions between them and the native population, the immigrants´ chances to become part of the society increase. Assimilation can then be considered as an adaptation towards each other.33 Hence, the “newcomers” and the native population affect each others´ existence – the cultural structures of the “newcomers” affect the cultural structures of the natives, and vice versa.
4.2. Integration in Swedish immigration politics
Integration is considered as an important aspect of immigration politics. Assimilation on the other hand, despite its close relation to integration, is not considered in the Swedish
immigration politics. According to the Swedish Government bill, 1997/98:16, integration is a goal in the Swedish immigration politics but the decision to integrate should be made by the individuals them selves.34 Hence, one can not force a person to integrate. Thus the process can be facilitated by e.g. specific labour market and education policy measures favourable for immigrants.35 This points to the central concern in the Swedish integration politics: to provide
people the conditions to support them selves, to be part of the society and further to prevent discrimination and xenophobia and to protect fundamental democratic values.36
While immigrants and the “new” society will sooner or later adapt to each other, the
individual must be able to keep her/his “original” culture.37 However, as discussed before, the adaptation is mutual between the immigrants and the natives. This applies also to the
assimilation to some degree, if the integration is successful. Otherwise, as discussed earlier, the tensions between the “ethnic” population and the “newcomers” stressed by the
immigrants’ (eventual) low participation on the labour market (which can be seen as a failure of integration) will instead prevent such an adaptation from both sides.
4.3. Early studies about Ethiopian integration in Sweden?
There are relatively few studies on the integration of Ethiopian immigrants, and there is hardly any concerning Sweden. However, the European Monitoring Centre on Racism and Xenophobia (EUMC) does have studies of African immigrants in Sweden (and Ethiopian immigrants belong to the group of African immigrants). African immigrants in Sweden are considered to be a group whose prospects to get a job are particularly weak. In fact, according to a report from EUMC, African immigrants are one of the most discriminated groups on the Swedish labour market.38 African immigrants are also considered to be one of the two most poorly paid migrant groups in Sweden.39 However, their proportion has increased in caring
33 Hedberg, 2004, p. 38
34 Ibid. 35 Ibid. 36 Ibid., p. 24
37 Swedish Government bill 1997/98:16, 1997, p. 23 38 Englund, 2003, p. 4
professions (according to an observation in 1999).40 There are more African women than African men in these professions, even if the men seem to catch up.
In his study about foreign born men’s prospects to optimize their incomes in USA, Chiswick found that 10 to 15 years in employment is needed to their incomes reaching the level of the native born population.41 Their incomes were lower than those of the native born population
at the beginning of their staying in the USA, but increased gradually to even higher level than those of the native born population. Maybe this pattern will apply to Ethiopian immigrants in Sweden in the long run.
5. Ethiopia
Ethiopia, or sometimes called the cradle of humanity, has been a chaotic place for a long time. For centuries, different religious groups have fought for authority and power over the region that nowadays is defined as Ethiopia.42 Even today, religious controversies are evident, but
the country has more problems than so. Wars, persecutions, poverty and famine accompany the at large areas inhabitable natural environment in Ethiopia. Even the demographic characteristics are less favourable with high mortality and high fertility as well as high frequencies of migration.
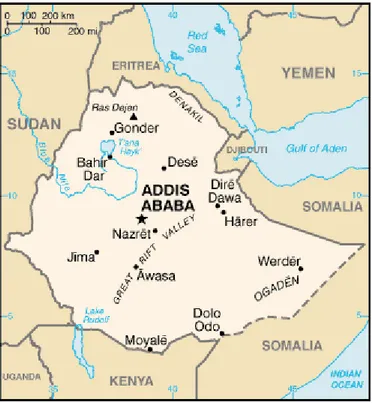
Ethiopia is situated on the Horn of Africa (north-east Africa), surrounded by Somalia, Kenya, Sudan, Eritrea and Djibouti (see figure 1). The country has a population of 77,431,000 people (mid. 2005).43 Ethiopia’s capital, Addis Ababa, is located in the centre of the country (see
figure 1). The population will increase by 120 % between 2005 and 2050 according to the
Population Reference Bureau (PRB) despite of a mortality rate of 16 per thousand, an infant mortality rate of 100 per thousand live births and a life expectancy at birth of 48 years.44 Even if the economic standard improved slightly, Ethiopia is still one of the poorest countries in the world, with as much as 23 % of the population living on less than $1 per day.45 With its high birthrate, Ethiopia is considered to be in the first phase of the age transition with an
unfavourable dependency ratio given the large number of children who need to be cared for both economically and socially.46 Ethiopia is in the first phase of the demographic transition, given the high level of mortality as well as high level of fertility (although, there may be some fluctuations).47,48
40 Englund, 2003, p. 22
41 Chiswick, 1978, p. 897 42 Daleke, 2003, p. 13
43 Population Reference Bureau, 2006-04-25,
http://www.prb.org/TemplateTop.cfm?Section=PRB_Country_Profiles&template=/customsource/countryprofile/ countryprofiledisplay.cfm&Country=310
44 Ibid.
45 United Nations Statistical Division, 2006-05-01,
http://unstats.un.org/unsd/mi/mi_results.asp?crID=231&fID=r15
46 The age transition model seeks to explain the changes in the age-composition resulted by the demographic
transition (Malmberg & Lindh, 2004, p. 9) explained under footnote 48
47 Bengtsson & Ohlsson, 1994, p. 17
48 The demographic transition theory seeks to explain the changes in mortality and fertility from a high to a very
Figure 1. Map over Ethiopia (2005).
Source: University of Texas Libraries, The University of Texas at Austin, 2006-04-25,
http://www.lib.utexas.edu/maps/cia05/ethiopia_sm05.gif
Beside poverty, there are further typical characteristics of a country being in the first phase of the age-transition49 and Ethiopia fulfils them all. All the characteristics correlate with each other. One such feature is the need of economic assistance from other countries.50 Ethiopia is here of major dependence of foreign economic aid (for instance, 18.7 % of Ethiopia’s GNP in 1994 was consisted of aid).51 Also, the country has to import much more goods (not at least food) from other countries than they export to (mainly coffee).52 The domestic production above the need of one’s own household is marginal.53 A third feature is the high level of child labour,54 very common in Ethiopia, with about 85% of children aged 5-17 years working (2001), although the study where this data is found doesn’t consider all types of paid labour (so it can be an even higher level).55 The fourth characteristic is a high exploitation of natural
resources.56 Because of the high birth rate in Ethiopia and because of agriculture is a common way to support one self in Ethiopia, the exploitation of the land and soil (including forest) is substantial.57 And given the country’s fast population growth, and not least the returning migrants, this exploitation could be an even more alarming reality in the future.58 One must also consider Ethiopia’s, in some areas extremely dry climate which affects the land-quality
49 Malmberg & Sommestad, 2000, s. 136 50 Ibid., s. 138
51 Christian Aid, 2006-07-04,
http://www.christianaid.org.uk/indepth/9901ethi/ethiopi2.htm#Trends%20in%20aid%201991-1996
52 Daleke, 2003, s. 24 53 Ibid.
54 Malmberg & Sommestad, 2000, s. 136
55 ILO, 2006-05-01, http://www.ilo.org/public/english/standards/ipec/simpoc/national/index.htm#ethiopia, s. 1 56 Malmberg & Sommestad, 2000, s. 137
57 Daleke, 2003, pp. 25-26 58 Ibid.
and further reducing the cultivated land area.59 There are even more factors behind the diminution of cultivated land, such as impoverishment of the soil given the war and other disturbances and a shortage of technological means.
5.1. An overview of Ethiopia’s history of modern time
Ethiopia’s present territorial structure is very much a creation that took place under the command of Menelik II, 1889-1913.60 By the time, this spatial expansion (or in other words conquests) resulted in fragmentation of several ethnic groups, such as the Oromo people (sometimes called “Galla”) who nowadays constitutes between 40-50 % of Ethiopia’s population.61, 62 In 1936, Ethiopia was invaded by Italy. Ethiopia, by the time ruled by Haile Selassie, the grandson of Menelik II, became united with Eritrea and Somaliland.63 Italian East Africa was now a reality. In 1941, Ethiopia was liberated by the British troops, who also reinstalled Haile Selassie as Ethiopia’s ruler and re-established the borders as they were before the Italian invasion (thus with some disagreement from the Ethiopians).64 After just four years, Eritrea became a self-governing state, although in federation with Ethiopia. Ethiopia’s disagreement in “letting” Eritrea become an autonomous state resulted in an annexing of the former Ethiopian “province”. Eritrea answered with a long lasting war for their independence, and in 1991 Eritrea finally prevailed.65
In 1974, Haile Selassie and his non-democratic government were removed from the power.66 The military (the Dergue) took the power, ruling undemocratically like the former
government but with a Socialistic overtone. This was the starting point of The Ethiopian revolution. Different blocks appeared (not to mention the people’s resistance) with different views on how the country should be ruled, even in the Dergue itself. After a short while of violent raids, colonel Mengistu took the power, and ten years later Mengistu became Ethiopia’s President with a new parliament under his command. Mengistu’s “Red terror”, a sort of mass persecution and mass murder of those who disagreed with his politics, forced hundreds of thousands of Ethiopians to flee to Europe and the United States, thereof many academics.67 However, further disagreements occurred within Mengistu’s regime. As the
support from the Soviet Union stopped and given the hard resistance from Eritrean (and Ethiopian) liberation fronts in north Ethiopia, Mengistus and his military regime capitulated in 1991.68 Just a few days later and in accordance with Eritrea’s independence, the Ethiopian People's Revolutionary Democratic Front (EPRDF) occupied Addis Ababa. With support from USA, Ethiopia nowadays seems to be more of a democratic state, but the country still has a long way to go, especially because of its substantial population- and economical
problems. There have also been numbers of conflicts in the internal political system as well as conflicts in different regions, thereof some border issues.69
59 Daleke, 2003, s. 25 60 Ibid., p. 13 61 Ibid. 62 Bulcha, 2002, pp. 11-12 63 Daleke, 2003, p. 13 64 Ibid. 65 Ibid., pp. 13-14 66 Ibid., p. 14 67 Ibid. 68 2006-04-29, Nationalencyklopedin http://www.ne.se/jsp/search/article.jsp?i_art_id=164954 69 Daleke, 2003, pp. 16-17
With this historical background in mind, one may notice similarities between the European colonist countries and Ethiopia given its former conquest and exploitation of territory and of “other” people.70 In fact, Menelik II even asked for and received technical help (e.g. weapons) from Europe in his conquests.71 Ethiopia, just like many other developing countries has had large flows of refugees, given regular disturbances caused by power struggles (e.g. the Abyssinian Kingdom and later on Mengistu’s regime).
5.2. Ethiopian migration – Main trends and Causes
As mentioned, the region of nowadays Ethiopia has a long history of population movements within and across borders oftentimes caused by political disturbances. Hence, the major migration streams in the country throughout modern history have been those of forced migration of large mass of people. These have been periodical as the situation changed sometimes radically, over time. The cradle of humanity deserves then to be analyzed with other eyes than just those of the “adventure-seeking” archaeologists.
As discussed earlier, the conquests of Menelik II (1889-1913) resulted in fragmentation of several ethnic groups, such as the Oromo people who fought for their “freedom” and right to their land, although unsuccessfully as Menelik II remained in power given superiority of his troops and weapons.72 Therefore many “Oromos” were forced to flee abroad or were
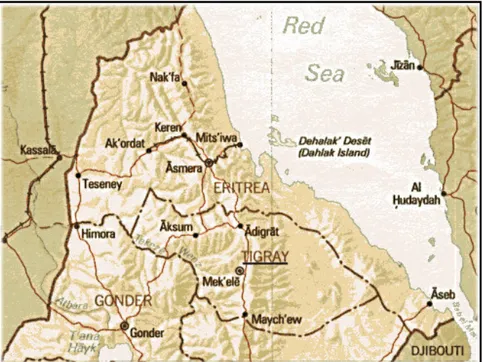
displaced within the country.73 However, the resistance of the Oromo people as well as from other ethnic groups in the area who were threatened by the superior power (which later on was under the command of Haile Selassie), continued late in to the 20s century. Mass flights became common because of the Ethiopian government’s tough raids.74 However, fights between different groups in the outskirts of Ethiopia also occurred, as the formation of the Abyssinian Kingdom re-structured the “political map” of the region.75 In 1975, mass flights from the Tigray “province” (located in North Ethiopia on the border to Eritrea, see figure 2) were caused by famine and conflicts between the newborn Tigray Liberation Front (TPLF) and the Dergue.76
70 Bulcha, 2002, p. 25 71 Bulcha, 1987, p. 22 72 Ibid., p. 23 73 Ibid., pp. 23-24 74 Ibid., p. 24 75 Ibid., p. 25 76 Ibid.
Figure 2. Map over North Ethiopia (1999), the Tigray province is underlined.
Source: University of Texas Libraries, The University of Texas at Austin, 2006-05-03,
http://www.lib.utexas.edu/maps/africa/ethiopia_pol99.jpg
Note: The map is edited in order to fit the context: I have reduced the original map to just include the North part
of Ethiopia and I have also underlined “TIGRAY”
In 1984, the famine intensified, mainly in North Ethiopia, causing the loss of about one million people.77 The high death rates of the famine were partly linked to politics, as the
Ethiopian government did not allow aid to regions occupied by opposition groups, among others in North Ethiopia.78 In only one year, 300.000 were forced to flee to Sudan, according to UNHCR (while others claimed that these were not refugees, but fled because of famine). The “Red terror” was the main reason of mass flights from Ethiopia to Europe and the USA. Hundreds of thousands of mainly young well educated Ethiopians fled Mengistu’s
persecutions as they were the base of the political resistance against Mengistu.79 Many of them were murdered by the regime. Also, Eritrea’s independence in 1991 had consequences on the statistics of international migrants from Ethiopia, as those from Eritrea were no longer categorised as Ethiopian migrants.
6. Ethiopian immigration to Sweden
In this chapter I explore the demographic composition of Ethiopian immigrants to Sweden between 1985 and 2000 after a brief overview of their total amount and distribution by sex.80,
81 A total of 13 001 persons have been registered in Louise database as Ethiopian immigrants
77 UNHCR, 2000, p. 113
78 Ibid., p. 114 79 Daleke, 2003, p. 14
80 An Ethiopian immigrant is here a person whose birth country is Ethiopia, and who immigrated to Sweden. 81 Note that the data in this chapter do not distinguish between Ethiopian and Eritrean immigrants up to 1991
to Sweden until 2000 (appendix 1).82 The distribution by sex is skewed: 54.3 % males against 45.7 % females (appendix 1). 2928 of these individuals were registered with no particular year of immigration stated (appendix 1). The earliest registered year of immigration for these immigrants in Louise database is 1937. Excluding those with year of immigration missing, we have a group of 10 073 individuals (appendix 2).83 Based on their year of immigration minus the year of birth (which I use when calculate their age), the average age is approximately 25 (appendix 2).84 The distribution by sex is skewed even for this smaller group: 54.2 % males against 45.8 % females (appendix 2), although the difference diminished slightly.
In 1989, the Ethiopian immigration to Sweden had reached its highest levels, when 12.9 % of the total number of Ethiopian immigrants came (appendix 2). The other peak was in 1991 with 12.4 % followed by a dramatic decline of Ethiopian immigration to Sweden, which showed the same speed as the increase between 1985 and 1989. In 1995 the rate of Ethiopian immigration to Sweden had stabilized at the level it was before 1985.
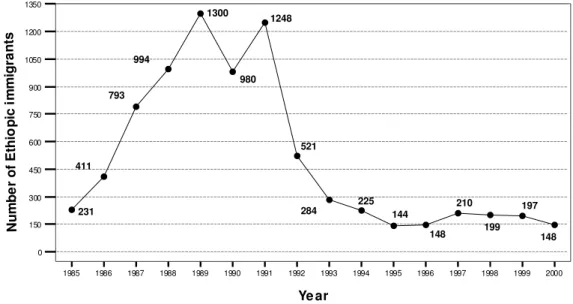
As figure 3 illustrates, the number of Ethiopian immigrants to Sweden between 1985 and 2000 increased greatly in the beginning of the period and declined just as rapidly thereafter.
1985 1986 1987 1988 1989 1990 1991 1992 1993 1994 1995 1996 1997 1998 1999 2000 Ye ar 0 150 300 450 600 750 900 1050 1200 1350 N u m b e r o f E th io p ic i m m ig ra n ts W W W W W W W W W W W W W W W W 231 411 793 994 1300 980 1248 521 284 225 144 148 210 199 197 148
Figure 3. The number of Ethiopian immigrants to Sweden during 1985-2000.
Source: Louise database
Note: The data do not distinguish between Ethiopian and Eritrean immigrants up to 1991 when Eritrea became
an independent state. For the period thereafter only Ethiopian immigrants are included
Between 1985 and 2000, 8033 Ethiopians immigrated to Sweden (appendix 3).85 In 1985, 231 Ethiopians came to Sweden, but their number increased greatly during the following years and by 1989, the peak year of Ethiopian immigration to Sweden, it reached 1300. In 1990 the number of Ethiopian immigrants declined to 980, but increased to 1248 in 1991, when Eritrea
82 Louise data-base, 1990-2000 83 Ibid.
84 We do not have precise information on ‘age’, except for how old the immigrant was at the year of
immigration. The exact date of birth is not recorded in the database.
became independent, and Eritreans were not counted as Ethiopians in the immigration
statistics anymore. In the following years until 1994, the number of Ethiopians immigrating to Sweden decreased with a magnitude similar to that of the increase between 1985 and 1989. In 1995 only 144 Ethiopians immigrated to Sweden and beside some small fluctuations this level was kept through the rest of the period.
6.1. Age and sex-composition of Ethiopian immigrants to Sweden
during 1985-2000
The mean age of Ethiopian immigrants in the period was approximately 27 years, although the largest proportional age-group consisted of persons between 22 and 23 years of age (appendix 2).86 The youngest Ethiopian who immigrated to Sweden during this period was 11 years old, and the oldest was 80 years old. The sex composition of those who immigrated between 1985 and 2000 is skewed, as men are in majority: 53.7 % versus 46.3% women (appendix 4).
When considering the sex composition for each year in the period, the age and
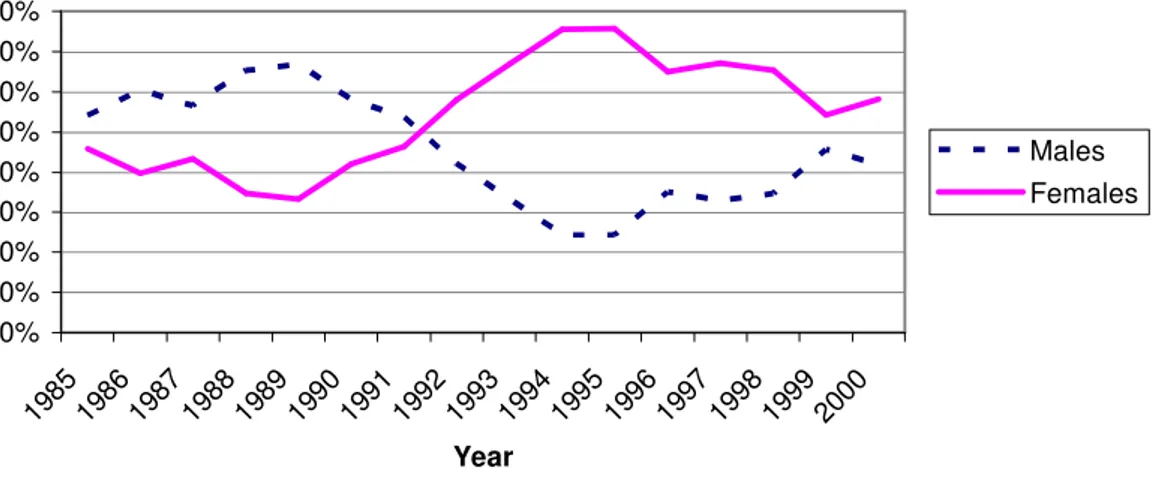
sex-composition seems to vary (appendix 4). As figure 4 illustrates, males are clearly in majority until 1991. In 1992, this changes and women become the dominant group. Especially in 1994 and 1995 the female dominance over the males is striking. As the diagram illustrates, the proportion of females started to increase as early as in 1989. There is a general decline in Ethiopian immigration to Sweden after 1991, but Ethiopian women were more likely to immigrate than Ethiopian men from this year onwards as shown in the periodical sex
composition. One must remember that the number of Ethiopians immigrating to Sweden fell rapidly between 1992 and 1994 and remained low thereafter. The large proportion of females after 1991 may depend on family reunification – after some years in Sweden the men may have brought their families or may have went back to Ethiopia to find a spouse whom they brought to Sweden. 0% 10% 20% 30% 40% 50% 60% 70% 80% 1985198619871988198919901991199219931994199519961997199819992000 Year Males Females
Figure 4. Proportion of males and females of Ethiopian immigrants to Sweden, 1985-2000.
Source: Louise database
Note: The data do not distinguish between Ethiopian and Eritrean immigrants up to 1991 when Eritrea became
an independent state. For the period thereafter only Ethiopian immigrants are included
86 Louise database, 1990-2000
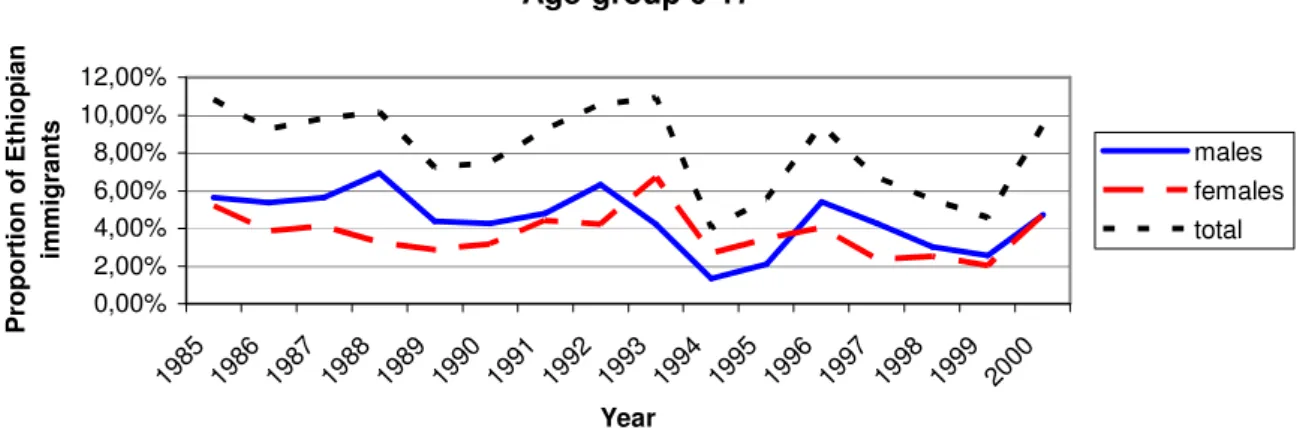
When considering the periodic sex-composition for specific age-groups such as children (0-17 years), young adults (18-29), adults (30-44), middle-age adults (45-59) and the elderly (60+), the pattern appears to be different (see figures 5-9 and for further details see appendix 4). As illustrated in figure 5, the proportion of males in age-group 0-17 is somewhat larger than the proportion of females until 1992. Even if the proportion of females seems to follow that of the males during the whole period, their proportion is somewhat larger than the males between 1993 and 1995. After 1995, the proportion of males is becoming larger than that of the females again. In the two last years of the period, the sex-composition seems to be relatively equal. One must keep in mind, however, that the proportion of this age-group is small (around or below 10 %) throughout the period.
Age-group 0-17 0,00% 2,00% 4,00% 6,00% 8,00% 10,00% 12,00% 1985 1986 1987 1988 1989 1990 1991 1992 1993 1994 1995 1996 1997 1998 1999 2000 Year P ro p o rt io n o f E th io p ia n im m ig ra n ts males females total
Figure 5. Proportion of Ethiopian immigrants aged 0-17 years during 1985-2000. Source: Louise database
Note: The data do not distinguish between Ethiopian and Eritrean immigrants up to 1991 when Eritrea became
an independent state. For the period thereafter only Ethiopian immigrants are included
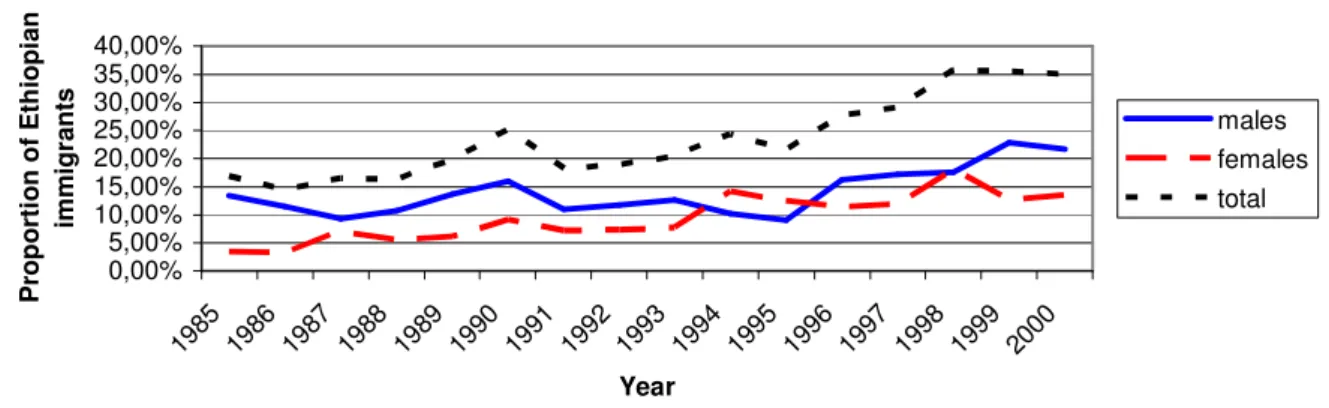
In age-group 18-29 (figure 6) the proportional composition seems to equal the sex-composition for each year without considering age (as illustrated in figure 4). The males are clearly in majority until 1991 and in the following years the females dominate. In 1989 (the peak of Ethiopian immigration to Sweden), the proportion of males is largest. In 1995 however, when the level of Ethiopian immigrants stabilized at the same low level as in the mid-1980s, the proportion of females peaked. The proportion of this age-group within the total is decreasing somewhat throughout the period, but as the figure illustrates it remains high. In fact, this age-group is the largest one in the whole period. The overall proportion of group 30-44 (figure 7) increased over time. This is the second largest group after age-group 18-29. The proportions of males and females are fluctuating but the proportion of males is somewhat larger than that of females through almost the whole period.
Age-group 18-29 0,00% 20,00% 40,00% 60,00% 80,00% 1 9 8 5 1 9 8 6 1 9 8 7 1 9 8 8 1 9 8 9 1 9 9 0 1 9 9 1 1 9 9 2 1 9 9 3 1 9 9 4 1 9 9 5 1 9 9 6 1 9 9 7 1 9 9 8 1 9 9 9 2 0 0 0 Year P ro p o rt io n o f E th io p ia n im m ig ra n ts males females total
Figure 6. Proportion of Ethiopian immigrants aged 18-29 years during 1985-2000.
Source: Louise database
Note: The data do not distinguish between Ethiopian and Eritrean immigrants up to 1991 when Eritrea became
an independent state. For the period thereafter only Ethiopian immigrants are included
Age-group 30-44 0,00% 5,00% 10,00% 15,00% 20,00% 25,00% 30,00% 35,00% 40,00% 1985 1986 1987 1988 1989 1990 1991 1992 1993 1994 1995 1996 1997 1998 1999 2000 Year P ro p o rt io n o f E th io p ia n im m ig ra n ts males females total
Figure 7. Proportion of Ethiopian immigrants aged 30-44 years during 1985-2000
Source: Louise database
Note: The data do not distinguish between Ethiopian and Eritrean immigrants up to 1991 when Eritrea became
an independent state. For the period thereafter only Ethiopian immigrants are included
The proportion aged 45-59 years is fluctuating over time and so does the sex-composition of this age-group (figure 8). The peak year was in 1994, but in the end of the period the
proportional size of this group is growing again. The peak year of the age-group 60 and above was in 1995 (figure 9), when it became even larger than the 45-59 age-group but declined thereafter showing a slight increase at the end of the period. Its proportion of males and females seems to follow its general age-proportional pattern, although the females are in majority for almost the whole period (especially during its peak-years). Age-groups 45-59 and 60+ are the smallest groups throughout the period. Even at its highest level only 5.3 % of Ethiopian immigrants belonged to the 45-59 group. Age-group 60+ was the smallest age-group trough the whole period, except for the years between (approximately) 1992 and 1996 which may have been linked to family reunification when young Ethiopian males may have brought their elderly relatives, especially mothers to Sweden (the proportion of females were much higher than that of the males during these years). In 1995, the peak year of this age group, 6,9 % of Ethiopian immigrants were 60 years of age or above.
Age-group 45-59 0,00% 1,00% 2,00% 3,00% 4,00% 5,00% 6,00% 1985 1986 1987 1988 1989 1990 1991 1992 1993 1994 1995 1996 1997 1998 1999 2000 Year P ro p o rt io n o f E th io p ia n im m ig ra n ts males females total
Figure 8. Proportion of Ethiopian immigrants aged 45-59 years during 1985-2000.
Source: Louise database
Note: The data do not distinguish between Ethiopian and Eritrean immigrants up to 1991 when Eritrea became
an independent state. For the period thereafter only Ethiopian immigrants are included
Age-group 60+ 0,00% 2,00% 4,00% 6,00% 8,00% 1985 198619871988 1989 1990 1991 1992 1993 1994 19951996 1997 1998 1999 2000 Year P ro p o rt io n o f E th io p ia n im m ig ra n ts males females total
Figure 9. Proportion of Ethiopian immigrants aged 60 years and older during 1985-2000.
Source: Louise database
Note: The data do not distinguish between Ethiopian and Eritrean immigrants up to 1991 when Eritrea became
an independent state. For the period thereafter only Ethiopian immigrants are included
6.2. Summary
Based on the analyses above, we can summarize the characteristics of Ethiopian immigration to Sweden in terms of the age and sex composition between 1985 and 2000.
1. The number of Ethiopian immigrants increased dramatically between 1985 and 1989 and remained high even in 1991. In the following years Ethiopian immigration declined just as rapidly as it increased in the late 1980s, and by 1995, the level stabilized at approximately the same level as in the period before 1985.
2. Young Ethiopian adults (aged 18-29 years) were most likely to immigrate compared to the other age-groups throughout the period.
3. The sex-composition varied over time. There were more men than women coming to Sweden during 1985 to 1991. In the period thereafter, however, females were in majority. In fact, the proportion of females has been growing considerably in proportion to the males from the end of 1989. Considering the sex-composition for each age-groups and year of
immigration, this picture applies only to the young adults. In the 30-44 year age-group the proportion of males and females seems to fluctuate. The proportional size of this age-group is growing throughout the period, while the 18-29 year age-group is decreasing in size.
Furthermore, it seems as the older age-groups (those 30 and above) are growing throughout the period. Even if age-group 18-29 is decreasing proportionally, this age-group remains the largest one throughout the period.
7. Integration of Ethiopian immigrants in Sweden,
1990-2000
In order to analyse the integration of Ethiopian immigrants during the period between 1990 and 2000, I have compared the frequency of Ethiopian immigrants with no employment with that of the working aged population in Sweden. The calculations are based on Ethiopian immigrants between 18 and 64 years of age who immigrated to Sweden in 1990 and stayed until 2000 (it is not taken into account what happened after the year 2000 given data limitation) in relation to the overall working aged population in Sweden the same years.87 Those who earned less than 100 Swedish kronor per year are here considered as persons with no employment (100 Swedish kronor is the limit for what an employer in Sweden must declare in the employer’s declaration). In Louise database, this variable is named “loneink”, which means the salary from an employer, and is measured per year. Even the income of self employed persons is considered here. Furthermore, a person without employment is either unemployed or for some reason does not have an employment (e.g. being a student or housewife). In the latter cases, the situation is not necessarily negative unlike that of the unemployed. In future studies, it will be interesting to also consider the age-composition in relation to these aspects of integration, as there may be variations across age-groups. Later on I also analyse the prospects of Ethiopian immigrants (as described above) to optimize their incomes in Sweden, although this aspect is only studied in relation to the working aged population’s general incomes during the period between 1992 and 2000.
7.1. Employment of Ethiopian immigrants
Employment is an important aspect of the integration into the local society. Here I will investigate the frequency of Ethiopian immigrants without employment in working ages (between 18 and 64 years of age) in Sweden during the period 1990-2000 (considering those of the immigrants who arrived to Sweden in 1990 and stayed until 2000).
87 Note that the data in this chapter do not distinguish between Ethiopian and Eritrean immigrants up to 1991
The numbers of Ethiopians aged 18-64 years who immigrated in 1990 and stayed throughout the whole period (until 2000) was 782 or 18.2 % of all Ethiopians who immigrated to Sweden during this period (a total of 4304 Ethiopians immigrated to Sweden during 1990-2000).88 The corresponding sex-composition was 446 males against 336 females (appendix 5).
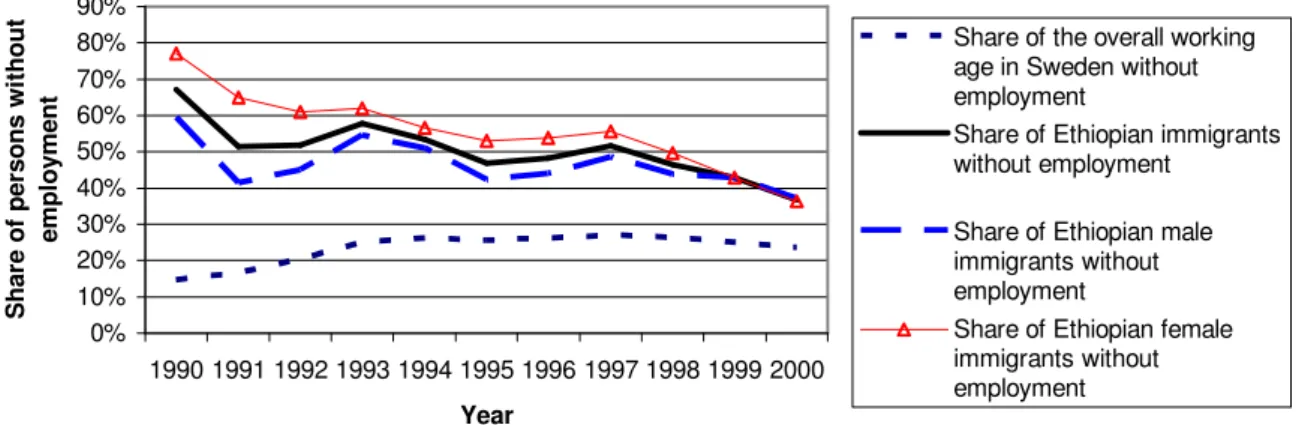
As illustrated in figure 11, the proportion of Ethiopian immigrants without employment seems to decrease throughout the period. In fact, this rate is decreasing faster then for the working aged population in Sweden. In 1990, 67.1 % of the Ethiopian immigrants had no employment (the corresponding rate for the overall working aged population in Sweden was 14.6 %).89 In 1995, this rate corresponded to 46.9 % (as compared to 25.7% for the overall working aged population in Sweden that increased considerably since 1990) and in 2000 the rate of
Ethiopian immigrants with no employment was 36.8 % (the corresponding rate for the overall working aged population in Sweden was 23.7 %). The share of Ethiopian female immigrants without employment seems to have decreased faster than the share of Ethiopian male
immigrants during the period. Between 1990 and 2000, the share of Ethiopian female immigrants without employment decreased by 40.8 percentages whiles the corresponding change for the Ethiopian male immigrants was 22.2 percentages.
0% 10% 20% 30% 40% 50% 60% 70% 80% 90% 1990 1991 1992 1993 1994 1995 1996 1997 1998 1999 2000 Year S h a re o f p e rs o n s w it h o u t e m p lo y m e n t
Share of the overall working age in Sweden without employment
Share of Ethiopian immigrants without employment
Share of Ethiopian male immigrants without employment
Share of Ethiopian female immigrants without employment
Figure 10. Proportion of Ethiopian immigrants without employment aged 18 and 64 years, for Ethiopian immigrants who arrived in 1990 and stayed until 2000 against the overall working aged population in Sweden with no employment.
Source: Louise database
Note: The data do not distinguish between Ethiopian and Eritrean immigrants up to 1991 when Eritrea became
an independent state. For the period thereafter only Ethiopian immigrants are included
However, to give a more realistic picture of Ethiopian immigrants outside the labour market, I have also compared those with a yearly income up to 5000 Swedish kronor with the overall working aged population in Sweden without employment. 5000 Swedish kronor per year are far below the cost of living in Sweden, and I therefore think that this limit is a better criterion for a person with no income. When considering those Ethiopian immigrants who had no income or a yearly income of up to 5000 Swedish kronor (appendix 5), the picture is changing somewhat (figure 12). As expected, the overall structure is the same, only that the number of
88 Louise database, 1990-2000
89 Statistics Sweden, 2006-05-30, http://www.scb.se/templates/Amnesomrade____1885.asp, under:
”Statistikdatabasen” and then ”Befolkningen 16-64 år (AKU) efter kön, ålder och arbetskraftstillhörighet. År 1976-2004”). In order to make this data comparable with the data of the Ethiopian immigrants, I have limited this data to ages 18-64 between the years of 1990 and 2000.
individuals with the new criteria is somewhat higher than by the former criteria. The sex-specific periodical change corresponds to the former; the decrease was largest for the females.
0% 10% 20% 30% 40% 50% 60% 70% 80% 90% 1990 1992 1994 1996 1998 2000 Year S h a re o f p e rs o n s w it h o u t e m p lo y m e n t (E th io p ia n im m ig ra n ts u n d e r 5 0 0 1 S w e . k ro n o r/ y e a r Share of Ethiopian immigrants under 5001 Swedish kronor per year Share of Ethiopian male immigrants under 5001 Swedish kronor per year Share of Ethiopian female immigrants under 5001 Swedish kronor per year Share of the overall working age in Sweden without employment
Figure 11. Proportion of Ethiopian immigrants between 18 and 64 years with a yearly income of up to 5000 Swedish kronor that arrived in 1990 and stayed until 2000 against the overall working aged population with no employment.
Source: Louise database
Note: The data do not distinguish between Ethiopian and Eritrean immigrants up to 1991 when Eritrea became
an independent state. For the period thereafter only Ethiopian immigrants are included
7.2. Income prospects among Ethiopian immigrants between 18 and
64 years of age who arrived to Sweden in 1990 and stayed until
2000
Table 1 gives an overview of the yearly average gross income of the overall working aged population (18-64 years of age) in Sweden between 1992 and 2000.
Table 1. Gross income (in Swedish kronor) of the overall working aged population in Sweden, 1992-2000. 90
Year Yearly gross income
1992 176 400 1993 178 800 1994 187 200 1995 192 000 1996 204 000 1997 214 800 1998 223 200 1999 232 800 2000 243 600
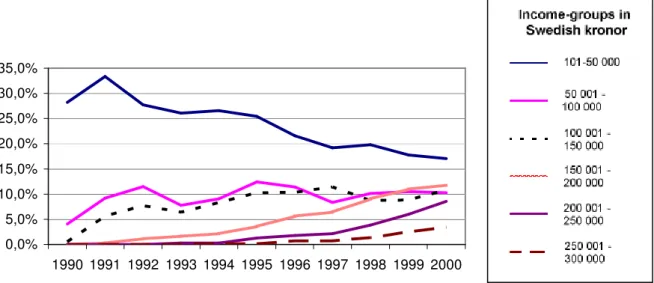
As figure 12 illustrates, the proportion of Ethiopian immigrants with an income between 150 000 and 200 000 Swedish kronor per year increased somewhat over the period, similarly to those with an income between 200 000 and 250 000 Swedish kronor (the latter group’s
increase started somewhat later, in 1993).91 The proportion of those with a yearly income between 101 and 50 000 Swedish kronor decreased from 28.3 % in 1990 to 17 % in 2000 (this group was thus larger in 1991) while the proportion with a yearly income between 50 000 and 100 000 and those with an income between 100 000 and 150 000 also increased somewhat over the period (although there were much fluctuations for the former income group). The group of those with the highest income, i.e. 250 000 to 300 000 per year, also showed a slight increase, but only from the year of 1994.
0,0% 5,0% 10,0% 15,0% 20,0% 25,0% 30,0% 35,0% 1990 1991 1992 1993 1994 1995 1996 1997 1998 1999 2000
Figure 12. The changes in incomes among Ethiopian immigrants between 18 and 64 years of age who arrived to Sweden in 1990 and stayed until 2000 (the lines in this diagram follows the same order of precedence as the explanation to the right).
Source: Louise database
Note: The data do not distinguish between Ethiopian and Eritrean immigrants up to 1991 when Eritrea became
an independent state. For the period thereafter only Ethiopian immigrants are included.
Even if the Ethiopian immigrants’ incomes have improved somewhat throughout the period, their incomes are far below those of the overall working aged population in Sweden. Figure 13 illustrates the average incomes for the Ethiopian immigrants during the period. The overall picture is that the higher income class the lower the share of immigrants. At the time of arrival (in 1990), the average income per year was 8242 Swedish kronor for these immigrants. In 1991 their average income increased to 20 441 Swedish kronor, and in 1992 to 24 707 Swedish kronor when the mean income for the overall working aged population in Sweden was 176 400 Swedish kronor (see table 1).92 In 1993, the average income for these immigrants decreased to 22 087 Swedish kronor, while that for the overall working aged population increased to 178 800 Swedish kronor. Thereafter, the yearly incomes of the Ethiopian
immigrants increased in the rest of the period. The increase was proportionally the same as for the overall working aged population in Sweden. But the large gap remained throughout the period, illustrated in figure 13 below. In 2000, the Ethiopian immigrants’ average income were 78 573 Swedish kronor, which is less than 1/3 of the average income of the overall working aged population in Sweden that year.
91 Louise database, 1990-2000
0 50000 100000 150000 200000 250000 300000 1990 1991 1992 1993 1994 1995 1996 1997 1998 1999 2000 Year A v e ra g e i n c o m e s p e r y e a r Working aged Ethiopian immigrants Working aged population in Sweden
Figure 13. The changes in incomes among Ethiopian immigrants between 18 and 64 years of age who arrived to Sweden in 1990 and stayed until 2000 in relation to the average incomes of the over working aged population in Sweden.
Source: Louise database
Note: The data do not distinguish between Ethiopia and Eritrean immigrants up to 1991 when Eritrea became an
independent state. For the period thereafter only Ethiopian immigrants are included.
7.3. Sex-specific changes in incomes among Ethiopian immigrants
between 18 and 64 years of age who arrived to Sweden in 1990 and
stayed until 2000
The incomes are somewhat higher for the males than for the females during the whole period (figure 14). In 1990, the incomes of the working aged female Ethiopian immigrants
corresponded to 52.5 % of those of the males (appendix 5).93 In 2000, the sex-specific pattern
became more equal, when the incomes of the females corresponded to 77.7 % of the male incomes. The reasons for the females’ greater income-improvements may depend on their in general larger participation in caring professions.
0 10000 20000 30000 40000 50000 60000 70000 80000 90000 100000 1990 1991 1992 1993 1994 1995 1996 1997 1998 1999 2000 A v e ra g e i n c o m e s p e r y e a r Working aged Ethiopian immigrants Whereof males Whereof females
Figure 14. The changes in average incomes among Ethiopian immigrants between 20 and 64 years of age (by all Ethiopian immigrants, males and females) who arrived to Sweden in 1990 and stayed until 2000
Source: Louise database
93 Louise database, 1990-2000