J
Ö N K Ö P I N GI
N T E R N A T I O N A LB
U S I N E S SS
C H O O LJÖNKÖPING UNIVERSITY
I n t r a - I n d u s t r y Tr a d e b e t w e e n
S w e d e n a n d E U 1 5
A Study of the Forest, Metal, and Machinery Industries
Master Thesis within Economics Author: Matilda Gustafsson Tutors: Prof. Börje Johansson
PhD candidate Desirée Nilsson Jönköping May 2005
Master’s Thesis in Economics
Title: Intra-industry Trade between Sweden and EU 15
Author: Matilda Gustafsson
Tutors: Börje Johansson
Désirée Nilsson
Date: May 2005
Subject terms: Intra-industry trade, EU 15, Grubel-Lloyd index
Abstract
The purpose of this thesis is to analyse the pattern of intra-industry trade (IIT) between Sweden and EU 15 during the time period 1980-2002. Focus is put on the Swedish manu-facturing industry, which has been divided into the forest, metal and machinery industries. With help of the Grubel-Lloyd index, values have been calculated in order to measure the size of IIT with the other Member States and in product groups.
Theories about two-way trade argue that countries with similar characteristics have more IIT. The results from the empirical findings show that the Swedish IIT is higher with nearby countries such as Denmark, Finland and Germany. Similar for these countries are the factor endowments, GDP per capita, culture, language, and the closeness to Sweden. The forest industry has more net trade than IIT. In the metal and machinery industries, the IIT is as large as the net trade. Regarding two-way trade within product groups, the analysis proved that products which can be differentiated into more sub-groups have more IIT. A large part of the products have higher net trade than IIT.
Magisteruppsats inom Nationalekonomi
Titel: Intra-industry Trade between Sweden and EU 15 Författare: Matilda Gustafsson
Handledare: Börje Johansson Désirée Nilsson
Datum: Maj 2005
Ämnesord: Tvåvägshandel, EU 15, Grubel-Lloyd index
Sammanfattning
Syftet med denna uppsats är att analysera tvåvägshandeln mellan Sverige och EU 15 mellan åren 1980-2002. Analysen studerar tillverkningsindustrin, vilken har delats in i skog-, metal-, och maskin- industrier. Värden har räknats fram med hjälp av Grubel-Lloyd indexetmetal-, som mäter tvåvägshandeln mellan Sverige och de andra medlemsstaterna samt tvåvägshandeln mellan specifika varugrupper.
Teorierna om tvåvägshandel säger att länder med liknande egenskaper har mer tvåvägshan-del. Resultaten från den empiriska studien visar att den svenska tvåvägshandeln är hög med närliggande länder så som Danmark, Finland och Tyskland. Gemensamt för dessa länder är att de har liknade uppsättning av produktionsfaktorer, BNP per capita, kultur, språk och att de ligger nära Sverige. Skogsindustrin har mer envägshandel än tvåvägshandel. I metall- och maskinindustrierna är tvävägshandeln och envägshandeln ungefär lika stora. Gällande två-vägshandeln mellan varugrupper visar de empiriska resultaten att produkter som är mer dif-ferentierade har större andel tvåvägshandel. En stor andel av produkterna har mer envägs-handel än tvåvägsenvägs-handel.
Table of Contents
1
Introduction ... 1
1.1 Purpose ...1 1.2 Earlier Research...2 1.3 Outline ...22
Intra-industry Trade ... 3
2.1 Theories of Intra-industry Trade ...3
2.1.1 Intra-industry Trade under Different Market Structures ...3
2.1.2 Economies of Scale and Product Differentiation ...4
2.2 Determinants of Intra-industry Trade ...5
2.3 The Grubel-Lloyd Index ...5
2.4 Summary ...6
3
Empirical Study of the Swedish Intra-industry Trade... 8
3.1 Data and Methodology ...8
3.2 The Forest, Metal and Machinery Industries ...9
3.3 Empirical Findings and Analysis ...10
3.3.1 Intra-industry Trade Between Sweden and the Member States ...10
3.3.2 Intra-industry Trade Within the Product Groups ...13
4
Conclusions and Suggestion to Further Research ... 16
References... 17
Appendix A ... 19
Appendix B ... 22
Appendix C ... 23
Appendix D ... 24
Appendix E ... 25
Tables and Figures
Tables
Table 2.1 A summary of the factors affecting IIT...7
Table 3.1 A statistical summary of the Grubel-Lloyd measures ...13
Table 3.2 Product groups with high or low IIT within the forest industry...13
Table 3.3 Product groups with high or low IIT within the metal industry...14
Table 3.4 Product groups with high or low IIT within the machinery industry ...15
Figures
Figure 3.1 The weighted average Swedish IIT within the forest, metal and machinery industries with EU 15 ...10Figure 3.2 The weighted average Swedish IIT within the three industries with Denmark, Finland, France, Germany, Netherlands and UK...11
1
Introduction
For many years empirical studies have indicated that international trade could not only be explained by comparative advantages. Two observations from the world trade can strengthen this. First, a lot of the world trade today is between countries with similar factor endowments. Second, a large part of the trade is two-way trade with similar products (Krugman 2000). Intra-industry trade (IIT) do represent an important part of the world trade today. The definition of IIT is simultaneous import and export of products within the same industry (Torstensson 1996). The Heckscher-Ohlin model argues that the more dif-ferent the countries are, the more trade it will be. Hence, capital intensive countries will import labour intensive goods and vice versa. However, IIT focus on the similarities (Hansson 1989).
Like other small countries, Sweden is dependent on international trade. The Swedish trade pattern has shown that the IIT has increased, especially within the manufacturing sector. During the 20th century Sweden became a strong industrial country with traditional indus-tries based on the natural wealth of forest and iron ore. However, the machinery industry has grown and become more important. Sweden has their own aviator, nuclear power in-dustries, domestic automotive manufactures, and an advanced war material industry, which is not common for small countries such as Sweden. It cannot be possible to have such a large variety of industries if the products were not traded with other countries. Among the most traded products are machinery, wood products, and iron and steel. These products are part of the forest, metal and machinery industries. About 75 per cent of the Swedish trade goes to Europe. This figure has been quite stabile during the last years (The Swedish Institute 2005b). The European Union membership is the most important change in the trade policy in the modern era (Ministry for Foreign Affairs 2005). Free trade agreements should spur IIT. This relationship is found in studies by Culem and Lundberg (1986) and Hansson (1989). The internal market has an essential role within the European Union. All trade barriers capable of hindering the intra-community trade are forbidden (Craig and de Búrca 1998).
Since free trade agreements and custom unions have a positive affect on IIT, the Swedish membership, in 1995, in EU should increase the IIT with the other EU countries. How-ever, before entering EU, Sweden was part of EFTA (European Free Trade Agreement). Therefore, there may not be an increase of IIT. Considering these facts, the question to ask is how the IIT between Sweden and EU 151 has developed during 1980-2002? Since Swe-den is a strong industrial country focus will be put on goods in the forest, metal and ma-chinery industries. These industries represent important and basic industries within the Swedish manufacturing industry. Their levels of trade are also high.
1.1 Purpose
The purpose of this thesis is to analyse the pattern of IIT between Sweden and EU 15. The statistical data has been delimited into investigating the forest, metal and machinery indus-tries during the period 1980–2002. All three indusindus-tries produce goods within the
1 The countries representing EU 15, except Sweden, are; Austria, Belgium, Denmark, Finland, France,
Ger-many, Greece, Ireland, Italy, Luxemburg, Netherlands, Portugal, Spain, and the United Kingdom of Great Britain.
ity group of manufactures. Free trade agreements have a positive effect on IIT, therefore EU 15 is selected as the trading partner. Focus will be put on which countries, within EU 15, Sweden has high or low IIT with. Further, comparisons will be done between the products with higher IIT and the products with lower IIT. The pattern of IIT in these in-dustries is analysed with the help of standard theories.
1.2 Earlier Research
The first studies of IIT were developed in the beginning of the 1960´s. 2 However, the real interest for IIT began with the publication of Grubel and Lloyd’s book about IIT in 1975 (Grubel and Lloyd 1975). Parjanne (1989) writes that IIT stands for more than half of the trade between industrial countries and is growing faster than one-way trade. Hansson (1989) investigated the Swedish IIT within manufactures and found that IIT was higher the more differentiated the products in the industry were. Further, he discovered that the Swedish IIT was more advanced with countries which had the same resource requirements and/or the same income level as Sweden. Sweden does also have higher IIT with countries which have a common boarder with Sweden. Thus, the IIT trade is larger the less the transaction costs are, i.e. no tariffs and low transportation costs. Finally, Hanson’s results showed that IIT was more advanced in intermediate industries regarding factor intensities. Andersson (2004) has studied IIT between Sweden and Finland. He found that the similari-ties in factor endowments and convergence in the economic structure between Sweden and Finland have made the IIT increase. A study made by Greenaway and Torstensson (1997) on Swedish IIT trade with OECD countries concluded that both economic geography and factor proportions variables were essential when determining IIT. In a paper by Torstens-son (1996) he points out that some economists have focused more on IIT than on net trade and states that it is equally important to make research in net trade as on IIT.
1.3 Outline
This thesis is divided into one theoretical part and one empirical part testing the hypothesis of the thesis. The theoretical part, chapter 2, presents relevant theories of IIT. Chapter 2 does also consist of factors affecting IIT and the Grubel-Lloyd index measuring IIT. Fur-ther, chapter 3 starts the empirical part and contains a presentation of the statistical data, the Grubel-Lloyd index, the empirical findings, and an analysis of the empirical findings. Finally, the thesis ends with a conclusion and suggestion to further research.
2
Intra-industry Trade
This chapter explains IIT and points out the factors affecting two-way trade. Further, the Grubel-Lloyd index, measuring IIT, is presented. The chapter ends with a summary.
2.1 Theories of Intra-industry Trade
A large part of the international trade today takes place between developed countries and specifically in manufactures. This pattern of trade is common within IIT (Hansson 1989). The definition of IIT is simultaneous export and import of differentiated products (Par-janne 1989, Hansson 1989 and others). An industry contains many firms which all, to some extent, produce differentiated products. Two-way trade will occur within an industry since firms in different countries will produce differentiated products. Countries and consumers have different preferences and therefore demand different products (Krugman 2000). The flow of IIT can be explained by a trade overlap. Trade overlap is described by similar ex-port and imex-port of a specific commodity and is common between developed countries (Bowen, Hollander and Viaene 1998).
However, the IIT theory contrasts the traditional international trade theories such as Ricar-dian and Heckscher-Ohlin which state that countries should benefit from trading the good they have a comparative advantage in. This pattern of trade is called inter-industry trade (Krugman and Obstfeldt 2000). Inter-industry trade or net trade is trade in different prod-ucts which are produced with different production technologies (Parjanne 1989). The less similar the countries are, the more net trade there will be (Hansson 1989). IIT is not based on comparative advantages, which means that countries trade in the same or similar prod-ucts (Krugman and Obstfeldt 2000).
Factors can affect the pattern of IIT on both the demand and supply side. Burenstam Linder (1961) underlines that factors affect IIT on the demand side. Before products can be exported successfully, they should be developed in the home markets. Therefore, these products will be exported to countries with similar preference structures. From this hy-pothesis one expects high-income countries to export high quality products and low-income countries to export low-quality products (Hansson 1994).
2.1.1 Intra-industry Trade under Different Market Structures
IIT can take place under different market structures; perfect competition, monopolistic competition and oligopoly. In a market with perfect competition increasing returns are as-sumed to be external to the firms and internal to the industry. IIT will arise between the similar countries, since they produce similar products. Thus, the two trading partners have similar factor prices which means that products can be differentiated (Hansson 1989). IIT during perfect competition is also identified as the Marshallian Approach (Krugman 2000). The next circumstance is IIT with monopolistic competition, where the products produced are industry specific and not country specific. One industry produce products with increas-ing returns to scale and the other industry’s products have constant return to scale. This means that the products with increasing returns to scale are differentiated and perfectly substituted with each other. IIT will take place in the sector with product differentiation and internal economies of scale. More equal endowments of production factors between countries gives rise to a larger IIT (Hansson 1989). This model is also known as the Cham-berlinian Approach (Krugman 2000).
Oligopoly is the last market structure. In this world there are two countries with only a few firms in each country. Homogenous goods are produced by the firms and for both coun-tries, the domestic market is identical with the foreign market. Thus, the countries have equal size of market share in the foreign market and import and export of similar goods be-tween countries occur. This pattern of trade is IIT (Hansson 1989). The countries believe that they have a higher elasticity of demand in the foreign market than at home. Therefore, they dump the price on each others market and the phenomenon of reciprocal dumping takes place (Krugman 2000). In order for IIT trade to occur under oligopoly it is important that the markets are segmented. If not, the countries will not be able to discriminate the home markets (Hansson 1989). This model is one model within the Cournot Approach (Krug-man 2000).
2.1.2 Economies of Scale and Product Differentiation
As written in the previous part about IIT and different market structures, both economies of scale and product differentiation are essential for the trade pattern of IIT. Regarding economies of scale, it is specifically increasing returns to scale which often plays an impor-tant role for the appearance of IIT (Hansson 1989). It is economies of scale in production which makes each firm to produce only a specific set of varieties of the products within a product group. Economies of scale are the fundamental reason for IIT (Krugman 2000). By trading, the countries will gain from having a larger market. In the case of constant re-turns to scale, the production is determined by comparative advantages, i.e. Heckscher-Ohlin trade. Though, it is not empirically proven that there exists a positive relationship be-tween IIT and the degree of economies of scale within an industry (Hansson 1989). Economists such as Balassa and Bauwens (1987) and Greenaway (1999) have found similar results in their studies (Gullstrand 2002).
It is very important that the products can be differentiated in order for IIT to occur. Every product or product group consist of a collection of characteristics which mean that each product can be differentiated into many varieties (Parjanne 1989). There are two definitions of a differentiated product, one comes from Lancaster’s (1979) product characteristics ap-proach and the other from Dixit and Stiglitz (1977), and Spence (1976). These definitions are based on consumers’ demand of product variation. Dixit, Stiglitz (1977) and Spence (1976) were first and identified product differentiation as production of a large range of products which had not yet been produced. Consumers want as many varieties as possible and their utility increases as the varieties increases. Lancaster’s (1979) idea with product dif-ferentiation is that consumers demand one particular ideal variety which maximizes their utility. However, different groups of consumers prefer different ideal varieties. The chal-lenge is to offer a variety of attributes which is different from the already existing one. The degree of product differentiation in each industry can be comparable to the elasticity of substitution in demand of products within the same industry. For example, the lower the elasticity is, the more differentiated the products are (Hansson 1989). If the products are differentiated, both countries will gain from IIT. If this is not true, the more similar the countries have to be in order to gain from IIT (Krugman 2000).
Differentiated products can be distinguished into two cases, namely vertical and horizontal product differentiation. By vertical differentiation, it means that the products produced within an industry have different quality. Prices are different in these products because a product with a higher quality demands a higher price. In horizontal product differentiation, prices are not the issue. When two products have the same price, the consumer will buy the
product she prefers and another consumer will prefer the other variety. However, in reality, there is a mix of vertical and horizontal product differentiation (Hansson 1994).
2.2 Determinants of Intra-industry Trade
The determinants of IIT can be divided into two characteristics; product specific and coun-try specific. As written in the previous section, economies of scale and product differentia-tion are two important industry specific factors contributing to IIT (Krugman 2000). The opportunity to differentiate a product will also influence IIT. Industries or countries with large opportunities to differentiate their products will have higher IIT in these products (Balassa and Bauwens 1988). Another industry specific factor is per capita income which influences IIT trade when there are both differences and similarities between countries (Bowen, Hollander and Viaene 1998). Countries which have similarities in income per cap-ita should have higher IIT trade with each other (Culem and Lundberg 1986, Johansson 1993). However, Gullstrand (2002) adds that differentiated products have to be luxuries in order for a high average per capita income to increase the volume of IIT. A high average income per capita may be a sign of that the average capital-to-labour ratio also is high be-tween the trading countries. This indicates that the larger capital-to-labour ratio, the larger IIT because there is a higher share of production of differentiated products (Gullstrand 2002).
A country characteristic such as closeness to the trading partner increases the IIT. Hence, a large distance between two countries decreases the IIT (Hansson 1994, Johansson 1993). The negative relationship between geographical distance and IIT can be reflected by trans-portation costs. It is not only transtrans-portation costs which hinder IIT trade, tariffs and non-tariffs barriers do also give the same effect (Culem and Lundberg 1986). This means that countries involved in free trade agreements, such as EEC and EFTA, should have larger IIT (Hansson 1989). Similar, Balassa and Bauwens (1987, 1988) have found that when both countries are part of a custom union, for example EU and EFTA, it has a positive effect on the share of IIT. Having a common border does also give rise to IIT (Johansson 1993). Border trade can explain some of the IIT trade between neighbouring countries (Hansson 1989). The same or similar GDP per capita is also a determinant. Another factor affecting IIT is cultural similarities. Countries within the same or similar linguistic area share more IIT with each other (Johansson 1993).
IIT is more likely to happen between developed countries (Hansson 1989). By having IIT, countries can benefit from a larger market which means that they can reduce the number of products produced at home, but still raise the variety of products available to the domes-tic consumers (Krugman and Obstfeld 2000).
2.3 The Grubel-Lloyd Index
The Grubel-Lloyd index is the standard measure of IIT. The definition of IIT used by Grubel and Lloyd (1975) is “the value of exports of an industry which is exactly matched by the imports of the same industry” (Grubel and Lloyd 1975, p.20). Their index covers trade overlap. The Grubel-Lloyd index is developed from equations of intra-and inter-industry trade:
Inter-industry trade= | Xi-Mi | Equation 2.1
Where Xi is a country’s export of industry i and Mi is a country’s import of industry i. Based on the two equations (2.1 and 2.2), the Grubel-Lloyd index, I, was developed. The Grubel-Lloyd index measures to what extent the share of total trade is IIT. The index al-lows comparison between both countries and industries:
I = (( Xi + Mi ) – | Xi-Mi | )/ ( Xi+Mi )
= 1 - | Xi-Mi | / ( Xi+Mi ) Equation 2.3 Equation 2.3 is called the Grubel-Lloyd index (Grubel and Lloyd 1975).
When the trade is in balance, the Grubel-Lloyd index equals one, i.e. there is only IIT. However, if the value of the index is zero, there is complete specialization and all trade is inter-industry trade (Krugman 2000).
Parjanne (1989) has studied the problems when measuring IIT and found two objections which have to be taken under consideration when using the Grubel-Lloyd index. Primary, the index is not linear. This means that for a constant increase in export (import) for a given level of import (export) the value of the index, I, is diminishing. Next, the index is not dependent on the absolute values of import and export since IIT is written as a fraction of the industry’s total trade (Parjanne 1989).3
The main issue when measuring IIT is the categorical aggregation problem (Grubel and Lloyd 1975). The statistical data can be classified and aggregated in different levels, which is one part of the problem (Hansson 1989). Differentiated products may be aggregated into quite similar product groups (Bowen, Hollander and Viaene 1998). Parjanne (1989) men-tions two reasons why categorical aggregation comes up. First, it is due to an opposite sign effect. The existence of sub-groups with opposite signs (surplus or deficit) will lead to trade imbalance and as a result the index, I, becomes overvalued. Second, the issue with weighted effects may cause the index, I, to be distorted, dependent on how important the weighted sub-groups are (Parjanne 1989). If the problem with categorical aggregation is ignored, the outcome can be that the index is irrelevant for the understanding of the actual trade pat-terns (Bowen, Hollander and Viaene 1998).
The fact that the value of IIT will be different the more disaggregated the data is, has caused economists to argue which SITC level is the most appropriate one. When using the more aggregated levels, the value of the index, I, decreases (Hansson 1989, Parjanne 1989). It is not necessary to use extremely aggregated data. The three digit or four digit level are suitable enough. Many economists have stated that these levels give the most accurate ap-proximations. Thus, these levels are the most commonly used in economic studies (Par-janne 1989).
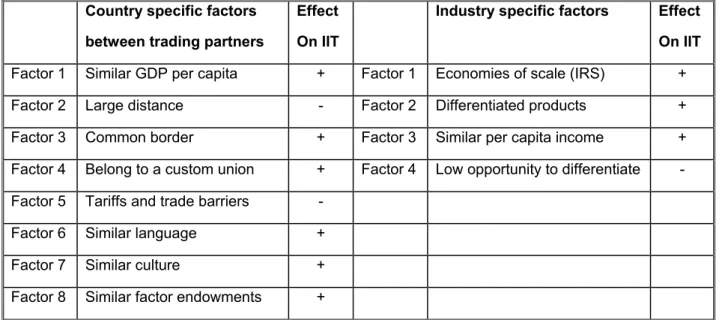
2.4 Summary
The definition of IIT is simultaneous export and import of differentiated products within the same industry. IIT occurs because of complete specialization in industries. Hence, the opposite of two-way trade is inter-industry trade based on comparative advantages. Similar countries will have more two-way trade. The factors that affect IIT are presented below in
3 For discussion about the Grubel-Lloyd index and its advantages and disadvantages in relation to other
table 2.1. The most common measure of IIT is the Grubel-Lloyd index. When the value is equal to one, there is large IIT and when the value is zero, there is large inter-industry trade. However, there are problems with the Grubel-Lloyd index. But, economists have stated the Grubel-Lloyd index as the most appropriate one when measuring IIT.
Table 2.1 A summary of the factors affecting IIT Country specific factors
between trading partners
Effect On IIT
Industry specific factors Effect On IIT Factor 1 Similar GDP per capita + Factor 1 Economies of scale (IRS) + Factor 2 Large distance - Factor 2 Differentiated products + Factor 3 Common border + Factor 3 Similar per capita income + Factor 4 Belong to a custom union + Factor 4 Low opportunity to differentiate - Factor 5 Tariffs and trade barriers -
Factor 6 Similar language + Factor 7 Similar culture + Factor 8 Similar factor endowments +
3
Empirical Study of the Swedish Intra-industry Trade
This chapter provides a presentation of the empirical study. First, the method, the statistical data, and the Grubel-Lloyd index, used are explained. Next, the Swedish forest, metal and machinery industries are introduced in more detailed. Finally, the empirical findings are presented and analysed.
3.1 Data and Methodology
All the statistical data have been collected from SourceOECD. The data covers Sweden’s export and import of manufactures with EU 15 between the years 1980 - 2002. The meas-ured values of the export and import are in thousands of US dollars. Annual data is used, because the trade pattern can vary year from year and only analysing some years could lead to misleading results. By using annual data, one gets clear and trustworthy results and it is easy to see changes in the pattern of trade.
The products used are classified at a four digit level of SITC Revision 2. Three industries will be examined; the forest, the metal and the machinery industries, where SITC code 6330 – 6228 represents the forest industry, 6712 – 6954 are products within the metal in-dustry and, 7111 – 7149, 7161 – 7239 and 7810 – 7938 cover the machinery inin-dustry.4 All industries represent important industries in Sweden with large trade and these industries are further presented in section 3.2. The classification in the SITC system is product based and not industry based (Bowen, Hollander and Viaene 1998). This delimitation of product groups has been done in order to fit each product into the correct industry. Since manufac-tures are the most appropriate commodities to study when measuring IIT, all products are manufactures. The four digit level of SITC has been commonly used in earlier studies, therefore it is used in this thesis too. Using more disaggregated data may result in that the Grubel-Lloyd index would be of limited use since it may only cover one-way trade. Since the data for the Swedish trade with Belgium and Luxemburg is added together for the years between 1980-1997 and separate from 1998 and onward, these two countries are excluded from the empirical analysis.
The model applied when calculating IIT is the Grubel-Lloyd index (see equation 2.3). This index is frequently used by economists measuring IIT and is also stated to be the most ap-propriate one to work with (Hansson, 1989). Consequently, it is used in this thesis too. In order to avoid just measuring the trade balance, weighted measures have been used in the Grubel-Lloyd index when adding the product groups in each industry. As a result, the rela-tive size of each industry in comparison to the volume of the total trade of all industries is taken under consideration. But, when analysing which product groups have large or low IIT, the ordinary Grubel-Lloyd values will be used. Notable is that the Grubel-Lloyd meas-ures for all product groups varies very much during the time period. Therefore only prod-ucts which have had a constant trade pattern over or under the estimated values for high and low intra-industry trade are considered as high or low.5
Since IIT has become more important during the years, the expected result is that the IIT should have increased during the time period. However, not with all countries. Trade
4 A list of the product groups included in the empirical study is found in appendix A.
5 The values determining high and low intra-industry trade are; 0.010631 and 0.591696, and are further
ners far away from Sweden or countries with different factor endowments than Sweden should have lower two-way trade. Thus, the nearby trading partners, Finland, Denmark, and Germany are expected to have higher IIT with Sweden. The product that are produced in more varieties and that can be more differentiated, should also be involved in higher two-way trade.
3.2 The Forest, Metal and Machinery Industries
As written before, the industries analysed are the forest, metal and machinery industries. They are all important for the Swedish trade. The machinery industry represents more than 55 per cent of the total production in the Swedish manufacture industry. But, it has de-creased in relation to other industries. As the second largest industry within the manufac-turing industry, the forest industry stands for nearly 20 per cent of total production. Repre-sented in the forest industry are wood products, pulp, paper and paperboard, but not furni-ture. The metal industry with products of iron and steel has five per cent of the total pro-duction. These industries account for the most exported Swedish products. The machinery industry is the largest one with 40 per cent of the export, followed by the forest industry with about 11 per cent and the metal industry stands for approximately eight per cent of all exported goods (The Swedish Institute 2005b).
The industrial sector consists of about 50 000 companies with an average number of 30 employees. The machinery industry is dominated by companies such as Volvo, SAAB, Scania, ABB (power and automation equipment), and Atlas Copco (mining and construc-tion equipment). Within this industry, the branch of transportaconstruc-tion equipment has been one of the most important sectors in Sweden with a production of cars, trucks, busses, air-craft, trains, and marine and aircraft engines. This sector employs almost 200 000 people. An important factor in the machinery industry is specialization. The aim is to produce not only finished products, but also special accessories. Efficiency is another goal, which in-creases the need for research and development (R&D). Increased competition from both Swedish companies and foreign ones has lead to more cooperation between companies. Sweden is an important producer of forest products. Only Canada and Finland export more forest products than Sweden. The industry has always been a key industry in Sweden, based on the fact that almost one half of the Swedish landscape is covered with forest. Among the largest wood producing companies in Sweden are StoraEnso, SCA, Holmen and Sveaskog. The Swedish forest industry has been identified as a strong economic clus-ter. Companies within the forest industry work closely together and with other industries. Such collaboration creates advantages in form of knowledge and specialized employees. Competitors to the Swedish companies are not only other Swedish suppliers, but also European manufactures. Many firms act on the Swedish market. However, during the last years a lot of companies have merged with each other. Today, the four largest groups ac-count for about 80 per cent of the total Swedish sales of forest products. Yet, the groups have a diversified production, which means that there are a large variety of the products produced. This can also be seen in appendix A. The Swedish production has become more and more effective (Swedish Institute 2005b).
Until the late 1970´s, the metal industry was a central part of the Swedish manufacturing industry. But, due to a structural crisis, the production was rationalised. Today, three large companies dominate the Swedish market. However, they are all par of Svenskt Stål AB (SSAB) and accounts for about 60 per cent of the Swedish production. The Swedish steel
industry focuses on special products which require high quality (Swedish Institute 2005a). This means that a large variety of goods are produced (Jernkontoret 2005).
3.3 Empirical Findings and Analysis
The results presented in this part show how the Swedish IIT has developed during the time period 1980 - 2002. The results will focus on two matters. First, the countries with which Sweden has large or low IIT are analysed. Then, the focus is put on which product groups that are involved in high or low IIT. All analysis will be made in relation to the theory pre-sented in chapter two.
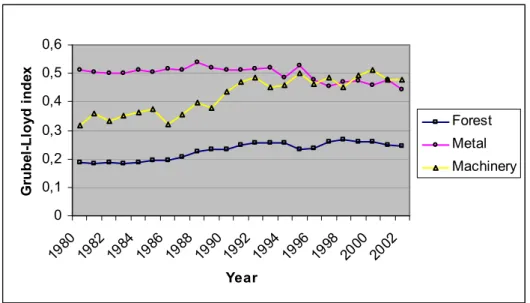
3.3.1 Intra-industry Trade Between Sweden and the Member States Presented in figure 3.1 below are the weighted average IIT measures of the Grubel-Lloyd index for the forest, metal and machinery industries. As can be seen, the IIT has increased for the forest and machinery industries, and slightly decreased in the metal industry. But the development over the time period is quite small. Only the machinery industry has a large growth. This development arises from the fact that the opportunity to differentiate is larger in the machinery industry than the other two industries. The values also indicate that there is more one-way trade than IIT in all three industries. This is especially true for the forest industry, where the average weighted Grubel-Lloyd value have only increased from 0.12 to 0.176. In this industry almost all trade is inter-industry trade. The other two indus-tries have average values that signify that there occur more IIT. But there are still more one-way trade. In the metal industry, the measures have decreased from 0.38 to 0.35. There has not been a constant decrease. During the first years, the IIT increased but showed a drastic slow-down after 1996. Thus, during the last years the values have smoothened out. The industry that has had the most rising curve is the machinery industry. In 1980, the IIT was relatively low with 0.25 and has during the time period increased to 0.40.
0 0,05 0,1 0,15 0,2 0,25 0,3 0,35 0,4 0,45 0,5 19801982 1984 1986 198819901992 1994 1996 199820002002 Year G ru b e l-L lo y d i n d e x Forest Metal Machinery
Figure 3.1 The weighted average Swedish IIT within the forest, metal and machinery industries with EU 15. However, these low weighted average Grubel-Lloyd measures are the result from the fact that Sweden shares more IIT with some EU countries and very low IIT with other Mem-ber States. By analysing the values for all countries in respective industry, one can see that there are six countries that Sweden shares more IIT with, namely Denmark, Finland, France, Germany, Netherlands and UK.7 When making an average IIT for all these coun-tries, one can se from figure 3.2 that the measures for all industries have increased with about one tenth.
0 0,1 0,2 0,3 0,4 0,5 0,6 1980 1982 1984 1986 1988 19901992 1994 1996 1998 2000 2002 Year G ru b e l-L lo y d i n d e x Forest Metal Machinery
Figure 3.2 The weighted average Swedish IIT within the three industries with Denmark, Finland, France, Germany, Netherlands and UK.
The forest industry is still the industry with largest inter-industry trade. Now, the values vary around 0.238. For the metal industry, the measures have increased to about 0.50, which states that there is as much IIT as one-way trade. However, for the last years the Grubel-Lloyd values for the metal industry have decreased to around 0.45. Contrary to the metal industry, the IIT in the machinery industry has risen and is during the last year about 0.50. This development illustrates the change in the manufacturing industry. The metal in-dustry has always been strong, but the machinery inin-dustry has shown the greatest growth during the last years. Despite the fact the forest industry for a long time has represented an important source of trade, the only EU country which Sweden has two-way trade with is Finland. To the other countries the trade pattern mostly consists of export. Similarities in factor endowments, both Sweden and Finland are largely covered with forest, and equality in size are two important factors contributing to large IIT in the forest industry. Other fac-tors are the closeness between Sweden and Finland. The border makes it easier to trade and this leads to low transaction cost. The language factor does also simplify the two-way trade between Sweden and Finland, where a part of the Finnish Community speak Swedish. The account of small IIT with the other Member States mainly dues to the fact that they
7 The annual weighted Grubel-Lloyd values for each country in respective industry are presented in appendix
C-E.
have a small amount of forest. As a consequence, these countries are in need of importing forest goods from, for example, Sweden. Thus, there is one-way trade.
Similar for the metal and machinery industry is that a large part of the IIT goes to the same countries; Austria, Denmark, Finland, France, Germany, Netherlands, and UK. Interesting results are that the IIT with UK has increased during the years for the machinery industry, but largely reduced in the metal industry. Focusing only on the metal industry one sees that the two-way trade with Greece is almost non-existent. Due to differences in factor en-dowments and distance, the IIT will be small. Another factor is GDP per capita, where Greece has a much lower value than Sweden. Then, there are some countries with which Sweden share some IIT but the major part is inter-industry trade. These are Italy, Ireland, Portugal and Spain. Similar for these countries is that they are not important trade partners for Sweden in this area and vice versa. When trade occur, the Swedish export is larger than the import. Consequently, the IIT is low.
For Austria, Denmark, Finland, France, Germany, Netherlands, and UK, the IIT measures in the metal industry varies around 0.5 but have not been constant over the years. Three countries differ from the other with high values throughout the whole period, namely Denmark, Finland and Germany. These are all close countries with Sweden regarding dis-tance and culture. The connection between the countries has always been strong and they represent important trading partners for Sweden. Similar, Sweden is a central trading part-ner for Denmark, Finland and Germany too. This is basics for IIT. The border trade is an essential factor contributing to IIT between Sweden and the Nordic countries. Likewise, the similarity in GDP per capita. Further, the relation between the languages causes larger two-way trade. The factor endowments are similar among all four countries, which make it easier to have high IIT. The relationship with Denmark has developed further, due to the bridge over Öresund. This has made Sweden more connected with Europe and especially northern Germany.
The Swedish IIT has increased for almost all countries over the time period in the machin-ery industry. However, the development has not always been constant.9 This change fol-lows the Swedish development in the machinery industry. Today, this industry is the largest one in the manufacture industry. The largest progress of IIT, during the time period, has taken place with UK and Austria. In 1980, the Grubel-Lloyd measure was about 0.23 and in 2002 0.613 for Austria and 0.478 for UK. However, UK reached values over 0.50 during the years 1995-2000. Sweden and UK has a close contact with each other and the countries market structures are quite similar. The language factor makes it easier to trade with UK, since English is a highly spoken language in Sweden. There is either any huge difference in GDP per capita between Sweden, Austria and UK.
With countries such as Denmark, Finland, France and Germany, the IIT is relative high. The machinery industry is especially large in Germany and France, but is also present in Denmark and Finland. This means that there are similarities in factor endowment. There is either no larger difference in GDP per capita, which positively contributes to IIT. Another factor is distance. All three countries lies relative close to Sweden, they are part of the northern Europe. This factor means that the transaction costs are lower. Thus, the two-way trade will be higher. The culture in the northern part of Europe is also more alike, which
signifies that there are similarities in tastes. This is another factor contributing to larger two-way trade.
Since all these countries are part of the European Union, the absence of trade barriers within the Union is a highly relevant factor leading to larger IIT. Before Sweden became a member, they were part of EFTA with the other countries which were not EU members. Thus, during the time period analysed, all these countries were members in a free trade or-ganisation which makes it easier to trade and benefits IIT. Today, all the EU members are part of the WTO.
3.3.2 Intra-industry Trade Within the Product Groups
As have been shown in the previous part, the IIT in all industries is almost every year smaller than the one-way trade. This indicates that a larger part of all product groups have high inter-industry trade. However, there are some product groups which have large two-way trade. When determining which values of IIT should be considered as high and low, all values for each product, each year and each country have been sampled and divided into four quartiles. The low IIT value used, determined from the first quartile, is 0.010631. The high value, determined from the fourth quartile, showed 0.591696. These values are used when analysing the products with high or low IIT in tables 3.2- 3.4. Below follows table 3.1 presenting a statistical summary of all the Grubel-Lloyd values measured:
Table 3.1 A statistical summary of the Grubel-Lloyd measures.
Mean Median Min. Max.
0.326049 0.234253 0 0.999937
Investigating the values in the table above, one can see from the low median that more than half of the products have low IIT, i.e. larger inter-industry trade. The same result is shown by the low mean value. Therefore, only a few of the products are engaged in high IIT.
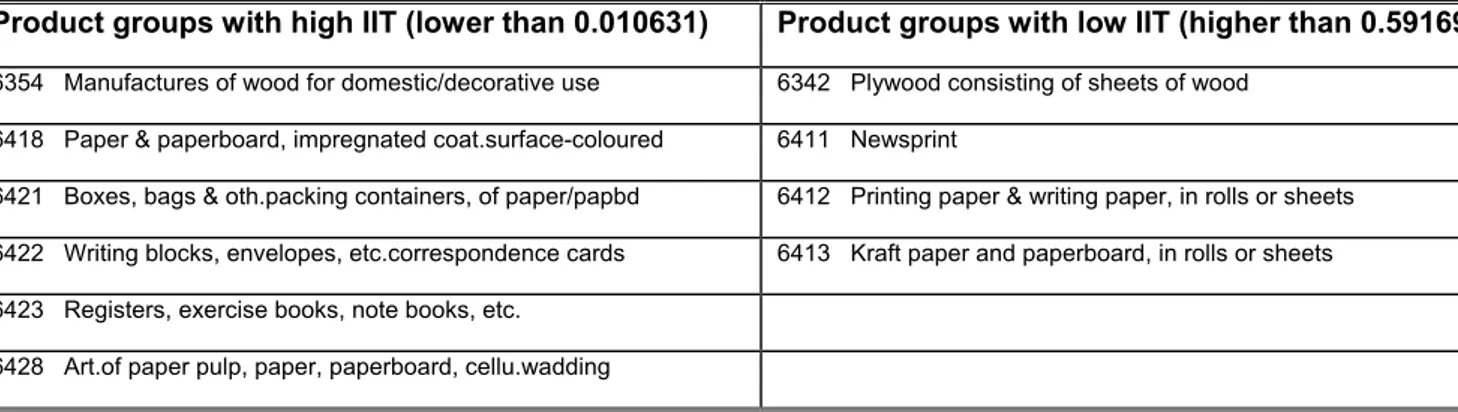
The analysis, by using the Grubel-Lloyd index, has shown which products within the indus-tries have large and low IIT. First, the forest industry is examined. Two factors are espe-cially important in order for a product to engage in two-way trade; product differentiation and economies of scale. The products that are distinguished with large or low IIT, within the forest industry, are presented in table 3.2.
Table 3.2 Product groups with high or low IIT within the forest industry.
Product groups with high IIT (lower than 0.010631) Product groups with low IIT (higher than 0.591696) 6354 Manufactures of wood for domestic/decorative use 6342 Plywood consisting of sheets of wood
6418 Paper & paperboard, impregnated coat.surface-coloured 6411 Newsprint
6421 Boxes, bags & oth.packing containers, of paper/papbd 6412 Printing paper & writing paper, in rolls or sheets
6422 Writing blocks, envelopes, etc.correspondence cards 6413 Kraft paper and paperboard, in rolls or sheets
6423 Registers, exercise books, note books, etc.
Similar for the products with high IIT are that they are differentiated into many sub-groups. The market structure with a few large companies, illustrates an oligopoly. However, this does not mean that the products produced are homogenous. The products in this in-dustry are differentiated. These factors are inin-dustry characteristics contributing to large IIT for a specific product group. Interesting results are also that these products have high val-ues of export and import. However, a large part of the product groups in the forest indus-try have inter-indusindus-try trade. It is hard to see any differences between these goods and the one with high two-way trade. However, one factor is that products with high IIT are more differentiated. The opportunity to differentiate forest goods is low. Therefore the share of inter-industry trade is larger than IIT.
One characteristic for the metal industry is that the companies produce special goods. Fur-ther, the market is dominated by a few large firms. Thus, the market has the characteristic of an oligopoly. This indicates that the market structure fits well together with IIT, since the products are differentiated. The goods involved in large and low IIT are presented in the table below.
Table 3.3 Product groups with high or low IIT within the metal industry.
Product groups with high IIT (lower than 0.010631) Product groups with low IIT (higher than 0.591696) 6732 Bars & rods, of iron/steel; hollow mining drill st. 6712 Pig iron, cast iron and spiegeleisen, in pigs, blocks
6750 Hoop & strip, of iron/steel, hot-rolled/cold-rolled 6747 Tinned sheets and plates, of steel
6783 Other tubes and pipes, of iron or steel 6781 Tubes and pipes, of cast iron
6785 Tube & pipe fittings (joints, elbows) of iron/steel 6784 High-pressure hydro-electric conduits of steel
6822 Copper and copper alloys, worked 6812 Platinum and other metals of the platinum group
6842 Aluminium and aluminium alloys, worked 6851 Lead and lead alloys, unwrought
6953 Other tools for use in the hand 6852 Lead and lead alloys, worked
6954 Interchangeable tools for hand & machine tools 6861 Zinc and zinc alloys, unwrought
6871 Tin and tin alloys, unwrought
6872 Tin and tin alloys, worked
6932 Wire, twisted hoop for fencing of iron or steel
As can be seen from table 3.3 above, there are more products involved in low IIT than high IIT. Similar for the products with high two-way trade is that they, in general, are more differentiated than the products with low IIT. However, products 6783 and 6784 belong to the same product group (678X) and are involved in both high and low IIT. Another con-tributing factor is the low opportunity to differentiate metal products which leads to higher inter-industry trade in these products.
The market in the machinery industry consists of many firms and this structure is similar to perfect competition. Below follows table 3.4 where the product groups with high and low IIT are presented.
Table 3.4 Product groups with high or low IIT within the machinery industry.
Product groups with high IIT (lower than 0.010631) Product groups with low IIT (higher than 0.591696) 7139 Parts of int.comb.piston engines of 713.2-/3-/8- 7126 Steam & other vapour power units, steam engines
7161 Motors & generators, direct current 7187 Nuclear reactors and parts
7162 Elect.motors & generators, generating sets 7223 Track-laying tractors
7188 Engines & motors, n.e.s.such as water turbines etc. 7841 Chassis fitted with engines for motor vehicles
7849 Other parts & accessories of motor vehicles 7911 Rail locomotives, electric
7853 Invalid cariages, motorized or not, parts 7912 Other rail locomotives; tenders
7929 Parts of heading 792--, excl.tyres, engines 7913 Railway & tramway coaches, vans, trucks etc.
7914 Railway & tramway passenger coaches & luggage vans
7915 Rail&tramway freight and maintenance cars
7921 Helicopters
7933 Ships, boats and other vessels for breaking up
Notable for these products are that they, except product 7849, represent products with low export and import values. As can be seen from the table, more product groups are involved in low IIT than high. However, the machinery industry has a higher opportunity to differ-entiate its products than the other two industries. This should indicate that more products are involved in high IIT. Similar for the products with low IIT is that they are less differen-tiated than the products with high two-way trade. This indicates that the theories agree with the empirical results.
4
Conclusions and Suggestion to Further Research
IIT has become a larger and more important part of the pattern of trade today. This is also true for the Swedish trade. Economists have estimated that more than half of the Swedish trade is two-way trade. IIT is especially high within manufactures. The Swedish manufac-turing industry has always been strong. Since Sweden is to a large extent covered with for-est, the forest industry has during a long period been very important for the Swedish trade. However, the machinery industry has grown stronger and represents today the largest in-dustry within the manufacturing inin-dustry. Together with the metal inin-dustry, the forest and machinery industries are basic industries in Sweden. Therefore these industries have been used when measuring the size of two-way trade between Sweden and the other Member States in EU 15. With help of the Grubel-Lloyd index, values have been estimated for both two-way trade between countries and within product groups.
The purpose with this thesis is to analyse how the pattern of IIT has developed during 1980-2000. The empirical findings showed that Sweden has larger IIT with nearby coun-tries, such as Denmark, Finland, Germany, France, Netherlands and UK. Especially high is the two-way trade with Denmark; Finland and Germany. Consequently, high inter-industry trade takes place with Italy, Spain, and Portugal. The IIT with Greece is almost non-existent in all industries. Analysing only the forest industry, one sees that large two-way trade merely occur with Finland. More countries are involved in high IIT in the metal in-dustry. But the largest trade takes place with Germany, Finland and Denmark. Likewise, in the machinery industry Germany, Finland and Denmark together with France are engaged in large IIT.
Similar for all countries that have high IIT with Sweden, in all industries, is that they are close to Sweden regarding distance. The border trade with Denmark and Finland is espe-cially distinguished. Factor endowments and GDP per capita are other factors similar be-tween these countries. There are also similarities in culture and language. The empirical findings of IIT within product groups showed that the more differentiated products have larger IIT. Further, a large part of the products have more net trade than two-way trade. This paper analyses the two-way trade between Sweden and EU 15. It would be interesting to follow up this analysis, a few years from now, to see if the IIT has increased or de-creased. Another issue would be to study the Swedish pattern of IIT with the Nordic tries. This analysis showed that Sweden has high two-way trade with neighbouring coun-tries. Earlier research has proved strong IIT between Sweden and Finland. Therefore, a study of all Nordic countries would be interesting in order to see if the results are similar.
References
Andersson L.F. (2004), “Convergence and Structure of Trade: The Swedish- Finnish case”, Scandinavian Journal of History, March 2004, Volume 29 Issue 1, p. 27-51
Balassa B. and Bauwens L. (1988), “The Determinants of Intra-European Trade in Manu-factured Goods”, European Economic Review, 32, p. 1421-1437
Bowen P., Hollander A., and Viaene J-M. (1998), Applied International Trade Analysis, Antony Rowe Ldt, Chippenham and Eastbourne
Craig P. and de Búrca G. (1998), EU Law. Text, Cases and Materials, Third edition, Oxford University Press
Culem C. and Lundberg L. (1986), “The Product Pattern of Intra-industry Trade: Stability among Countries and Over Time”, Economic Research Report No.6, FIEF
Dixit A.K and Stiglitz J.E (1977), “Monopolistic Competition and Optimum Product Di-versity”, The American Economic Review, Vol 67, No. 3, p. 297-308
Gullstrand J. (2002), Splitting and Measuring Intra-Industry Trade, KFS AB, Lund
Greenaway D. and Torstensson J. (1997), “Economic Geography, Comperative Advantage and Trade within Industries: Evidence from the OECD”, Working Paper Series 70/97, Department of Economics, School of Economics and Management University of Lund
Grubel H. G. and Lloyd P.J. (1975), Intra-industry Trade: The Theory and Measurement of Interna-tional Trade in Differentiated Products, Western Printing Services Ldt, London Hansson P. (1989), Intra-Industry Trade: Measurements, Determinants and Growth, Umeå,
Solfjärden Offset AB
Hansson P. (1994), “Product Quality and Vertical Product Differentiation as Determinants of Intra-industry Trade in Swedish Manufacturing”, Working Paper No. 122, FIEF
Jernkontoret (2005), The Swedish Steel Industry, www.jernkontoret.se, 2005-05-03 Johansson B. (1993), Ekonomisk dynamik i Europa, Liber-Hermods, Malmö Krugman P.R. (2000), Rethinking International Trade, The MIT Press, Cambridge
Krugman P.R. and Obstfeld M. (2000), International Economics: Theory and Policy, Fifth edition, Addison-Wesley Publishing Company, Massachusetts
Lancaster K. (1979), Variety, Equity and Efficiency, Columbia University Press, New York Ministry for Foreign Affairs (2005), Foreign Policy and International Cooperation,
Ministry of Industry, Emploment, and Communication (2005), Primary industries,
www.regeringen.se/sb/d/2973, 2005-04-15
OECD (2005), SourceOECD for data on Swedish trade between the year 1980 – 1989,
http://juno.sourceoecd.org/vl=1988607/cl=11/nw=1/rpsv/ij/oecdstats/160 81218/v177n1/s53/p1, 2005-03-30, 2005-03-31
OECD (2005), SorceOECD for data on Swedish trade between the year 1990 – 2002,
http://juno.sourceoecd.org/vl=1988607/cl=11/nw=1/rpsv/ij/oecdstats/160 81218/v177n1/s21/p1, 2005-03-30, 2005-03-31
Parjanne M-L. (1989), Measurement Problems in Intra-Industry Trade, The Helsinki School of Economics, Helsinki
Spence M. (1976), “Product Selection, Fixed Costs, and Monopolistic Competition”, The Review of Economic Studies, Vol 43, No. 2, p. 217-235
The Swedish Institute (2005a), Mining and steel industries in Sweden, www.sweden.se, 2005-05-03
The Swedish Institute (2005b), Swedish Industry, www.sweden.se, 2005-05-03
Tostensson J. (1992), Factor Endowments, Product Differentiation, and International Trade, Univer-sitetsförlaget Dialogos AB FaktorsTjänst AB, Malmö
Torstensson J. (1996), “Intra-Industry Trade: What Does the Theory Predict and How Are the Empirical Estimates?”, Working Paper Series 64/96, Department of Eco-nomics, School of Economics and Management University of Lund
Appendix A
A list of all the product groups included in the empirical study, divided into the three in-dustries.
THE FOREST INDUSTRY
6330 Cork manufactures 6415 Paper and paperboard, in rolls or sheets, n.e.s.
6341 Wood sawn lengthwise, sliced/peeled, but not prepar. 6416 Building board of wood pulp or of vegetable fibre
6342 Plywood consisting of sheets of wood 6417 Paper & paperboard, corrugated, creped, crinkled etc.
6343 Improved wood and reconstituted wood 6418 Paper & paperboard, impregnated coat.surface-coloured
6344 Wood-based panels, n.e.s. 6419 Converted paper and paperboard, n.e.s.
6349 Wood, simply shaped, n.e.s. 6421 Boxes, bags & oth.packing containers, of paper/papbd
6351 Wooden packing cases, boxes, crates, drums etc. 6422 Writing blocks, envelopes, etc.correspondence cards
6352 Casks, barrels, vats, tubs, buckets & oth.coopers'prod 6423 Registers, exercise books, note books, etc.
6353 Builders' carpentry and joinery 6424 Paper and paperboard, cut to size or shape, n.e.s.
6354 Manufactures of wood for domestic/decorative use 6428 Art.of paper pulp, paper, paperboard, cellu.wadding
6359 Manufactured articles of wood, n.e.s. 6712 Pig iron, cast iron and spiegeleisen, in pigs, blocks
6411 Newsprint 6713 Iron or steel powders, shot or sponge
6412 Printing paper & writing paper, in rolls or sheets 6716 Ferro-alloys
6413 Kraft paper and paperboard, in rolls or sheets
THE METAL INDUSTRY
6712 Pig iron, cast iron and spiegeleisen, in pigs, blocks 6821 Copper and copper alloys, refined or not, unwrought
6713 Iron or steel powders, shot or sponge 6822 Copper and copper alloys, worked
6716 Ferroalloys 6831 Nickel & nickel alloys, unwrought (ingots, pigs, etc)
6724 Puddled bars and pilings; ingots, blocks, lumps etc. 6832 Nickel and nickel alloys, worked
6725 Blooms, billets, slabs & sheet bars of iron or steel 6841 Aluminium and aluminium alloys, unwrought
6727 Iron or steel coils for re-rolling 6842 Aluminium and aluminium alloys, worked
6731 Wire rod of iron or steel 6851 Lead and lead alloys, unwrought
6732 Bars & rods, of iron/steel; hollow mining drill st. 6852 Lead and lead alloys, worked
6733 Angles, shapes & sections & sheet piling, of iron/st 6861 Zinc and zinc alloys, unwrought
6741 Universal plates of iron or steel 6863 Zinc and zinc alloys, worked
6744 Sheets & plates, rolled >4.75mm of iron/steel 6871 Tin and tin alloys, unwrought
6745 Sheets & plates, rld.thickns.3mm to 4, 75mm irn/stl. 6872 Tin and tin alloys, worked
6746 Sheets & plates, rolled; thickness of less than 3mm. 6880 Uranium depleted in u235 & thorium, & their alloys
6747 Tinned sheets and plates, of steel 6891 Tungsten, molybdenum, tantalum & magnesium, unwrought
6749 Other sheets and plates, of iron or steel, worked 6899 Base metals, n.e.s.and cermets, unwrought
6760 Rails and railway track construction material 6912 Structures & parts of struc.; aluminium; plates, rods
6770 Iron/steel wire/wheth/not coated, but not insulated 6921 Reservoirs, tanks, vats and similar containers
6781 Tubes and pipes, of cast iron 6924 Casks, drums, boxes of iron/steel for packing goods
6782 `seamless`tubes and pipes; blanks for tubes & pipes 6931 Stranded wire, cables, cordages and the like
6783 Other tubes and pipes, of iron or steel 6932 Wire, twisted hoop for fencing of iron or steel
6784 High-pressure hydro-electric conduits of steel 6935 Gauze, cloth, grill of iron steel or copper
6785 Tube & pipe fittings (joints, elbows) of iron/steel 6940 Nails, screws, nuts, bolts etc.of iron, steel, copper
6793 Steel & iron forgings & stampings, in rough state 6951 Hand tools of a kind used in agriculture etc
6794 Castings or iron or steel, in the rough state 6953 Other tools for use in the hand
6811 Silver, unwrought, unworked or semi-manufactured 6954 Interchangeable tools for hand & machine tools
6812 Platinum and other metals of the platinum group
THE MACHINERY INDUSTRY
7111 Steam & other vapour generating boilers 7821 Motor vehicles for transport of goods/materials
7112 Auxiliary plant for use with boilers, of 711.1- 7822 Special purpose motor lorries and vans
7119 Parts of boilers & aux.plant of 711.1-/711.2- 7831 Public-service type passenger motor vehicles etc.
7126 Steam & other vapour power units, steam engines 7832 Road tractors and semi-trailers
7129 Parts of the power units of 712.6- 7841 Chassis fitted with engines for motor vehicles
7131 Internal combustion piston engines for aircraft 7842 Bodies for the motor vehicles of 722/781/782/783
7132 Int.combustion piston engines for propelling veh. 7849 Other parts & accessories of motor vehicles
7133 Int.combustion piston engines for marine propuls. 7851 Motorcycles, auto-cycles and cycles with an aux.mot
7138 Int.comb.piston engines, n.e.s. 7852 Cyles, not motorized
7139 Parts of int.comb.piston engines of 713.2-/3-/8- 7853 Invalid cariages, motorized or not, parts
7144 Reaction engines 7861 Trailers & specially designed containers
7148 Gas turbines, n.e.s. 7868 Other vehicles, not mechanically propelled, parts
7149 Parts of the engines & motors of 714--and 718.88 7911 Rail locomotives, electric
7161 Motors & generators, direct current 7912 Other rail locomotives; tenders
7162 Elect.motors & generators, generating sets 7913 Railway & tramway coaches, vans, trucks etc.
7163 Rotary converters 7914 Railway & tramway passenger coaches & luggage vans
7169 Parts of rotating electric plant 7915 Rail&tramway freight and maintenance cars
7187 Nuclear reactors and parts 7919 Rail&tramway track fixtures&fittings, signall.equi.
7188 Engines & motors, n.e.s.such as water turbines etc. 7921 Helicopters
7211 Agricultural & horticul.mach. for soil preparat. 7922 Aircraft not exceeding an unladen weight 2000 kg
7213 Dairy machinery and parts 7923 Aircraft not exceeding an unladen weight 15000 kg
7219 Agric.mach.& appliances, n.e.s.and parts 7924 Aircraft exceeding an unladen weight of 15000 kg
7224 Wheeled tractors, not including in 744.11/783.2- 7929 Parts of heading 792--, excl.tyres, engines
7233 Road rollers, mechanically propelled 7931 Warships of all kinds
7234 Construction and mining machinery, n.e.s. 7932 Ships, boats and other vessels
7239 Parts of the machinery of 723.41 to 723.46 7933 Ships, boats and other vessels for breaking up
Appendix B
The average Grubel-Lloyd measures for the forest, metal and machinery industry.
Year 1980 1981 1982 1983 1984 1985 1986 1987 Forest 0.124673 0.125806 0.128424 0.127304 0.131083 0.132559 0.130291 0.139729 Metal 0.376781 0.382242 0.373273 0.362391 0.380414 0.391488 0.391559 0.383738 Machinery 0.248303 0.266626 0.246168 0.28545 0.297812 0.319135 0.275914 0.299257 Year 1988 1989 1990 1991 1992 1993 1994 1995 Forest 0.149436 0.158463 0.147566 0.14878 0.154903 0.153123 0.153162 0.139348 Metal 0.417682 0.403799 0.389589 0.397968 0.396455 0.41025 0.395413 0.444729 Machinery 0.323393 0.334114 0.340525 0.342956 0.346739 0.338651 0.343455 0.394393 Year 1996 1997 1998 1999 2000 2001 2002 Forest 0,144954 0,158455 0,16567 0,159903 0,162208 0,161388 0,16917 Metal 0,40425 0,366628 0,366472 0,369314 0,346047 0,365318 0,352 Machinery 0,362308 0,40375 0,397265 0,458854 0,404694 0,38896 0,402461
The average Grubel-Lloyd measures when adding Denmark, Finland, France, Germany, Netherlands, and UK together, in respective industry.
Year 1980 1981 1982 1983 1984 1985 1986 1987 Forest 0.187849 0.185081 0.187894 0.184468 0.186214 0.196059 0.193874 0.208064 Metal 0.513607 0.504539 0.499787 0.501639 0.511435 0.503512 0.51743 0.511642 Machinery 0.317505 0.358817 0.332924 0.351863 0.361828 0.374462 0.322873 0.356156 Year 1988 1989 1990 1991 1992 1993 1994 1995 Forest 0.225866 0.234753 0.234219 0.249651 0.256256 0.255492 0.257445 0.23327 Metal 0.539752 0.518079 0.511152 0.511182 0.517431 0.518433 0.484505 0.525924 Machinery 0.398763 0.378066 0.436934 0.470347 0.483798 0.452259 0.458902 0.502233 Year 1996 1997 1998 1999 2000 2001 2002 Forest 0.23756 0.258738 0.267523 0.259366 0.258179 0.247228 0.243596 Metal 0.47843 0.454882 0.471807 0.472519 0.457559 0.476312 0.444102 Machinery 0.463034 0.484652 0.452591 0.494169 0.513489 0.47885 0.477238
Appendix C
The weighted Grubel-Lloyd measures of the Swedish intra-industry trade in the forest in-dustry.
Aust Denm Finl Fran Germ Gree Irel Italy Neth Port Spain UK 1980 0.269 0.204 0.440 0.071 0.148 0 0.005 0.024 0.138 .011 0.060 .0126 1981 0.298 0.210 0.471 0.056 0.155 0.021 0.020 0.036 0.113 0.010 0.023 0.105 1982 0.324 0.234 0.431 0.058 0.182 0.001 0.009 0.035 0.113 0.020 0.025 0.109 1983 0.321 0.224 0.442 0.051 0.176 0.001 0.013 0.037 0.099 0.026 0.023 0.114 1984 0.331 0.245 0.433 0.050 0.168 0.005 0.029 0.044 0.116 0.027 0.020 0.104 1985 0.311 0.243 0.458 0.064 0.175 0.001 0.020 0.041 0.128 0.009 0.032 0.109 1986 0.302 0.233 0.446 0.081 0.165 0.001 0.020 0.046 0.124 0.008 0.023 0.113 1987 0.307 0.259 0.509 0.089 0.174 0.002 0.028 0.042 0.105 0.022 0.030 0.114 1988 0.307 0.285 0.565 0.073 0.185 0.001 0.037 0.044 0.133 0.018 0.031 0.114 1989 0.352 0.335 0.535 0.096 0.189 0.002 0.046 0.043 0.145 0.019 0.032 0.109 1990 0.249 0.324 0.515 0.105 0.165 0.004 0.027 0.045 0.166 0.012 0.028 0.131 1991 0.181 0.360 0.570 0.117 0.141 0.003 0.020 0.045 0.175 0.019 0.020 0.138 1992 0.185 0.350 0.600 0.123 0.146 0.032 0.032 0.050 0.174 0.033 0.021 0.144 1993 0.147 0.338 0.582 0.152 0.151 0.001 0.030 0.062 0.190 0.033 0.031 0.120 1994 0.153 0.326 0.605 0.150 0.157 0.004 0.027 0.066 0.174 0.014 0.030 0.132 1995 0.141 0.305 0.565 0.136 0.137 0.006 0.040 0.045 0.138 0.013 0.026 0.117 1996 0.167 0.300 0.593 0.133 0.146 0.005 0.028 0.054 0.129 0.026 0.033 0.123 1997 0.200 0.324 0.637 0.155 0.164 0.003 0.022 0.064 0.151 0.031 0.031 0.121 1998 0.222 0.380 0.662 0.135 0.160 0.007 0.016 0.067 0.170 0.050 0.021 0.098 1999 0.208 0.371 0.605 0.126 0.155 0.002 0.027 0.056 0.220 0.050 0.019 0.079 2000 0.227 0.360 0.585 0.135 0.142 0.004 0.037 0.061 0.238 0.046 0.023 0.091 2001 0.237 0.389 0.583 0.123 0.130 0.006 0.040 0.063 0.200 0.070 0.037 0.060 2002 0.307 0.363 0.592 0.107 0.130 0.017 0.060 0.58 0.206 0.075 0.050 0.063
Appendix D
The weighted Grubel-Lloyd measures of the Swedish intra-industry trade in the metal in-dustry.
Aust Denm Finl Fran Germ Gree Irel Italy Neth Port Spain UK 1980 0.464 0.550 0.501 0.432 0.588 0.017 0.206 0.247 0.411 0.191 0.313 0.599 1981 0.452 0.559 0.518 0.402 0.615 0.009 0.300 0.314 0.328 0.179 0.307 0.605 1982 0.437 0.512 0.518 0.400 0.639 0.006 0.242 0.321 0.310 0.180 0.294 0.629 1983 0.463 0.483 0.522 0.411 0.633 0.005 0.154 0.259 0.350 0.184 0.274 0.609 1984 0.401 0.502 0.564 0.374 0.602 0.022 0.121 0.253 0.390 0.308 0.391 0.637 1985 0.434 0.478 0.567 0.428 0.558 0.023 0.114 0.304 0.369 0.371 0.426 0.621 1986 0.398 0.492 0.571 0.461 0.562 0.078 0.105 0.353 0.423 0.334 0.327 0.595 1987 0.392 0.487 0.593 0.448 0.558 0.061 0.141 0.348 0.379 0.284 0.308 0.605 1988 0.455 0.526 0.596 0.510 0.545 0.037 0.205 0.402 0.428 0.320 0.354 0.632 1989 0.370 0.562 0.586 0.465 0.549 0.026 0.170 0.407 0.366 0.323 0.441 0.580 1990 0.410 0.524 0.553 0.464 0.569 0.038 0.160 0.348 0.344 0.245 0.407 0.614 1991 0.460 0.495 0.557 0.491 0.560 0.050 0.173 0.339 0.346 0.262 0.424 0.618 1992 0.461 0.483 0.630 0.530 0.593 0.033 0.188 0.329 0.347 0.264 0.377 0.636 1993 0.429 0.471 0.612 0.530 0.583 0.094 0.357 0.364 0.353 0.171 0.397 0.561 1994 0.448 0.434 0.548 0.491 0.567 0.135 0.219 0.385 0.397 0.231 0.420 0.471 1995 0.609 0.468 0.562 0.527 0.549 0.131 0.365 0.419 0.469 0.197 0.460 0.581 1996 0.540 0.500 0.530 0.495 0.489 0.111 0.343 0.430 0.455 0.211 0.344 0.402 1997 0.509 0.473 0.535 0.481 0.499 0.096 0.195 0.345 0.407 0.213 0.313 0.334 1998 0.462 0.453 0.511 0.521 0.543 0.208 0.127 0.380 0.422 0.168 0.221 0.380 1999 0.450 0.466 0.536 0.568 0.517 0.283 0.130 0.381 0.430 0.141 0.212 0.319 2000 0.467 0.461 0.512 0.534 0.520 0.120 0.081 0.365 0.410 0.070 0.304 0.308 2001 0.434 0.528 0.555 0.546 0.533 0.107 0.216 0.381 0.446 0.112 0.275 0.249 2002 0.427 0.557 0.515 0.493 0.497 0.114 0.231 0.355 0.396 0.141 0.292 0.207
Appendix E
The weighted Grubel-Lloyd measures for the Swedish intra-industry trade in the machinery industry.
Aust Denm Finl Fran Germ Gree Irel Italy Neth Port Spain UK 1980 0.228 0.391 0.334 0.349 0.299 0.003 0.113 0.502 0.303 0.036 0.192 0.229 1981 0.287 0.395 0.402 0.469 0.288 0.003 0.053 0.494 0.334 0.034 0.174 0.265 1982 0.285 0.398 0.367 0.0.437 0.267 0.005 0.067 0.392 0.273 0.050 0.164 0.255 1983 0.240 0.427 0.354 0.419 0.283 0.008 0.052 0.492 0.413 0.103 0.418 0.214 1984 0.223 0.403 0.354 0.483 0.324 0.007 0.064 0.444 0.359 0.212 0.452 0.248 1985 0.331 0.415 0.358 0.526 0.269 0.002 0.216 0.577 0.408 0.147 0.310 0.270 1986 0.312 0.384 0.296 0.450 0.271 0.011 0.117 0.576 0.333 0.099 0.258 0.203 1987 0.320 0.481 0.373 0.400 0.266 0.033 0.162 0.654 0.322 0.054 0.230 0.294 1988 0.294 0.579 0.409 0.471 0.276 0.042 0.183 0.603 0.330 0.106 0.260 0.326 1989 0.373 0.507 0.425 0.370 0.311 0.038 0.172 0.701 .3267 0.118 0.338 0.389 1990 0.358 0.528 0.495 0.456 0.371 0.035 0.182 0.450 0.285 0.169 0.270 0.487 1991 0.401 0.544 0.370 0.643 0.478 0.008 0.058 0.347 0.305 0.129 0.351 0.482 1992 0.362 0.547 0.465 0.657 0.471 0.013 0.196 0.306 0.348 0.099 0.282 0414 1993 0.386 0.504 0.478 0.517 0.507 0.010 0.136 0.360 0.326 0.160 0.298 0.381 1994 0.409 0.409 0.489 0.580 0.415 0.002 0.058 0.328 0.409 0.137 0.434 0.450 1995 0.566 0.532 0.503 0.466 0.368 0.081 0.287 0.285 0.570 0.156 0.344 0.574 1996 0.420 0.512 0.452 0.440 0.321 0.053 0.236 0.307 0.440 0.184 0.368 0.614 1997 0.406 0.534 0.454 0.440 0.351 0.117 0.283 0.317 0.443 0.322 0.491 0.578 1998 0.636 0.524 0.560 0.429 0.357 0.180 0.122 0.323 0.320 0.266 0.522 0.526 1999 0.647 0.560 0.550 0.470 0.429 0.158 0.482 0.474 0.357 0.257 0.523 0.598 2000 0.400 0.583 0.437 0.587 0.481 0.214 0.122 0.367 0.443 0.254 0.419 0.551 2001 0.539 0.562 0.476 0.421 0.423 0.029 0.111 0.459 0.506 0.253 0.403 0.486 2002 0.613 0.556 0.472 0.404 0.403 0.014 0.126 0.436 0.453 0.313 0.463 0.478