VTI rapport 586A Published 2007
www.vti.se/publications
Fatigue at sea
A field study in Swedish shipping
Margareta Lützhöft Birgitta Thorslund
Albert Kircher Mats Gillberg
Publisher: Publication:
VTI rapport 586A
Published: 2007 Project code: 40607 Dnr: 2005/0324-26
SE-581 95 Linköping Sweden Project:
Fatigue at sea
Author: Sponsor:
Margareta Lützhöft, Birgitta Thorslund, Albert Kircher, Mats Gillberg
VINNOVA, The Swedish Mercantile Marine Foundation, Martime Safety Inspectorate, Wallenius Marine, World Maritime University, UKHO.
Title:
Fatigue at sea – A field study in Swedish shipping
Abstract (background, aim, method, result) max 200 words:
The purpose of this study was to collect data about the fatigue level of bridge watch keepers to use for revising earlier sleep models, and devise innovative solutions for the shipping industry.
Data collection included interviews with shipping companies and a field study onboard 13 cargo vessels. 32 participants took part in representing two watch systems; 2-watch and 3-watch. Subjective sleepiness and stress estimations were performed once every hour. EOG was used to record eye movement
behaviour. Reaction time test was made to examine performance.
3-watch participants are more satisfied with their working hours and working situation. Tendencies indicate that 2-watch participants are a bit more tired, whereas the stress is the same. All are less sleepy and less stressed at home. Time on shift had effect on sleepiness. The highest KSS scores were recorded in the late night and early morning. After night shift the reaction times have higher variance and more long reaction times are present. The mean value after night shift was significantly higher than after day shift.
All thirteen shipping companies agreed that officers on the bridge always have tasks sensitive to fatigue but no company experienced fatigue as a problem during normal conditions. All were positive to
monitoring devices, mentioning safety matters.
Utgivare: Publikation:
VTI rapport 586A
Utgivningsår: 2007 Projektnummer: 40607 Dnr: 2005/0324-26 581 95 Linköping Projektnamn: Fatigue at sea Författare: Uppdragsgivare:
Margareta Lützhöft, Birgitta Thorslund, Albert Kircher, Mats Gillberg
VINNOVA, Stiftelsen Sveriges Sjömanshus, Sjöfartsverket, Wallenius Marine, World Maritime University, UKHO.
Titel:
Trötthet ombord – En fältstudie inom Svensk sjöfart
Referat (bakgrund, syfte, metod, resultat) max 200 ord:
Syftet med denna studie var att samla kvantitativa data om trötthetsnivån bland styrmän ombord att användas för revidering av tidigare sömnmodeller och för nya innovativa lösningar för sjöfartsindustrin. Datainsamlingen bestod av intervjuer med rederier och en fältstudie på 13 lastbåtar. Deltagande var 32 personer som representerade två vaktsystem; tvåvakt och trevakt. Subjektiva skattningar av sömnighet och stress gjordes en gång i timman. EOG användes för att mäta ögonrörelser. Reaktionstidstest användes för att mäta prestation.
Deltagare i trevaktsystemet är mer tillfreds med arbetstider och arbetssituation. Tendenser indikerar att deltagare i tvåvaktssystemet är lite tröttare medan stressnivån är densamma. Deltagarna i båda
vaktsystemen är mindre sömniga och mindre stressade hemma. Tiden på skiftet påverkade sömnigheten. De högsta KSS-värdena gavs sent på natten och tidigt på morgonen. Reaktionstidstestet gav större varians efter nattskift och även fler långa reaktionstider återfanns då. Medelvärdet var signifikant högre än efter dagskift.
Alla tretton rederier var eniga om att styrmän på bryggan alltid har uppgifter som är känsliga för sömnighet, men ingen såg det som ett problem under normala förhållanden. Samtliga är positiva till övervakningssystem och uppger sjöfartssäkerhet som främsta orsak.
Acknowledgements
We thank all who have assisted us in performing of this study.
Many besides the authors have helped with data collection and analysis. We thank Helena Pernler and Jens Nilsson, Karolinska institutet, Anna Dahlgren, SIRC, Ulf Almquist, Björn Peters, Jerker Sundström, Eva Jacobson and Janet Yakoub, VTI. World Maritime University has contributed with, among much else, a literature study.
The reference group has been very supportive. The reference group contained
representatives from the Swedish Maritime Administration, The Swedish Shipowners’ Association, the Swedish Ship Officers’ Association, the Merchant Marine Officers’ Association, the Swedish Maritime Pilots’ Association, SEKO Seafarers’ branch, the Swedish Work Environment Authority and the Swedish Navy. Thank you!
We are very grateful to the shipping companies which have helped us with contacts and the personnel on the ships have been welcoming and hospitable. Not least we thank the participants who have let us into their work places or volunteered for the interviews. Main financing was provided by VINNOVA (Swedish Governmental Agency for Innovation Systems) the Swedish Mercantile Maritime Foundation and the Swedish Maritime Administration. Support from the study has also been given by Wallenius Marine, World Maritime University and the UKHO (United Kingdom Hydrographic Office).
Linköping September 2007
Margareta Lützhöft
Quality review
Review seminar was carried out on 15 June 2007 where Håkan Alm, Luleå University of Technology, reviewed and commented on the report. The authors have made
alterations to the final manuscript of the report 1 July 2007. The research director of the project manager Lena Nilsson examined and approved the report for publication on 12 September 2007.
Kvalitetsgranskning
Granskningsseminarium genomfört 15 juni 2007 där Håkan Alm, Luleå Tekniska Universitet var lektör. Författarna har genomfört justeringar av slutligt rapportmanus 1 juli 2007. Projektledarens närmaste chef Lena Nilsson har därefter granskat och godkänt publikationen för publicering 12 september 2007.
Table of contents
Abreviations... 5 Summary ... 7 Sammanfattning ... 11 1 Introduction ... 13 2 Background... 142.1 Fatigue and sleepiness ... 14
2.2 Fatigue on board... 17 2.3 Background summary ... 19 3 Purpose ... 20 4 Method... 21 4.1 Field study ... 21 4.2 Interviews... 27 5 Data analysis ... 30 5.1 Health questionnaires ... 30
5.2 Sleep and awake diaries... 30
5.3 EOG, KSS and stress data ... 30
5.4 Data overview ... 34 5.5 Actiwatch ... 37 6 Results... 38 6.1 Field study ... 38 6.2 Actiwatch results ... 59 6.3 Interviews... 60 7 Discussion ... 63 7.1 Method discussion ... 63
7.2 Results field study discussion ... 64
7.3 Was the purpose fulfilled?... 72
8 Conclusions ... 73
References ... 75 Appendix 1 Information about the study
Appendix 2 Questionnaire concerning general health Appendix 3 Sleep Diary
Abbreviations
AMSA Australian Maritime Safety Authority
DP Dynamic Positioning
EEG Electroencephalography EMG Electromyography EOG Electrooculography IMO International Maritime Organization KI Karolinska Institute KSS Karolinska Sleepiness Scale MAIB Marine Accident Investigation Branch PERCLOS Percent Eye Closure
SD Standard Deviation
SMA Swedish Maritime Administration SWP Sleep/Wake Predictor
Fatigue at sea – A field study in Swedish shipping
by Margareta Lützhöft, Birgitta Thorslund, Albert Kircher and Mats Gillberg* VTI (Swedish National Road and Transport Research Institute)
SE-581 95 Linköping Sweden
Summary
There is no standardized methodology for the recording of sleepiness or fatigue, in individuals driving a vehicle. However, there are recording techniques that have been commonly used e.g. EEG (electrical brain waves) and, in most cases, EOG (eye
movements). Another technique refers to subjective ratings which is the simplest way of measuring driver sleepiness. The Karolinska Sleepiness Scale (KSS) is a nine-graded scale (1 very alert and 9 very sleepy) where signs of sleepiness increase considerably at the level of 8 and 9. Working on a ship’s bridge means in most instances working irregular work hours, including night work. There are negative effects of irregular work hours, which are mainly a consequence of two factors – the biological 24h-hour rhythm and sleep loss.
The purpose of this study was to collect quantitative data about the fatigue level of bridge watch keepers on board ships, using several methods and techniques. This data corpus will be used to revise earlier sleep models, and to devise innovative solutions for the shipping industry. The ultimate purpose was to construct solutions that lead to safe manning of ships while acknowledging economical constraints.
The data collection consisted of interviews with shipping companies and a field study performed during visits (3–5 days) onboard 13 cargo vessels of different types, such as bulk carriers, car carriers and tankers. Four types of instruments were used for data collection during the onboard visits; questionnaires and diaries, EOG, activity meters and reaction time tests. Originally there were 32 participants in the study, but due to loss of data only 30 were included in the analyses. Two watch systems were included; the two-watch 6 on/6 off and the three-watch 4 on/8 off systems.
The participants answered a questionnaire concerning general health. Sleep quality was measured by filling in sleep diaries after each period of sleep, including sleep on daytime off-duty periods. Subjective sleepiness estimations were performed once every hour using KSS. Participants were at the same time asked to rate their level of
experienced stress, on a similar 9-point scale. EOG was measured with electrodes placed at five places around the eyes. The technique was used to record eye movement behaviour in the horizontal and vertical directions. A reaction time test was given to the participants to examine differences in performance after daytime and night time
watches.
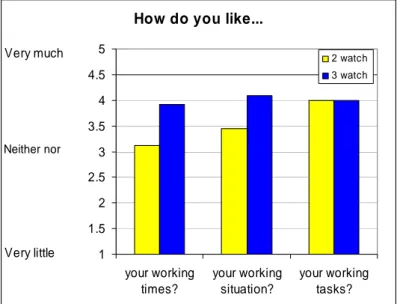
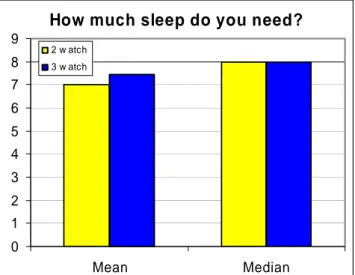
The main result is that, although no statistical difference was found, all tendencies point in the same direction: there are higher levels and effects of fatigue on two-watch ships. Participants in the three-watch system are more satisfied with their working hours and working situation than participants in the two-watch system. Both watches are similarly satisfied with their working tasks. Tendencies suggest that participants in the two-watch system more often get less than 6 hours sleep a day, more often nod off and more often
fight against sleep than participants in the three-watch system. Most participants think they need at least eight hours sleep a day. Tendencies suggest that the participants in the two-watch system are a bit more tired, especially in the early morning and in the
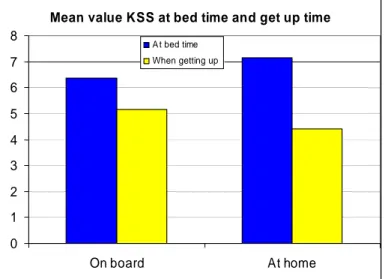
afternoon, whereas the stress level is about the same. The mean values also indicate that both watches are less sleepy and less stressed at home than on board. The results
indicate that participants are more tired when going to sleep at home than on board and more rested when getting up at home than on board. Tendencies show that both sleep quality and sleep length is better at home than on board but no significant difference was found.
The mean KSS scores increased somewhat during shift hours. A tendency towards higher KSS scores in the two-watch system is evident, especially at the end of shift. The highest percentage of KSS scores over 5 was scored when the participants worked longer than the planned shift. The last working hour for both shift systems only KSS scores over 5 were scored. This shows that time on shift affects sleepiness. There is a tendency that the two-watch system leads to higher KSS mean values. two-watch participants were also more fatigued at the end of shift than three-watch participants. The highest KSS scores were recorded in the late night and early morning hours. Night time hours induced higher tiredness than day time work. The two-watch led to a larger amount of high KSS scores. In 2.7% of all scores participants had difficulties in staying awake (8 or 9) and in 82% of these the participant worked in two-watch.
We have reason to believe that participants have rated their own sleepiness a bit carefully. Some have expressed worries about being in a study and feeling observed. We had expected greater differences between KSS values sleep quality and sleep length at home and on board. The reason for the small differences could possibly be explained by the suspicion of low ratings in general but also by the fact that ratings were given at home the first three days after a long on board period and this is not entirely
representative for the total home period.
Most ratings over 7 come from two-watch participants and most from the night shifts. KSS scores at watch-change are high and can possibly be explained by the fact that the mate starting just woke up and the mate getting off is on his way to bed. With more shifts worked the participants get more tired. Some filled in the diary every hour. Others might fill in afterwards, for a few hours, or for a whole watch. These different strategies may have influenced the scoring.
After the night shift the reaction time scorings have higher variance and more scorings with long reaction times are present. The mean value after night shift was significantly higher than after day shift. Only a slight tendency to higher values for the two-watch was found. The high variance after night shifts is similar to that seen when testing for alcohol levels over 4 parts per thousand. Generally it can be said that participants scored higher reaction times after a night shift than after a day time shift. This has been shown before in many domains, and here, again, it is shown that humans are not made for night work.
All thirteen companies in the interviews agreed that officers on the bridge always had tasks that were sensitive to fatigue but no company experienced fatigue as a problem during normal conditions. All are aware of the fatigue problem, but some of them do not believe it is a large problem. Many ships have a warning system where the crew has to
devices, but the equipment must be comfortable to wear and the crew has to know the reason why they should wear it. Seven of the companies are willing to buy such
equipment. Maritime safety matters were the most common cause for these answers and a good functionality was another.
Trötthet ombord – En fältstudie inom svensk sjöfart
av Margareta Lützhöft, Birgitta Thorslund, Albert Kircher och Mats Gillberg* VTI
581 95 Linköping
Sammanfattning
Det finns ingen standardmetod för att mäta trötthet eller sömnighet på förare, men det finns några mätmetoder som brukar användas. En av dessa är EEG (elektriska hjärn-vågor) som ofta används tillsammans med EOG (ögonrörelser). En annan metod bygger på subjektiva skattningar vilket är det enklaste sättet att mäta förartrötthet. Karolinska sleepiness scale (KSS) är en niogradig skala (1=extremt pigg och 9=extremt trött) där tecken på trötthet ökar avsevärt vid nivåerna 8 och 9. Att arbeta på bryggan på en båt innebär oftast oregelbundna arbetstider och nattarbete. Detta har negativ påverkan på kroppen främst beroende på kroppens biologiska 24-timmars rytm och sömnbrist. Syftet med denna studie var att samla kvantitativa data om trötthetsnivån bland styrmän ombord genom att använda olika metoder och tekniker. Denna datamängd kommer att användas för att revidera tidigare sömnmodeller och för att tänka ut innovativa lösningar för sjöfartsindustrin. Det övergripande syftet var att konstruera lösningar som leder till säker manövrering av fartygen och samtidigt ta hänsyn till ekonomiska restriktioner. Datainsamlingen bestod av intervjuer med rederier och en fältstudie som genomfördes under besök på 13 lastfartyg av olika typ, som bulk-, bil- och tankfartyg. Fyra olika metoder användes för insamling av data ombord; enkäter och dagböcker, EOG, aktivi-tetsmätare och reaktionstidstest. Ursprungligen deltog 32 personer i studien, men på grund av databortfall inkluderades bara 30 i analysen. Två vaktsystem var represen-terade; tvåvakt 6 h på/6 h av och trevakt 4 h på/8 h av.
En generell hälsoenkät delades ut till deltagarna. Sömnkvalitet mättes med hjälp av sömndagböcker som fylldes i efter varje sömnperiod, även efter sömn på frivakten på dagtid. Deltagarna gjorde även subjektiva skattningar av sömnighet en gång i timman med hjälp av KSS-skalan och ombads samtidigt skatta sin stressnivå på en liknande niogradig skala. EOG mättes med elektroder placerade på fem punkter runt ögonen. Tekniken användes för att mäta horisontella och vertikala ögonrörelser. Ett reaktions-tidstest genomfördes för att undersöka skillnader i prestation efter dagskift och nattskift. Ett sammanfattande resultat är att, trots att det inte statistiskt säkerställts, alla tendenser pekar i samma riktning: nivåerna och effekterna av trötthet på tvåvaktsfartyg är högre. Deltagare i trevaktsystemet är mer tillfreds med sina arbetstider och sin arbetssituation än deltagare i tvåvaktssystemet. Båda vaktsystemen är lika nöjda med sina arbetstider. Tendenser visar att deltagare i tvåvaktsystemet oftare får mindre än 6 timmars sömn per dag, oftare nickar till och oftare kämpar mot sömnen än deltagarna i trevaktsystemet. De flesta tycker att de behöver minst 8 timmars sömn per dag. Tendenser visar också att deltagare i tvåvaktssystemet är lite tröttare, speciellt tidigt på morgonen och på efter-middagen, medan stressnivån är ungefär densamma för båda vaktsystemen. Medel-värdena indikerar även att deltagarna i båda vaktsystemen är mindre sömniga och mindre stressade hemma än ombord. De är också sömnigare när de går och lägger sig
och mer utvilade när de går upp hemma än ombord. Tendenser visar att både sömn-kvalitet och sömnlängd är bättre hemma än ombord, men inga signifikanta skillnader fanns.
Medelvärdena av KSS ökade något under nattskiften. En tendens mot högre värden i tvåvaktsystemet är tydlig, speciellt i slutet på skiftet. Högst procent KSS-skattningar över 5 gavs när deltagarna arbetade längre än det planerade skiftet. Den sista arbetstimman för båda skiften hade bara KSS-skattningar över 5. Detta visar att tiden på skiftet påverkar sömnigheten. Tvåvaktsystem tenderar att ge högre KSS-medelvärden. Styrmännen från tvåvakt var också sömnigare i slutet på skiftet än de från trevakt. De högsta KSS-värdena gavs sent på natten och tidigt på morgonen. Nattarbete inducerade högre sömnighet än dagarbete. Tvåvaktssystemet fick större antal höga KSS-skatt-ningar. Svårigheter att hålla sig vaken angavs i 2,5 % av skattningarna och i 82 % av dessa arbetade deltagaren i tvåvakt.
Vi har anledning att tro att deltagare skattat sin egen sömnighet något försiktigt. Några har uttryckt oro över att vara med i en studie samt över att vara observerade. Vi hade förväntat oss större skillnader mellan KSS-värden, sömnkvalitet och sömnlängd hemma och ombord. Anledningen till de små skillnaderna skulle kunna förklaras med misstan-ken om låga skattningar generellt, men också av det faktum att skattningarna hemma gavs de tre första dagarna hemma efter en lång ombordvistelse och därför kanske inte är så representativa för hemmaperioden.
De flesta skattningar över 7 kommer från tvåvakt och oftast från nattskift. KSS-skattningar vid vaktskifte är höga och kan troligtvis förklaras av att den styrman som börjar sitt skift just har vaknat och den som slutar sitt skift är på väg att lägga sig. Med fler arbetade skift blir deltagarna mer trötta. Några fyllde i sömndagboken varje timma, andra fyllde i efter några timmar eller för en hel vakt. Dessa olika strategier kan ha påverkat skattningarna.
Reaktionstidstestet gav större varians efter nattskift och även fler långa reaktionstider återfanns då. Medelvärdet av reaktionstiderna var signifikant högre efter nattskift än efter dagskift. Bara en tendens till högre värden för tvåvaktssystemet fanns. Den högre variansen efter nattskiften är en typ av varians man även ser vid alkoholtester, vid utslag över 0,4 promille. Generellt kan sägas att deltagarna hade längre reaktionstider efter nattskift. Det har visats förut i många sammanhang och här visas igen att människan inte är gjord för nattarbete.
Alla tretton rederier som deltog i intervjuerna var eniga om att styrmän på bryggan alltid har uppgifter som är känsliga för sömnighet, men ingen såg det som ett problem under normala förhållanden. Alla är medvetna om att problemet med sömnighet finns, men en del av dem tror inte att det är ett stort problem. Många fartyg har varningssystem där besättningen måste trycka på en knapp var 30:e min. Två av rederierna tyckte att det systemet är väldigt störande för arbetande besättning och skulle hellre se ett som initierades först när personen blir trött. Samtliga rederier är positiva till övervaknings-system, men utrustningen måste vara bekväm att bära och besättningen måste veta anledningen till att de ska ha den. Sju av rederierna är villiga att köpa sådan utrustning. Sjösäkerhet angavs som den vanligaste orsaken till detta men även bra funktionalitet.
1 Introduction
This document presents results of parts of the Fatigue at sea project performed during 2005–2007. The purpose of the project as a whole was to collect subjective and
objective data useable for a thorough investigation of sleepiness, stress and performance levels of watch keeping officers on Swedish ships. The project consists of several parts:
1. A literature review.
2. Work and rest hours logging. We wished to collect data on seafarers’ real working hours in parallel with, but separate from, the field study. There are suspicions that work and rest regulations are not followed.
3. An onboard study, measuring physiological data to compare the two-watch system to the three-watch system.
4. A simulator study in which 10 seafarers “sailed” the two-watch system for 6 days
5. An interview series with shipping companies
6. A study of marine pilots, boatmen and VTS, bridge and lock operators at the Swedish Maritime Administration working in a shift system
7. Evaluation and verification, including recommendations.
In this report, the onboard (field) study and the interviews will be presented. All parts of the study are discussed briefly below.
1. Literature review. As the subject is of a current large interest, and a number of good reviews exist (and are in progress), we focused on a limited review and looked also at existing regulations. It is available on www.vti.se/fatigueatsea. 2. Work/rest logging. Students at Kalmar Maritime Academy performed a final
year project in 2006 (in Swedish) called “Trötthetsfaktorer till sjöss”. The Nautical Institute (endorsing the present project) also performed a study, available at http://www.nautinst.org/fatigue/index.htm.
3. An on-board field study, preceded by pilot studies. The main results are presented in this report.
4. A ship simulator study was performed, in order to gather data on 6x6 watches in a controlled environment. A separate report is in preparation.
5. Shipping company interviews. Presented in this report.
6. A study of work and rest hours on marine pilots, boatmen and VTS, bridge and lock operators in Sweden. The results are published as a separate report in Swedish, available at www.vti.se/fatigueatsea.
7. Evaluation, verification, recommendations. Recommendations are being evaluated and will be published in a separate report. In that same report the Karolinska Institute Sleep/Wake Predictor (SWP) will be discussed. It has for instance been used to evaluate some of the recommendations. Data from this project will be incorporated into the SWP.
2 Background
This background reviews fatigue, sleepiness and drowsiness on a general level and for drivers; it describes current measures of fatigue, their benefits and drawbacks. We end by specifically discussing fatigue on board ships and the related risks both for
individuals and for maritime safety.
2.1
Fatigue and sleepiness
In the literature, terms such as fatigue, sleepiness and drowsiness are used
interchangeably. In USA, the term fatigue is often used in the driver context, whereas European researchers often prefer the terms sleepiness and drowsiness. Nevertheless, the concepts sleepiness, drowsiness and fatigue all seem to refer to the driver’s level of wakefulness and whether the driver has shown signs of falling asleep at the wheel. Sleepiness is operationally defined as a physiological drive to sleep. This is the latent, fundamental type of sleepiness that in some cases can be masked by surrounding factors, such as social interaction, stress, physical activity, coffee etc., and result in manifest sleepiness. Hence, the manifest (experienced) sleepiness is often lower than the latent (actual) sleepiness. However, during certain driving conditions, e.g.
monotonous driving on a boring road, contextual factors increase the manifest level of sleepiness beyond the underlying, latent level of sleepiness and drivers feel more sleepy because of being bored. In reality, the short-term variation in sleepiness may often be determined by environmental factors, which can both increase and decrease the sleepiness level. Thus, sleepiness (particularly subjective ratings) is to a large extent context dependent (Eriksen, Åkerstedt, & Kecklund, 2005). As a consequence, one may perceive oneself as being fairly alert because of masking. But when masking is
removed, a dramatic and surprising increase in sleepiness will be experienced. Taking context related factors into account, driver sleepiness can be seen as the lack of ability to maintain a wakeful state of attention without the aid of the situational factors. Definitions of fatigue usually include the inability or disinclination to continue an activity, generally because the activity has, in some way, been going on for “too long”. This may be due to an earlier activity, exhausting resources that normally recover. One can conceive of different kinds of fatigue, such as local physical fatigue (e.g. in a skeletal muscle), general physical fatigue, mental fatigue (e.g. following sustained attention due to a long-lasting high mental workload) or “central nervous system” fatigue (sleepiness). Thus, fatigue is often considered to be a generic term of which sleepiness is one of the major sub-components. In a driving context, sleepiness and mental fatigue are the most relevant fatigue components.
2.1.1 Driver fatigue
Falling asleep when driving is a prevalent phenomenon that has severe implications for traffic safety. In a field study on truck drivers, 7% of the driving time included sleepy driving measured with video recordings of the drivers’ face (Mitler, Miller, Lipsitz, Walsch, & Wylie, 1997). Mitler and co-workers also reported clear individual
differences in sleepy driving. A minor group of 8 drivers accounted for more than 50% of the sleepy driving epochs. Moreover, 44% of the drivers showed no sleepiness signs
Sleepy driving accidents have been estimated to be involved in at least 15–20% of the accidents (Horne & Reyner, 1996). Norwegian data of in-depth accident investigations showed that sleepiness was involved in 29% of the crashes, which was more than alcohol related accidents (11%) (Moe, 1999). Recently, the 100-car study, in which approximately 100 cars were monitored during a year, showed that sleepy driving resulted in 4 to 6 times higher accident/near-accident risk compared to baseline driving when the driver was in an alert state with high level of attention (Klauser, Dingus, Neale, Sudweeks, & Ramsey, 2006). The prevalence of sleep related accidents (including near accidents) was estimated to 22–24%.
2.1.2 Measurements of fatigue
There is no standardized methodology for the recording of sleepiness, and for the quantification of involuntary sleep, in individuals driving a vehicle. However, there are five recording techniques that have been commonly used (Ji, Zhu, & Lan, 2004). One technique is based on the recording of EEG (electrical brain waves) and, in most cases, EOG (eye movements), (Lal & Craig, 2002). EMG (muscle tension) may also be used, although it is often excluded due to interference with the driving task.
Another common technique that has received a lot of attention with respect to driver sleepiness, is camera based eye movement recordings (Barr, Popkin, & Howarth, 2005). This technique is more feasible in many driving studies since it is contact-less and suitable for on-line analysis (Ji et al., 2004). The eyes are recorded with cameras in order to acquire video images of the driver. The visual cues of sleepiness are mainly eye blinking, including blink frequency, blink duration, long closure time, pupil diameter, gaze and sometimes also saccadic eye movements.
A third technological category refers to behavioural signs of sleepiness, such as body movements, gestures, facial tone and head movements (Wierwille & Ellsworth, 1994). The head is measured with cameras and the recordings are subjected to video image analysis or to observer ratings. The indicators of sleepiness are a sluggish and
expressionless facial tone, yawning, nodding (head tilts) and a sagging body posture. A fourth category refers to driving parameters associated with performance impairment during sleepy driving (Brookhuis et al., 1998). It is well known that sleepy driving is associated with impaired driving performance. Since impaired driving should be closely linked to accidents or more serious driving errors it has been tempting to use
performance measures as indices of driver sleepiness (Brookhuis et al., 1998). However, performance measures should be regarded as an indirect measure of driver sleepiness since it reflects the consequences of sleepiness.
A fifth category refers to subjective ratings of sleepiness. Ratings are the simplest way of measuring driver sleepiness. However, it is also of great interest to know more of how drivers’ perceive sleepiness and whether their perception correlates with objective indices of sleepiness.
Eye movements
Many of the variables proposed in the literature as being sensitive to sleepiness and fatigue are related to the blink complex (opening and closing of the eyelid). Thus, it has
fatigue (Stern, Boyer, & Schroeder, 1994). It has also been suggested that blink rate may reflect eye or visual fatigue (Sirevaag & Stern, 2000). However, blink rate is also affected by other factors than sleepiness. For example, blink rate is partly task
dependent (Luckiesh, 1947) and influenced by visual demands (Sirevaag & Stern, 2000). Hence, blink rate should probably be regarded as a rather non-specific indicator of sleepiness.
A more specific parameter of the blink complex is blink duration and long closure blinks. There are many studies showing that blink duration as well as the proportion of long closure blinks increases when subjects are sleepy (Caffier, Erdmann, & Ullsperger, 2003; Sirevaag & Stern, 2000). The increase has also been demonstrated in field and simulator studies of driving or flying (Häkkinen, Summala, Parinen, Tiihonen, & Silvo, 1999; Ingre, Åkerstedt, Peters, Anund, & Kecklund, 2006; Morris & Miller, 1996). There are also other variables such as blink amplitude, lid closure speed and lid re-opening speed that have been considered sensitive to variations in sleepiness. So far, these variables have been studied less than blink rate and blink duration. The results suggest that sleepiness is associated with decreased blink amplitude, lid closing speed and lid re-opening speed (Morris & Miller, 1996; Caffier et al., 2003; Ji et al., 2004). A problem with the blink measures is the large inter-individual differences. (Galley, Schleicher, & Galley, 2004) showed that the changes in blink parameters associated with increasing sleepiness differed a lot between individuals. For example, since the intra-individual correlations with subjective ratings of sleepiness ranged from -0.50 to 0.98 it seems unlikely that blink duration should be the prime indicator of sleepiness for all individuals. Ingre et al. (2006) have also observed large individual differences in blink duration in the response to sleepy driving. Thus, one should not rely on any of the blink metrics alone to characterize the level of sleepiness.
Morris and Miller (1996) have observed strong correlations with specific eye and eyelid movement measures and performance decrements in a flight simulator. In a multiple regression analysis, blink amplitude (decreased), blink rate (increased) and long closure rate (increased) predicted 61% of the variance of certain performance errors. The best predictor was blink amplitude and the authors interpreted the decreased amplitude as a reflector of a lower start point of the eyelids (which may correspond with the subjective feeling of having heavy eyelids). In addition, a decreased saccadic rate was also
associated with increased errors. This finding was interpreted as reflecting a general slowing of the arousal system.
Ratings of sleepiness
Several rating scales have been used in relation to studies of driver sleepiness. However, the Karolinska Sleepiness Scale (KSS) is the only scale that has been validated in a driving context. KSS is a nine-graded scale (1 very alert and 9 very sleepy, difficulties staying awake, have to fight sleep) that refers to perceived level of sleepiness during the last 5 minutes (or a shorter time interval, (Åkerstedt & Gillberg, 1990)). Normally ratings are collected every 3–5 minutes in simulator studies. In field studies ratings are often collected less frequently (e.g. 1–2 ratings/hour) in order to restrict the interference with the driving task.
position and driving off the road incidents) and blink duration using data collected in the VTI simulator (Ingre, Åkerstedt, Peters, Anund, & Kecklund, 2006). Thus, it seems that rating of 7 (sleepy but no problem to stay awake) is a critical level. Below 7,
physiological and behavioural signs of sleepiness are rare, whereas they increase considerably at the level of 8 and 9.
2.2
Fatigue on board
Working on a ship’s bridge means in most instances working irregular work hours, including night work. There are several categories of irregular working time
arrangements, which have in common that they are used in order to make around-the-clock operations possible. There are negative effects of irregular work hours, which are mainly a consequence of two factors – the biological 24h-hour rhythm and sleep loss. The biological rhythm is stable and adaptation to, for example, night work is therefore slow (cf. also jet-lag). During the night most biological functions, e.g., metabolism, are slowed down, while they reach a peak during the day. The biological rhythm also affects mental functions. When awake during the night mental performance and
alertness is low due to the biological rhythm. In addition the biological rhythm strongly affects sleep. Sleep during the night is easy to initiate and maintain for a sufficient time, while the opposite is true for sleep during the day. Hence, in connection with night work, sleep which precedes work might be short and sleep loss will be the consequence. The negative effects of sleep loss then add to the negative effects during the night time trough of the biological rhythm.
There is a considerable amount of scientific literature on the effects of such working hours on safety, productivity and health within other industrial settings. A special issue of Occupational & Environmental Medicine is devoted to the subject on a general level ("Fatigue at work," 2003), whereas other studies focus on transportation workers (McCallum, Sanquist, Mitler, & Krueger, 2003). Within the transport industry much interest has been directed to the effect of working hours (especially night work) on safety. For instance, two international symposia could be mentioned. The symposium “Work hours, sleepiness and accidents” was held in 1994 and the symposium “The sleepy driver and pilot” in 2000, both in Stockholm. During the 1994 symposium a consensus statement was formulated which strongly stresses the risks for accidents due to sleepiness/fatigue. The statement was later published in Journal of Sleep Research. Several studies show a markedly increased risk for accidents in connection with night work. A Swedish study showed that the risk for a single vehicle accident is 13 times higher than compared to daytime, and the risk for industrial accidents is doubled (based on Swedish accident data). A number of major industrial accidents have occurred during the night, for example the Three Mile Island, the Chernobyl, and the catastrophe in Bhopal. The grounding of Exxon-Valdez also occurred at night, and fatigue was considered as one of the important factors behind the accident.
The issue has been studied in the maritime industry, for example (Sanquist, Raby, Forsythe, & Carvalhais, 1997) and several studies and recommendations made by government agencies and institutions such as AMSA (1998), IMO (2001), MAIB (2004), Miller, Smith, & McCauley (1998), Rhodes & Gil (2002). There are literature reviews looking into definitions, effects and management strategies, in transportation in general (Boivin, 2000) and specifically for maritime operations (Gander, 2005).
The MAIB (2004) report showed that a third of the ship accidents that took place
between 1994 and 2003, and which were subject to a MAIB investigation or preliminary examination, involved a fatigued officer alone on the bridge at night.
Fatigue at sea and related issues such as stress and overload are more important today than before. Ships’ crews are under pressure from schedules and economy, and have to handle their tasks with an increasingly smaller number of crewmembers. There are several incidents and accidents attributable to fatigue, and the number may in reality be even larger than reported. For instance, a study performed by the Swedish Maritime Administration (SMA) in 2006 indicates this. As shipping is an international business, we believe this to be true for all countries, and perhaps some more than others.
However, fatigue is not only a problem for ships flying a flag of convenience.
Specialised routes may lead to suboptimal work schedules even on high standard ships, and the potential for catastrophic consequences with a fatigued watchkeeper in the wheelhouse is large.
There is also the recent and extensive study performed by Cardiff University (Smith, Allen, & Wadsworth, 2006). This study reports that many factors in combination must be considered to understand fatigue at sea, such as poor quality sleep, negative
environmental factors, high job demands and high stress. Methods used in the Cardiff programme include questionnaires, diaries, vessel motion and noise measurement. A series of measurements were performed onboard, measuring mood, reaction time
(N=22–49), focused attention and a search task. Actiwatches were used to assess quality and length of sleep (N=90–94), and cortisol levels (N=26–46) were measured. They studied the crew on one minibulker and compared it to other ships.
The U.S. Coast Guard performed a fatigue study in which crews on Coast Guard Cutters performed a series of cognitive and motor tasks. Decrements on some measurements of performance were found, such as lapses in vigilance and decreased pattern matching ability (Miller et al., 1998).
However, there are few other published results of field studies of maritime
watchkeepers where physiological variables have been measured, except the almost 20-year old studies performed by Colquhoun and colleagues (Colquhoun et al., 1988). Methods which have been used earlier range from questionnaires, sleep logs and observations to accident analyses. Nonetheless, some issues have not been resolved – firstly there are indications that data collected through subjective methods such as questionnaires or interviews are not convincing enough as they may be perceived as biased or not entirely accurate. Secondly, recommendations for changes have not been effective. The shipping community may not be fully aware of the risks. In a closed voting session at a Swedish maritime day 73% of the participants (all maritime officers) admitted to having fallen asleep one or more times on watch (Lützhöft & Kiviloog, 2003). This shows that careful study planning with methods that guarantee
confidentiality can gain disturbing, but accurate, results.
The Karolinska Institute (KI) has conducted several field studies onboard Swedish naval ships in cooperation with the Swedish Navy(Åkerstedt & Gillberg, 2004). The studies focused on subjective sleepiness and subjective sleep parameters during shorter missions. They studied “6 on, 6 off” schedules, both with traditional watch changes (00h, 06h, 12h, and 18h) and with changes displaced by 3 hours. Also studied was a
sleepiness are higher during the 00–06h watch as a whole (as compared to the other watches) and even rise towards the end. The levels of sleepiness recorded during the night, both in the field studies and the simulator study, reach those recorded during night work in connection with other work places, e.g., industries, road and rail transport. But we must not focus on direct effects of fatigue alone. Aside from the highly
increased risk of accidents on a short-term scale, there is evidence that there are serious long-term health effects of fatigue and sleep deprivation. The whole body is affected, for instance the risk of cardio-vascular problems is increased, which is an already over-represented health problem in the mariner community. The mind is also affected, leading to stress symptoms, lack of concentration and memory degradation.
2.3 Background
summary
Research shows that fatigue is a safety issue, in industries and in different traffic situations and particularly during the night. There is also a large risk for the short- and long-term health of those working in shift systems.
However, there are few studies measuring physiological variables at sea on any large scale, and none of them recent. Since the older studies were performed, crews have in many cases been halved, and workload therefore has increased. There are also
indications that even as technology may have relieved crews of some workload, regulations may have added to it.
There is a lack of ‘hard data’ to support stakeholders in their decision-making, and a lack of recommendations tuned to the needs and constraints of the shipping business. Finding solutions to this problem is constrained from many perspectives: suggestions must not lead to significant extra costs for the concerned parties and stakeholders. The challenge is to find solutions that are effective, economical and easy to use for all involved.
3 Purpose
The project as a whole has an overarching purpose; to highlight the issue of fatigue at sea, and provide data and tools for relevant stakeholders to address the issue.
In this report, we describe and discuss results of the field study and the shipping company interviews.
The purpose of the field study was to collect quantitative data about the fatigue level of bridge watch keepers on board ships, using several methods and techniques.
Specifically, we wished to measure possible differences between the 6/6 and the 4/8 watch system.
The main hypothesis of the study is: shift system 6x6 induces higher sleepiness in the
participants as compared to shift system 4x8. The second main hypothesis is: EOG mean blink duration values correlate positively with KSS scale.
On a longer time-scale, one further purpose is to use the data corpus to refine the Karolinska Institute mathematical model SWP (Sleep/Wake Predictor),
The purpose of the interviews was to discuss with persons in leading positions in shipping companies and shipping agencies their attitude towards fatigue and fatigue monitoring.
We wish to use these results and earlier work to devise innovative solutions for the shipping industry. The ultimate purpose is to construct solutions that lead to safe manning of ships while acknowledging economical constraints. A collection of recommendations, relevant for various stakeholders, will be published separately.
4 Method
This chapter presents and discusses the methods and techniques chosen in this study. Firstly, the field study design, participants, methods and techniques is presented. The preparation of the EOG data is discussed. This is followed by a presentation of the interview study design.
4.1 Field
study
4.1.1 Design of study
The design of this study was a within-subject non-experimental study, where
measurements took place at the participants’ actual workplace and within their ordinary working hours. Due to the low number of participants, the approach was that of a qualitative study, where each participant was his/her own control. There was however the objective of comparing the two watch systems.
The data collection was performed during visits onboard 13 cargo vessels of different types, such as bulk carriers, car carriers and tankers.
To ensure the measurement procedure before the start of the data acquisition, pilot studies were conducted on two ships, one small archipelago passenger vessel and one large passenger cruise ship. The purpose of the pilot studies was to ensure that the measurement procedure did not interfere in an inappropriate way with the participants’ working routines. Furthermore, we wished to ascertain that the measuring equipment used did not interfere with the bridge electronic equipment, nor that the bridge
electronics would disturb the data recording. Neither of these effects was detected in the pilot studies. Although this equipment (Embla/Vitaport) is often used in hospital
environments where for instance ether and oxygen would be expected to be present, we could not attain a 100% guarantee that the equipment was explosion safe. Therefore, when we performed measurements on tankers, the participants did not wear the equipment on deck or outside the accommodation. A further purpose with the pilot studies was to familiarize the test leaders with the procedures and the equipment.
4.1.2 Participants
Choice of participating companies was done on an availability basis. Earlier contacts with shipping companies had shown those positive to participating in research projects. They were also chosen to constitute a good variation in ship and watch type. Ships were chosen in cooperation with the companies, based on availability and willingness of all watch officers to participate. To some degree, we considered trade and time of voyage and thus the possibility to join and leave ships at convenient locations. Originally there were 32 participants in the study, but due to loss of data only 30 were included in the study (29 males and 1 female), with a mean age of 41.5 years (SD=9.9) and a mean experience time of watch going work of 20,1 years (SD=11.6). The onboard visits had durations between 2 to 7 days, and the size of the vessels varied from 2,300 to
11,000 dwt. Prior to the visits, participants were given information about the study by e-mail sent to the company and the ship, see Information about the study, and verbal consent was given for participation. Written consent for participation in the study was given to the test leaders at the beginning of the onboard visit.
4.1.3 Watch systems
Two watch systems were included in this study; the two-watch 6 on/6 off and the three-watch 4 on/8 off systems. The two-three-watch vessels can be divided into two groups, where the first had two watch keepers sharing the watches (pure 6-6), and a watch-free captain who was not involved in the 6 on/6 off system (called here 6-6+1). The second group consisted of those vessels with one mate and the captain sharing the watches. The three-watch vessels (4 on/8 off) had three watch-going mates and one captain. See Table 1 below for the participant distribution in the two watch systems.
Table 1 Participants and watch systems.
two-watch three-watch Participant number 00–06 12–18 06–12 18–24 00–04 12–16 04–08 16–20 08–12 20–24 1 X 2 X 3 X 6 X 7 X 8 X 9 X 10 X 11 X 12 X 13 X 14 X 15 X 16 X 17 X 18 X 19 X 20 X 21 X 22 X 23 X 24 X 25 X 26 X 27 X 28 X 29 X 30 X 31 X 32 X
4.1.4 Choice of measurement techniques
There is no standardized methodology for the recording of sleepiness. However, as mentioned in the background, five recording techniques have been commonly used; recording of EEG and EOG, camera recordings, behavioural signs of sleepiness, driving parameters associated with performance impairment and subjective ratings of
sleepiness. We discuss here the choices made for the field study. One aspect we had to accommodate was that the participants must be able to walk around, as officers
commonly do during their watch. This meant that no cables attached to e.g. computers could be used. It also meant that no recording using a panel-based or fixed technology (e.g. a camera) could be used. Thus, the equipment had to be portable and not too disturbing. Also it had to be possible to attach and detach the equipment in a reasonably short time. We did not want to impose significantly on the free time of the participants as this would disturb the study, nor could we do anything which would divert their attention during their watch.
• One technique is based on the recording of EEG (electrical brain waves) and, in most cases, EOG (eye movements). EMG (muscle tension) may also be used. In the case of the field study, we used EOG. According to experts, EEG is too sensitive when participants move about and EMG is not useful in an uncontrolled field setting.
• Another common technique that has received a lot of attention is camera-based eye movement recordings. This method was not used, again in order not to restrict the movements of the officer on the bridge.
• A third technological category refers to observing behavioural signs of
sleepiness, such as body movements, gestures, facial tone and head movements. This technique was not feasible, since it would either need an observer on the bridge, which would disturb the study, or some type of recording for later analysis, which would mean the operator, would have to stay reasonably still, and not walk around.
• A fourth category refers to driving parameters associated with performance impairment during sleepy driving. This was not used due to the impossibility of controlling the driving/ navigation task.
• A fifth category refers to subjective ratings of sleepiness. The KSS (Karolinska Sleepiness Scale) was used for this purpose. This scale is well-used and
validated.
Four types of instruments were chosen for data collection; questionnaires and diaries, eye movement measurements, activity meters and reaction time tests. They were chosen to ensure useful objective and subjective measures without disturbing the normal
Table 2 Instruments and measures used.
Instrument Measure Variable
Questionnaire Health questions Subjective health
Sleep diary Sleep duration & quality Subjective sleep length and quality
Actiwatch Acceleration Objective sleep length and quality
Awake diary Watch times, KSS Subjective sleepiness
EOG Eye blinks Objective sleepiness
Reaction time Reaction time Reaction time differences
Questionnaires and diaries
In the beginning of the onboard visit, a questionnaire concerning general health was introduced to the participants, see Appendix 2. This included questions about home conditions, health issues, sleep habits etc. Sleep quality was measured by handing out sleep diaries, to each participant, see Appendix 3. The sleep diary was filled in after each period of sleep, including sleep on daytime off-duty periods. The sleep diary has been validated against EEG (Åkerstedt, Hume, Minors, & Waterhouse, 1994).
Subjective sleepiness estimations were performed by the participants once an hour they were awake, using the Karolinska sleepiness scale, KSS, a scale from 1 to 9, where 9 is the highest level of sleepiness. Participants were at the same time asked to rate their level of experienced stress, on a 9-point scale, similar to the KSS. The wording for each scale step was provided on each diary sheet so that the participant easily could connect the scale steps to a certain sensation. See “Awake Diary onboard” for the Awake Diary where also the scales are shown.
Eye movement behaviour (EOG measurements)
EOG (Electrooculography) is a method to record eyeball movements using equipment commonly used in psychophysiological laboratories. The basis is the electrical potential difference between the front and back of the eye (Andreassi, 2000). EOG is a suitable tool for objective characterization of drowsiness (Galley & Schleicher, 2002). For example, an increase of blink duration lengths is related to higher KSS levels in controlled environments, (e.g. a driving simulator) (Ingre et al., 2006). Depending on the type of eye movements to record the electrodes are placed differently. For detection of horizontal motion there is generally one electrode at the outer edge of each eye which gives a binocular recording. Monocular recording is also possible and accomplished by placing electrodes at the inner edges as well. With electrodes above and below the eye vertical movements are measured. Vertical recordings are usually monocular since the eyes move synchronously (Andreassi, 2000; Stern, Ray et al., 2001). The cables are placed so that they do not disturb the test person or can be torn off unintentionally by body movements. The placement of electrodes for horizontal and vertical EOG as well as for EMG is shown in Figure 1.
Figure 1 Electrode placement for measuring EOG and EMG.
In the field study EOG was measured with electrodes placed at five places around the eyes of the participants, ground was placed in the forehead. The technique was used to record eye movement behaviour in the horizontal and vertical directions. Furthermore, in the beginning two optional electrodes were used to record facial EMG, meant for distinguishing of artefacts in EOG data, yawning for example. However these were left out on later trips to shorten application time and since there was no plan of analysing those signals. Disposable electrodes were used to make the application as fast and easy as possible. To ensure an appropriate conductance the skin was rubbed with electrode paste before placing the electrodes, see Figure 2.
The EOG and EMG electrodes were during the first 7 trips connected to an ambulatory medical recorder called Embla (Flaga hf. Medical Devices, Reykjavik, Iceland) rented from the Karolinska Institute. On the 6 later trips VTI’s medical recorder VITAPORT from TEMEC was used instead. The use of different recorders has no influence on data when it comes to the analysis. The advantage of using the VITAPORT is that it allows the test leader to ensure data quality by looking at the signals online, while onboard. Both medical recorders were placed in a bag and carried in a belt around the waist, over the shoulder or where most comfortable, see Figure 3.
Figure 3 Participant with Vitaport equipment.
In this study, EOG and EMG were recorded during the participants’ watches. For every onboard visit, at least two series of physiological data from each participant, including one daytime and one night watch, were recorded. As maximum four data series were recorded on each participant on one trip. The variation in number of data series on any one trip depends on the number of days onboard but also on the number of days in the open sea. There were no measurements on watches during arrival to and leaving ports.
Activity meters (Actiwatch)
At the first opportunity during the onboard visits, as the project was presented and questionnaires handed out, an Actiwatch was issued to each participant. Subjects were instructed to wear them during the entire onboard visit, except when showering. The Actiwatch is a small wrist-watch-type device which measures acceleration, see Figure 4. By measuring acceleration at the wrist, a measure of physical activity can be retrieved and from that an activity pattern for a participant can be produced. In this study, this measure was used for determining objective quality of sleep and to complement the subjective sleep quality estimates from the sleep diaries. Also, length of sleep can be retrieved from Actiwatch data.
Figure 4 Actiwatch placed on wrist.
Reaction time test
Since the field study is performed in an environment that is not controllable, any direct measures of performance derived from the actual task, which in this case is the tasks of the participants’ workplace, is difficult to receive. Instead, to get some measurement of performance, a reaction test was given to the participants. This test lasts for a predefined time, in this case six minutes, and is performed on a Palm handheld computer, see Figure 5. Every time a black square occurs on the screen the participant responds by pressing a key. All participants answered 60 times. The purpose of the reaction test was to examine any difference in performance after daytime watches and night time
watches. If this was to be performed during the watch, it had to be relatively brief in order not to disturb the watch-keeper. If it was to be performed after the watch, it had to be brief, in order not to take too much of the free time of the watch-keeper. Ten minutes is a lot of time in this context, but is generally recommended (Lisper & Kjellberg, 1972). We chose to make it 6 minutes supported by earlier research in the field (Axelsson, Kecklund, Åkerstedt, & Lowden, 1998).
Figure 5 Palm used for reaction time test.
4.2 Interviews
The participants for the interview study were chosen from a list of Swedish shipping companies. Those with one or very few ships were removed from the list. Twenty-four
companies that participated in the study were shipping agencies and the remainder were shipping companies. Three of the participating companies had crew members both from Sweden and from other countries.
Three of those who declined participation were not responsible for crewing (one of them had crew from the Philippines, the other two from Swedish shipping agencies). Eight of the companies did not have time to attend the study.
The following Swedish shipping companies and shipping agencies participated in the study: Broström AB, Donsötank Rederi AB, Furetank Rederi AB, Gotland Rederi AB, OSM Ship Management AB, Sirius Rederi AB, Stena Marine Management AB, Stena Rederi AB, Tarbit Shipping AB, Transatlantic Rederi AB, Walleniusrederierna AB, Wisby Tankers AB and Österströms Rederi AB.
Table 3 Information about participating companies.
Id no Number of crew members Number of Vessels 3 753 25 4 450 17 5 118 5 6 120 7 8 90 5 9 240 7 Id no Number of crew members Number of Vessels 12 650 0 15 200 10 16 1,700 12 18 101 6 22 650 22 23 34 2 24 46 (only Swedish) 3
Since it was unlikely that most shipping companies would spend time on filling out a questionnaire the approach was an interview by telephone. First we made phone calls to the companies and informed them about the study and asked them if they would like to participate. An appointment was made for a telephone interview with those who wished to participate. The next step was to e-mail the information about the project and the questionnaires. The interview was performed in Swedish. The questions are based on a questionnaire from an EU-project called SENSATION which was complemented with questions specifically of interest for the fatigue at sea study. The following questions were asked:
• How many employees on board on your ships have tasks that might be sensitive to fatigue/sleepiness?
• Is this a problem? If yes, for whom?
• Do you take actions to decrease this problem?
• Do you have systems on board or on the bridge that may be sensitive to interference by electronic equipment? If so, what kind of systems/equipment? • If available, would you consider it worthwhile to ask employees to carry fatigue
monitors to increase safety and well being? Please give reasons for yes or no. • Do you think it likely that monitoring devices would be accepted by the
employees? If not, why?
• If worthwhile, would you be willing to buy such equipment? If not, why? • What might be an acceptable cost for such equipment per employee? • If using fatigue monitoring equipment would be connected to, say, a 30%
reduction of insurance fees, would that make it interesting to use such equipment? If not, why?
The answers were written down and for the analysis, in a few instances grouped into similar basic answer categories, where appropriate. For example, we group and count those positive or negative to a certain question. Almost all of the answers are presented verbatim (translated from Swedish) in the results section. A few answers were removed, but only those not relevant to the question asked.
5 Data
analysis
This section describes how data were prepared for analysis and how the data were analysed. Generally, a significance level of P=0.05 is used in this analysis.
5.1 Health
questionnaires
21 health questionnaires were returned and analysable. Since there is a variance in amount of data for each person and each type of measure, the analysis method was not obvious. Here, two different methods were used interchangeably. The first includes all values from the diaries and no concern is made about who has answered and how many times. In the second, mean values for each person and each question was calculated before further analysis was made.
5.2
Sleep and awake diaries
The mean values of KSS (Karolinska sleepiness scale) and stress scores from the diaries, for each participant and every hour was calculated both from the on board ratings and for the at home ratings. These were then compared for the two watch
systems. For the KSS values at bed time and get up time a qualitative data overview was made, with no concern for how many times a certain person filled in a diary.
5.3
EOG, KSS and stress data
5.3.1 Preparation of EOG data
Electrooculogram (EOG) data was collected by a Vitaport II1 digital data recorder and EMBLA2 physiological data recorder. The sampling frequency of the EOG vertical and horizontal channel was 512 Hz, which was necessary for the blink extraction
algorithms. From the raw data to analyzable data several steps were necessary: First the data was screened for recording or electrode-placement errors, this was a simple visual control to ensure data validity. Then the raw data files were converted into EDF files (European Data Format3). Data parts were cut out for calibration in the next steps. The EOG eye blinks were automatically detected via a Matlab program developed by LAAS4 and modified at VTI Sweden, see Figure 6. The performance of the blink-extraction software was controlled afterwards. The result was a list of EOG features for further processing. The blink data was further processed to obtain 10 minute running mean values, and screened for outliers. The main physiological variable of interest was the running 10 minute mean of the blink duration (calculated from 50% raise to 50% fall in amplitude). The blink duration values were then synchronized with the KSS data and the stress data scorings, in order to allow statistical analyses. All data was entered into an SPSS database, which also contained all relevant data about the participants, shifts, times, etc.
1
TEMEC Instruments, Netherlands: www.temec.com. 2
EMBLA USA: www.embla.com. 3
European Data Format webpage: www.edfplus.info. 4
Figure 6 Example of EOG blink extraction; x-axis shows a 30-seconds time period, y-axis is amplitude in milliVolt. The typical form of EOG eye blinks is clearly visible, as well as some noise in the data. Eye blinks are marked with red circles, start and stop of the blinks with red stars.
5.3.2 Algorithms for EOG data preparation
Here, selected steps of the EOG data preparation are illustrated, since basic signal processing methods are not of interest. The EOG blink extraction included the following (shown in Figure 7):
• PERCLOS P80 for windows of 20 seconds • Start position of blink
• The moment when the eyelid finishes closing • The moment when the eyelid begins opening • End position of blink
• Blink duration calculated from the start position of blink to the end value of blink
• Blink duration calculated from the half rise amplitude to half fall amplitude • Peak position of blink
• Amplitude calculated from start of blink complex to peak of this blink • Lid closure speed
• PCV (peak closing velocity) • Lid opening speed
• Duration at 80 • Closing time • Opening time.
Figure 7 EOG extraction parameters.
The main steps for EOG blink extraction were the following: • Filter data.
• Compute derivate of data.
• Apply thresholds on EOG derivative to localize eyelid movements. • “Normal” amplitude blink validation.
• Test the possibility of gathering continuous blinks. • Apply constraints to ensure computation validity. • Save extracted parameters.
The EOG blink extraction procedure was labour intensive, and EOG data of low quality was a problem for some participants. Manual EOG scoring would have been too
demanding, given the length of the recordings. In the analysis only data found to be of reliable quality were used.
The relationship between sleepiness scores and shift system, time of day, EOG values, and other factors of interest are studied. Stress scores are also analyzed, and a
relationship with long work times and time of the day is expected. Situations where very high sleepiness scores are registered are of special interest. The main hypothesis of the study is: shift system 6x6 induces higher tiredness in the participants as compared to
shift system 4x8. The second main hypothesis is: EOG mean blink duration values correlate positively with KSS scale. KSS scores are taken as the primary reference for
The data analyzed included for each participant5: • Date of shift worked
• Time of day of shift worked
• Sequential number for each shift worked
• Hours worked on each shift (numbered sequentially) • KSS score (scored once each hour when on shift) • Stress score (scored once each hour when on shift)
• Mean blink duration (calculated for the 10 minutes before scoring KSS) • Shift system of participant
• Planned shift duration (from hh:mm to hh:mm) • Job position
• Reaction time scores.
The amount of available data was much higher for KSS data than for EOG data.
15 participants worked in the 6x6 shift system (10 in 6x6 and 5 in 6x6+1), and 15 in the 4x8 system. The total number of KSS scorings for all participants is close to 1,500, and data for EOG mean blink duration is only present in 28.3% of those cases. Some diaries were filled in before or after the researcher were on board. The number of KSS scorings and EOG mean blink duration values per subject are not equal, some subjects had many KSS recordings, others only a few. The reason for this is simply that some subjects filled in the KSS in the diaries for a longer period of time than others.
To improve statistical “veracity” of the analyses, controlling variables such as sequential shift number were used when appropriate. This can for instance mean choosing partial correlations analyses instead of bivariate correlation analyses. Furthermore mean scores or ranks were calculated for each participant and then analyzed in order to overcome the problems mentioned above.
One of the main independent variables of interest is the shift system. Each working shift was supposed to last 4 hours for the participants in shift system 4x8 (followed by
8 hours of free time) and 6 hours for participants in shift system 6x6 (followed by 6 hours of free time). The shift systems are shown graphically in Figure 8. Two types of 6x6 ships were present in the study, one where only two watch keepers (mate and captain) work on board and one where two mates are complemented with a watch-free captain. In the database the latter ships are referred to as shift system 2+1 (or 6x6 +1). On the 4x8-system three watch-keeping officers divide the 24 hours of the day between them. On those ships there is also a watch-free captain.
KSS values were scored by the participants at each full hour. In the analyses the KSS scores reported during time on watch are of interest, but overtime has been included in a few instances. The KSS scores range from 1 to 9, with 1 being “extremely alert” and 9
5
being “very sleepy, finding it difficult to stay awake, fighting against sleep”. See Awake Diary onboard for the KSS scale.
Figure 8 Shift system graphical representation with working and rest hours.
5.4 Data
overview
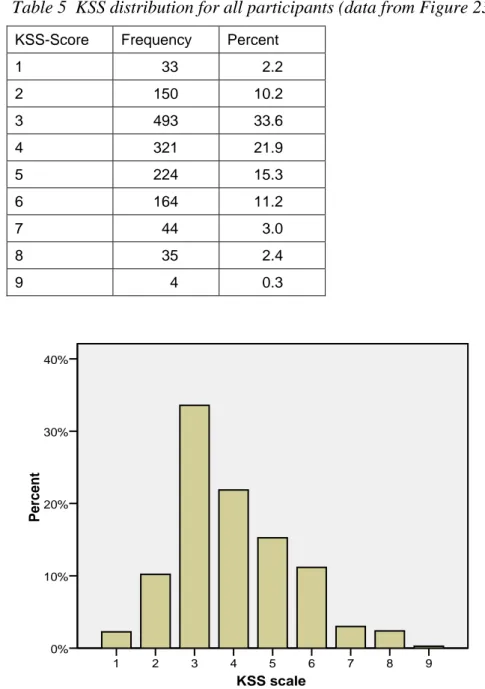
First an overview of the available data is presented. In order to choose proper statistical tests, information about group size, distribution, missing values, etc, is relevant. The distribution of the variables is shown below. Participant “7” had more KSS scorings than the other subjects (Figure 9), however, when using only the occurrences where EOG data was available together with KSS scores this evens out. Shift system 6x6 was present as often as 4x8. For most participants KSS scores were recorded during 8 shifts (median value). The time of day for which KSS data was registered was distributed evenly, except a peak around 12:00 (Figure 10). Shift system distribution is shown in Table 4.
work work rest rest
0 6 12 18 24
hours 6x6 shift system (“2”)
work work rest rest
0 12 16 24
hours 4x8 shift system (“3”)
Participant 32 31 30 29 28 27 26 25 24 23 22 21 20 19 18 17 16 15 14 13 12 11 10 9 8 7 6 3 2 1 Pe rce nt 12,5% 10,0% 7,5% 5,0% 2,5% 0,0%
Figure 9 Amount of KSS data available (% of total amount). P. 7 has more data available (see explanation above).
Per cen t 8,0% 6,0% 4,0% 2,0% 0,0% Time of shift 23: 00 22: 00 21: 00 20: 00 19: 00 18: 00 17: 00 16: 00 15: 00 14: 00 13: 00 12: 00 11: 00 10: 00 9: 00 8: 00 7: 00 6: 00 5: 00 4: 00 3: 00 2: 00 1: 00 0: 00
Figure 10 Distribution of KSS data plotted by time of day when scored (% of total amount).
Table 4 Shift system distribution (frequency) for participants with valid data. Shift system No. of participants
6x6 10 6x6+1 5