PEDESTRIAN
CRASHES
DURING
JAYWALKING,
CAN
WE
AFFORD
TO
OVERLOOK?
Jaisung Choi
The University of Seoul, Department of Transportation Engineering, Seoul, South Korea E-mail: traffic@uos.ac.kr
Sangyoup Kim
Jeonbuk Development Institute, Department of Saemangeum & Regional Development Jeollabukdo, South Korea
E-mail: road@jthink.kr
Sunggyu Kim
The University of Seoul, Department of Transportation Engineering, Seoul, South Korea E-mail: ic@uos.ac.kr
Hyungi Hong
The University of Seoul, Department of Transportation Engineering, Seoul, South Korea E-mail: h2gizzong@naver.com
Seungyoup Baik
The National Police Bureau, Seoul, South Korea E-mail: dukebaik@hanmail.net
ABSTRACT
424 traffic fatalities were recorded in Seoul in 2010 and 227 of them (54%) involved pedestrian crashes. Surprisingly, 40% of these pedestrian fatalities occurred whilst pedestrians were jaywalking, implying that one jaywalker got killed every four days in Seoul and precious lives can be saved if effective methods preventing jaywalk crashes are applied. This research proposes such methods. The approach applied in the research includes literature reviews, collection of demographical and vehicle characteristics, as well as geometric features of jaywalk crash sites. Application of statistical analysis and an examination of jaywalk crashes that occurred during past years were also carried out to understand contributing factors. Important findings from the research indicate that crosswalk spacing rules need to be flexible to allow neighboring crosswalks to sit very closely to prevent jaywalking. Human factor analysis showed that high speed drivers over represent in offenders of fatal crashes whilst jaywalking. In terms of pedestrians, the elderly was the vulnerable age group. More pedestrians were hit jaywalking by taxis and buses. Road and environment factors showed both expected and contradictory results when total numbers of lane or dry/icy pavement conditions were subject to analysis. It is expected that our results will be used in discussing pedestrian safety, as well as understanding increased strategies to prevent pedestrian fatalities.
Keywords: Jaywalking, Fatal Pedestrian Crashes, Crosswalks, Contributing Factors, Pedestrian Safety
1 INTRODUCTION
1.1 Background and Problems
The number of road accidents involving pedestrians per 100 thousand people in South Korea is 4.3 and this is an exceptionally high number compared to other OECD countries (KOROAD, 2012). South Korean pedestrian crash data also show that transportation modes involved in fatal road accidents consist of 22.8% for cars, 12.6% for motorcycles, 5.7% for cycles, and 36.6% for walking pedestrians. When compared to OECD data, these percentages show ratios of 0.55, 0.94, 1.08, and 2.04, respectively. It is therefore of concern that a high proportion of pedestrian crashes occur in South Korea with a consistent pattern which is completely different from other countries. Interestingly, a very similar pattern can also be found in Seoul, the capital city of South Korea. Based on a 2010 crash report published by Seoul Metropolitan Government, road accidents involving pedestrians accounted for 25.9% of the total road accidents in Seoul. In terms of fatal crashes, a total of 424 fatalities were recorded in Seoul for the year 2010, but, surprisingly, 227 pedestrians were killed due to the crashes. This number accounts for 54% of the total traffic fatalities in Seoul, and, if compared with OECD average value of 18.3%, this percentage is considered as an abnormality (KOROAD, 2012).
Aside from the number and percentage of pedestrian crashes, it is remarkable that South Korean pedestrian crashes show another important problem. That is, too many pedestrian crashes occur while people are jaywalking. Jaywalking is an unlawful crossing by a pedestrian, either in the form of crossing against a “DON’T WALK” signal indication or an informal crossing at a midblock location (ITE, 2010). A survey carried out in 2010 for three hundred interviewees living in Seoul and other major cities showed that 47.2% of the total interviewees jaywalk with 1-2 average jaywalks per day, and that 33.3 % jaywalk either on underground or overpass highways (KOROAD, 2012).
Obviously, jaywalking is a risky pedestrian activity in urban streets and it can involve some crashes. However, the crashes during jaywalking show an extremely serious crash level in South Korea. For example, 4,423 pedestrian crashes occurred in Seoul during 2010 and 1,631 (37%) of these were jaywalk crashes (Seoul Metropolitan Government, 2011). Further, pedestrian fatality data during the same year showed that 90 pedestrians were killed while jaywalking. This implies that a little less than one half of pedestrian fatalities in Seoul area are jaywalking related crashes. One jaywalker got killed every four days in Seoul. It is also demonstrated in Figure 1 that a total of 514 jaywalkers were killed in Seoul during a recent five years from 2006. People will panic if there is a disease with such a high level of fatality.
Figure 1. Traffic Crash Data for Seoul, South Korea (Source: Baik, 2012)
Crashes usually result in a great amount of social cost and the number of pedestrians killed during jaywalking can also be converted into a massive economic value. A total of 90 jaywalkers were killed in Seoul during 2010, and, based on the current fatality cost value of $447,751 published by the government (KOROAD, 2010; Choi et al., 2011), a total social cost of approximately USD 4 million is incurred by jaywalk fatalities. Therefore, the problem associated with jaywalking in South Korea is very serious and we shall not overlook this.
1.2 Objectives and Contribution of Research
The main objective of the research is to identify major influencing factors of jaywalk crashes and provide effective preventions to deal with an abnormally high number of pedestrian fatalities in South Korea. Existing results on jaywalking show that they only addressed broad issues of jaywalkers’ attitude, cross walk locations to suppress jaywalking, and introductory explanations of jaywalk treatment facilities (Tiwari et al., 2007; Seol, 1990; Lee, 1993; Jeong, 1997; KOROAD, 2010). However, jaywalk crashes usually require more clear explanations based on local experiences. For example, engineers need to answer why so many New Yorkers jaywalk, while hardly anyone in Copenhagen does (Vanderbilt, 2008). Further, it needs to be investigated that careful jaywalking, particularly on one-way streets, can be safer than confident crossing at the crosswalk (where the pedestrian may have to worry about streams of traffic from different directions) (Vanderbilt, 2008). The research aims to provide answers for such questions based on applying a statistical analysis to local pedestrian crash data. Local conditions also include vehicle condition, road and environmental conditions, as well as demographical data for jaywalkers and drivers.
The contribution of research is to identify causes and contributing factors of jaywalk crashes with respect to highway geometric features, weather, human and vehicle conditions. To this end, a comprehensive data base covering the most recent three years was made with data acquisition assistance from the Seoul Police Agency. The research also made a separate research effort applying the GPS (Global Positioning System) scanning procedure to examine detailed highway geometric features for crash sites. Let alone more realistic results, the
research provides a rare opportunity in which jaywalk crashes were examined thoroughly with a large scale data base.
The research applied the following approaches. First, existing studies on jaywalking and jaywalk crashes were closely reviewed. Second, past crash data, in particular crashes involving jaywalking, was collected with an aid from the Seoul Police Agency to include such characteristics as road and environment, traffic, weather, and demographical conditions. Third, a statistical analysis was carried out to capture causes and contributing factors of pedestrian fatalities involving jaywalking.
2 REVIEW OF JAYWALK CRASHES
2.1 Legal Issues of Jaywalking
In North America, jaywalking is a term commonly used to refer to illegal or reckless pedestrian crossing of a roadway (Wikipedia). Depending on the jurisdiction, jaywalking is either an infraction or a misdemeanor. Therefore, it is expected that a pedestrian not at a crosswalk must yield the right of way to approaching drivers. A fine similar to a parking ticket is issued to violating jaywalkers. In France, a relaxed stipulation for violating jaywalkers is enforced. The use of a crosswalk is not required for pedestrians and they are subject to punishment only when they fail to use a very close crosswalk located within 50m.
It is a little different in South Korea. There is no such rule. Basically, pedestrians are required only to use crosswalks, underground crosswalks, overpass crosswalks, or other crosswalk facilities when such facilities are provided (National Police Agency, 2012). This implies that pedestrians outside of these formal facilities are considered illegal pedestrians. This rule indeed is a very strong regulation. Further, there is a separate rule that states two or more crosswalk facilities shall not be placed within 200m distance of each other (National Police Agency, 2012). Therefore, pedestrians in South Korea must experience less friendly walking environments. On streets, they are easily tempted to jaywalk, which is, based on past experiences, the partial reason of a high pedestrian fatality rate in Seoul.
2.2 Fatal Crashes and Their Characteristics
Prior to investigating a statistical analysis of jaywalk crashes and associated crash conditions, the research examined general characteristics of jaywalk crashes that occurred in Seoul. It is indicated by many investigators that people jaywalk due to their laziness (Youtube; Zhuang et al., 2011; Kwon, 2001; Kim, 2009; Ki, 2009). Jaywalkers tend to think that they are able to examine and deal with hazardous situations in a very timely manner, whereas drivers at traffic lanes usually are not prepared to make perfect manoeuvres when encountering such jaywalkers (Zhuang et al., 2011; Kwon, 2001; Kim, 2009; Ki, 2009). It is also addressed that jaywalkers are most sensitive to the distance from their present locations to the nearest crosswalks (Kim et al., 2007). Therefore, locations with the most frequent jaywalking usually sit in mid block areas.
Jaywalking occurs worldwide, and yet, uniquely in Seoul, jaywalk crashes over represent in pedestrian fatalities by accounting for 40% of pedestrian fatalities. There should be uncovered reasons for this situation and the research is eager to investigate this. Understanding that traffic crashes are influenced by road and environment factors, vehicle
factors, and human factors (Homburger et al., 1996), the research carried out a review of Seoul’s fatal crashes involving jaywalking for the year 2011.
2.2.1 Road Environment Factors
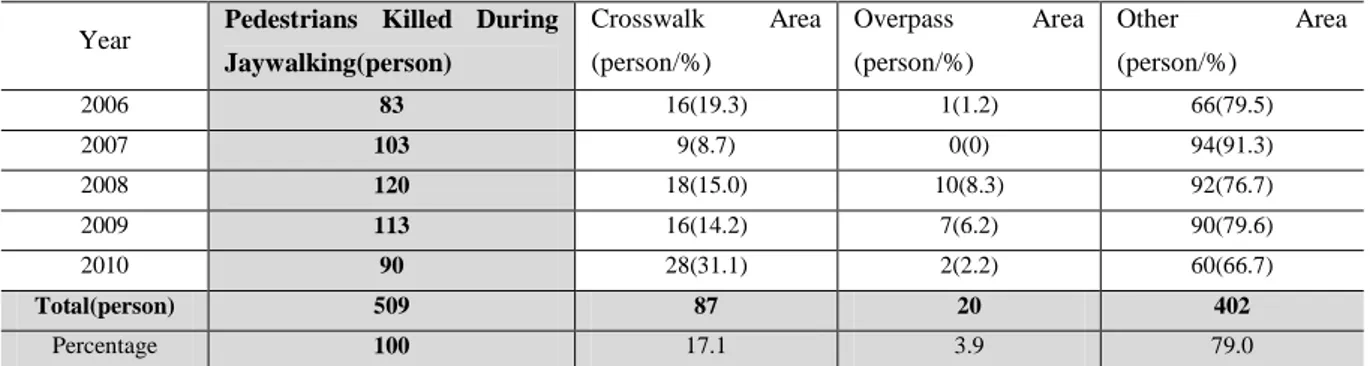
Table 1 shows the spatial distribution of pedestrian crossings where fatal jaywalk crashes occurred in Seoul. Different from other countries’ jaywalking crashes (Mullen, 1990; Keegan et al., 2003), approximately 80% of fatal jaywalk crashes in Seoul occurred in the category of “Other Area.” It is noted that the number of fatal jaywalk crashes in crosswalk areas were relatively low, contradicting an expectation that there will be many (jaywalkers and) fatal crashes in crosswalk areas. It was reviewed in the research with police departments and found that a policeman reporting a fatal jaywalk crash usually applies the definition of the crosswalk very tightly, so that a crash that occurred 25m off a painted crosswalk is reported as “Other Area.” Besides, in South Korea, regulations require that two crosswalks must be separated with at least 200m (In the US, they apply 300ft distance between neighbouring crosswalks, 100m and very flexible depending upon surrounding land uses in Japan, 90m in the UK, and 100m in Singapore). As a result, there are empty spaces between crosswalks, and pedestrians that were tempted to use such spaces (jaywalking in South Korea) and were less fortunate to get killed are classified as “Other Area” fatalities. It is also remarked that fatal jaywalk crashes occurring in narrow streets (less than 5.4m wide) were excluded from this table because such crashes usually do not constitute jaywalk crashes (Seoul Metropolitan Government, 2011).
Table 1. Fatal Jaywalk Crashes and Their Spatial Distribution in Seoul Year Pedestrians Killed During
Jaywalking(person) Crosswalk Area (person/%) Overpass Area (person/%) Other Area (person/%) 2006 83 16(19.3) 1(1.2) 66(79.5) 2007 103 9(8.7) 0(0) 94(91.3) 2008 120 18(15.0) 10(8.3) 92(76.7) 2009 113 16(14.2) 7(6.2) 90(79.6) 2010 90 28(31.1) 2(2.2) 60(66.7) Total(person) 509 87 20 402 Percentage 100 17.1 3.9 79.0
Table 2 summarizes the hourly distribution of fatal jaywalk crashes in Seoul. Many fatal crashes occurred during midnight to 6:00 AM and 7:00 PM to midnight. Both of these hours cover more than 60% of total fatal crashes in Seoul. As expected, jaywalking in night time periods will involve more fatal crashes.
Table 2. Hourly Distribution of Fatal Jaywalk Crashes in Seoul Year Pedestrians Killed During Jaywalking (person) 0-3 AM 4-6 AM 7-9 AM 10 AM -12 PM 1-3 PM 4-6 PM 7-9 PM 10 PM -12 AM 2006 83 17 17 6 8 9 6 10 10 2007 103 18 20 9 13 12 8 11 12 2008 120 15 27 6 6 10 15 23 18 2009 113 15 15 10 13 9 15 20 16 2010 90 14 16 5 6 7 12 13 17 Total (person) 509 79 95 36 46 47 56 77 73 Percentage 100 15.5 18.7 7.2 9.0 9.2 11.0 15.1 14.3
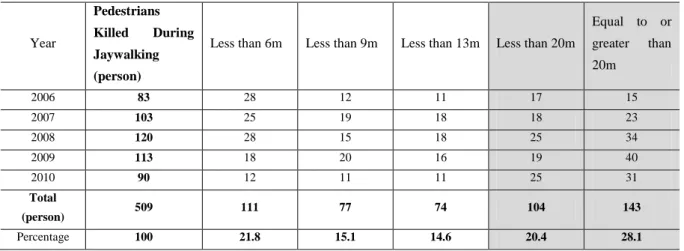
Table 3 summarizes the distribution of fatal jaywalk crashes depending upon street width. Approximately one half of fatal jaywalk crashes occurred at streets greater than 13m. However, the current width category system applies too wide intervals at 20 m ranges, resulting in hiding the true effect of the street width on fatal crash occurrences. Regardless, it was found that wide streets usually involved more fatal jaywalk crashes.
Table 3. Distribution of Fatal Jaywalk Crashes Depending upon Street Width
Year
Pedestrians
Killed During Jaywalking
(person)
Less than 6m Less than 9m Less than 13m Less than 20m
Equal to or greater than 20m 2006 83 28 12 11 17 15 2007 103 25 19 18 18 23 2008 120 28 15 18 25 34 2009 113 18 20 16 19 40 2010 90 12 11 11 25 31 Total (person) 509 111 77 74 104 143 Percentage 100 21.8 15.1 14.6 20.4 28.1
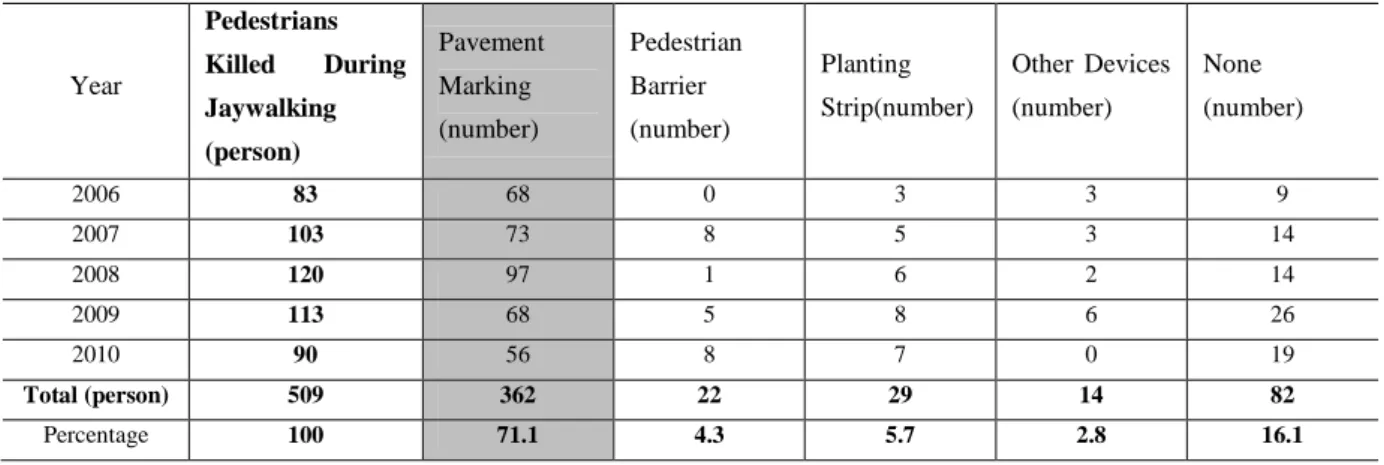
Table 4 is the summary of the occurrence of fatal jaywalk crashes depending upon the presence of pedestrian safety devices in Seoul. Although markings are extensively applied by the police to send pedestrians traffic safety messages, it is shown in this table that markings are no longer helpful to prevent fatal jaywalk crashes in Seoul.
Table 4. Presence of Pedestrian Safety Devices and Fatal Jaywalk Crashes in Seoul Year Pedestrians Killed During Jaywalking (person) Pavement Marking (number) Pedestrian Barrier (number) Planting Strip(number) Other Devices (number) None (number) 2006 83 68 0 3 3 9 2007 103 73 8 5 3 14 2008 120 97 1 6 2 14 2009 113 68 5 8 6 26 2010 90 56 8 7 0 19 Total (person) 509 362 22 29 14 82 Percentage 100 71.1 4.3 5.7 2.8 16.1 2.2.2 Vehicle Factors
Dominant vehicles involved in fatal jaywalk crashes were cars and taxis, accounting for more than 70% of fatal jaywalk crashes in Seoul. They are followed by motorcycles. In fact, motorcycles are ubiquitous in urban areas and probably crossing jaywalkers as well as motorcycle drivers are simultaneously victimized. However, Table 5 does not provide further information and a separate detailed analysis is needed to examine motorcycles and jaywalking.
Table 5. Vehicle Types and Fatal Jaywalk Crashes in Seoul
Year Total Car Taxi Bus Truck Motorcycle Bicycle
2006 1,054 430 336 90 96 102 - 2007 1,120 482 331 102 88 115 2 2008 1,152 451 334 106 84 174 3 2009 1,150 443 329 121 90 157 10 2010 1,111 457 339 109 60 140 6 Total 5,587 2,263 1,669 528 418 688 21 Percentage 100% 40.5% 29.9% 9.5% 7.5% 12.3% 0.4% 2.2.3 Human Factors
Even before collecting demographical data for fatal jaywalk crashes, it was expected in the research that the elderly and youngsters represent vulnerable groups. In fact, the expectation for the elderly turns out true as indicated in Table 6. It can be believed that the elderly do jaywalk due to their lack of walking ability and youngsters due to their lack of attentiveness. Once hit by cars, both groups are too weak to survive, resulting in high fatalities. Besides, the elderly are involved in more crashes during jaywalking because they move slowly on traffic lanes compared to other groups. Table 6 summarizes the human factors associated with fatal jaywalk crashes. It was also reported in Table 6 that males represent a higher percentage of fatality than females.
Table 6. Demographical Characteristics of Fatal Crash Victims during Jaywalking in Seoul [Total (Male/Female)] Year Pedestrians Killed During Jaywalking (person) Under 13 13-20 21-30 31-40 41-50 51-60 61-70 Above 70 2006 83(49/34) 4(2/2) 4(3/1) 1(0/1) 7(6/1) 19(12/7) 10(5/5) 18(12/6) 20(9/11) 2007 103(58/45) 6(4/2) 0(0/0) 7(7/0) 7(7/0) 22(18/4) 11(7/4) 14(6/8) 36(9/27) 2008 120(65/55) 1(0/1) 2(1/1) 7(6/1) 7(6/1) 23(21/2) 15(7/8) 28(12/16) 37(12/25) 2009 113(54/59) 2(2/0) 0(0/0) 6(6/0) 8(6/2) 20(14/6) 25(12/13) 24(7/17) 28(7/21) 2010 90(47/43) 5(2/3) 2(0/2) 6(3/3) 8(4/4) 17(12/5) 15(12/3) 15(5/10) 22(9/13) Total (person) 509(273/236) 18(10/8) 8(4/4) 27(22/5) 37(29/8) 101 (77/24) 76(43/33) 99(42/57) 143 (46/97) Percentage (%) 100 (53.6/46.4) 3.6 (2.0/1.6) 1.6 (0.8/0.8) 5.3 (4.3/1.0) 7.3 (5.7/1.6) 19.8 (15.1/4.7) 14.9 (8.4/6.5) 19.5 (8.3/11.2) 28.1 (9.0/19.1)
3 RESEARCH CONCEPT
The previous section describes general characteristics of fatal jaywalk crashes in Seoul. Existing studies usually attempt to draw their conclusions only with these types of jaywalk crash information. However, the research considered that effective treatments for jaywalking would only be prepared by performing much more thorough analyses. It is well addressed that a more realistic role of contributing factors can be shown by overlapping among the human, roadway, and vehicle factors that contribute to crashes (Homburger et al., 1996). Obviously, this approach can be carried out after acquiring real world data from the highway or traffic department in the Seoul Metropolitan Government. The research thus formed a comprehensive data base integrating past crash data, vehicle information, and the human factor for past jaywalk crash occurrences. Only pedestrian crashes were extracted and jaywalk crashes were subsequently prepared for a follow-up analysis to identify their contributing factors. In addition, discussions for analysis results were given to understand the causes and contributing factors of fatal crashes during jaywalking. This was necessary because engineering principles are important for driver safety but questions of their impact on pedestrian safety, in particular pedestrians who are jaywalking, must be answered as well to provide more strategies of pedestrian crash preventions.
4 METHODOLOGY
4.1 Data
The main focus of the research was to identify contributing factors of fatal jaywalk crashes. Therefore, crash data, road and environmental conditions, vehicle characteristics, and human characteristics were collected from available sources. The spatial scope was confined within Seoul. Three years of pedestrian crash data from 2008 to 2010, a total of 12,067 crashes, reported to the Seoul Policy Agency, and filed in TAMS (Traffic Accident Management System) were subject to analysis. With jaywalking in mind, crash data were classified by
jaywalking or others, and independent variables were categorized into general, vehicle, road and environment, and human characteristics. To be more detailed, general characteristics included time of year, day or night, crash severity levels (minor injury, severe injury, and fatality). Vehicle characteristics included six vehicle types. Road and environment characteristics included seventeen variables of the weather, geometric features, pavement types, road types, and several physical conditions. Human characteristics consisted of sixteen variables which included drivers’ (and also pedestrians’) gender, ages, and other driving stage information. The data collection activity also included the application of the GPS (Global Positioning System) information. This was necessary because highway geometric information provided by CAD (Computer Aided Design) files often missed critical information, in particular, cross-section design elements such as number of lanes, bus stops and sidewalk pavement. Land use characteristics associated with fatal jaywalk crash locations were also examined by checking current land use maps. As a result, the research formed a comprehensive data base consisting of 16 items with 54 variables.
4.2 Statistical Analysis
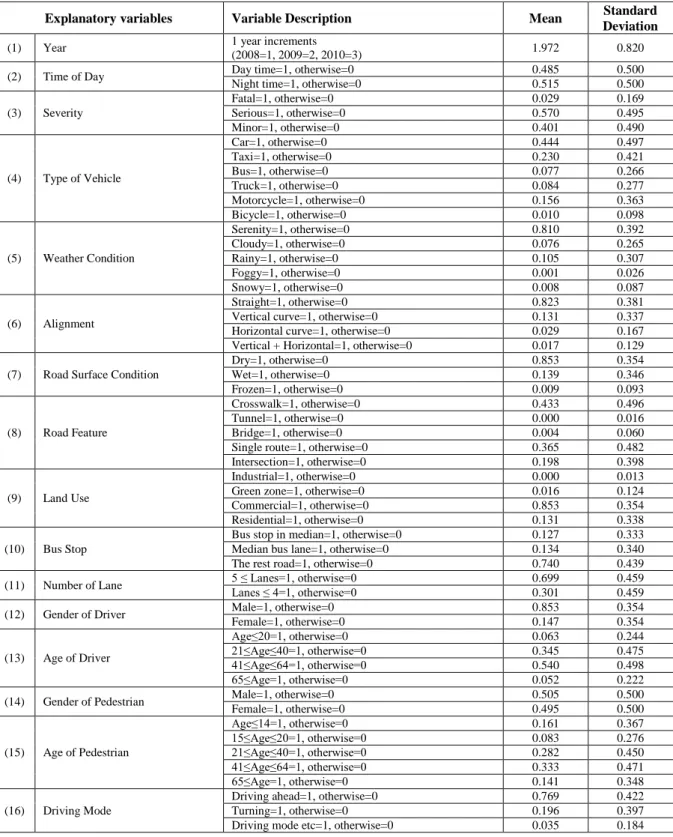
Before directly applying this model to fatal crashes during jaywalking, it was worthwhile to examine various statistics related to overall pedestrian crashes as given in Table 7. The number of observations was 12,067 and a confidence level of 95% was applied in this analysis. A total of 23 independent variables showed statistical significance, p≤0.05. Contributing factors of pedestrian crashes included human, vehicle, and road and environment factors. Findings from the research are as follow: With time passing, the number of pedestrian crashes gradually decreased and showed an average value of 1.972. Pedestrian crashes occurred more frequently at night. It is noted that pedestrian crashes usually resulted in severe injuries. Pedestrians were hit by cars with a 44.4 % value. Road and environment characteristics showed that the majority of pedestrian crashes occurred with good weather conditions, straight tangent sections that do not include horizontal or vertical curves, and dry pavement conditions. Crashes at crosswalks or mid-block areas, in particular mid-block areas without bus lanes, represent frequent pedestrian crash locations. Where the number of vehicle lanes was equal to or greater than five there were many pedestrian crashes. Land use characteristics showed that there were many pedestrian crashes within commercial areas. In addition, the majority of pedestrian crashes occurred while the involved vehicles were in a speeding mode. Human characteristics showed that males represented dominant drivers. In terms of injured, there was no dominant group. Ages 21-64 were typical for both drivers and pedestrians.
Table 7. Descriptive statistics of variables related to pedestrian crashes
Explanatory variables Variable Description Mean Standard
Deviation
(1) Year 1 year increments
(2008=1, 2009=2, 2010=3) 1.972 0.820 (2) Time of Day Day time=1, otherwise=0 0.485 0.500 Night time=1, otherwise=0 0.515 0.500
(3) Severity Fatal=1, otherwise=0 0.029 0.169 Serious=1, otherwise=0 0.570 0.495 Minor=1, otherwise=0 0.401 0.490 (4) Type of Vehicle Car=1, otherwise=0 0.444 0.497 Taxi=1, otherwise=0 0.230 0.421 Bus=1, otherwise=0 0.077 0.266 Truck=1, otherwise=0 0.084 0.277 Motorcycle=1, otherwise=0 0.156 0.363 Bicycle=1, otherwise=0 0.010 0.098 (5) Weather Condition Serenity=1, otherwise=0 0.810 0.392 Cloudy=1, otherwise=0 0.076 0.265 Rainy=1, otherwise=0 0.105 0.307 Foggy=1, otherwise=0 0.001 0.026 Snowy=1, otherwise=0 0.008 0.087 (6) Alignment Straight=1, otherwise=0 0.823 0.381 Vertical curve=1, otherwise=0 0.131 0.337 Horizontal curve=1, otherwise=0 0.029 0.167 Vertical + Horizontal=1, otherwise=0 0.017 0.129
(7) Road Surface Condition
Dry=1, otherwise=0 0.853 0.354 Wet=1, otherwise=0 0.139 0.346 Frozen=1, otherwise=0 0.009 0.093 (8) Road Feature Crosswalk=1, otherwise=0 0.433 0.496 Tunnel=1, otherwise=0 0.000 0.016 Bridge=1, otherwise=0 0.004 0.060 Single route=1, otherwise=0 0.365 0.482 Intersection=1, otherwise=0 0.198 0.398
(9) Land Use
Industrial=1, otherwise=0 0.000 0.013 Green zone=1, otherwise=0 0.016 0.124 Commercial=1, otherwise=0 0.853 0.354 Residential=1, otherwise=0 0.131 0.338
(10) Bus Stop
Bus stop in median=1, otherwise=0 0.127 0.333 Median bus lane=1, otherwise=0 0.134 0.340 The rest road=1, otherwise=0 0.740 0.439 (11) Number of Lane 5 ≤ Lanes=1, otherwise=0 0.699 0.459 Lanes ≤ 4=1, otherwise=0 0.301 0.459 (12) Gender of Driver Male=1, otherwise=0 0.853 0.354 Female=1, otherwise=0 0.147 0.354 (13) Age of Driver Age≤20=1, otherwise=0 0.063 0.244 21≤Age≤40=1, otherwise=0 0.345 0.475 41≤Age≤64=1, otherwise=0 0.540 0.498 65≤Age=1, otherwise=0 0.052 0.222 (14) Gender of Pedestrian Male=1, otherwise=0 0.505 0.500 Female=1, otherwise=0 0.495 0.500 (15) Age of Pedestrian Age≤14=1, otherwise=0 0.161 0.367 15≤Age≤20=1, otherwise=0 0.083 0.276 21≤Age≤40=1, otherwise=0 0.282 0.450 41≤Age≤64=1, otherwise=0 0.333 0.471 65≤Age=1, otherwise=0 0.141 0.348 (16) Driving Mode
Driving ahead=1, otherwise=0 0.769 0.422 Turning=1, otherwise=0 0.196 0.397 Driving mode etc=1, otherwise=0 0.035 0.184
Based on the pedestrian crash data as summarized in Table 7, the research applied logistic regression models to identify contributing factors of fatal crashes during jaywalking. In fact,
logistic regression models have been applied extensively in similar crash studies (Choi et al., 2009, 2011; Tay et al., 2008, 2011), and the research thus considered them as appropriate. Theoretically, logit is the natural logarithm of the odds or the likelihood ratio that the dependent variable is 1 (jaywalk crash) as opposed to zero (non-jaywalk crash). The probability P of a crash during jaywalking is thus given by Eqn. (1).
𝑌 = logit(p) = ln (𝑃/(1 − 𝑃)) = βx (1)
4.3 Results
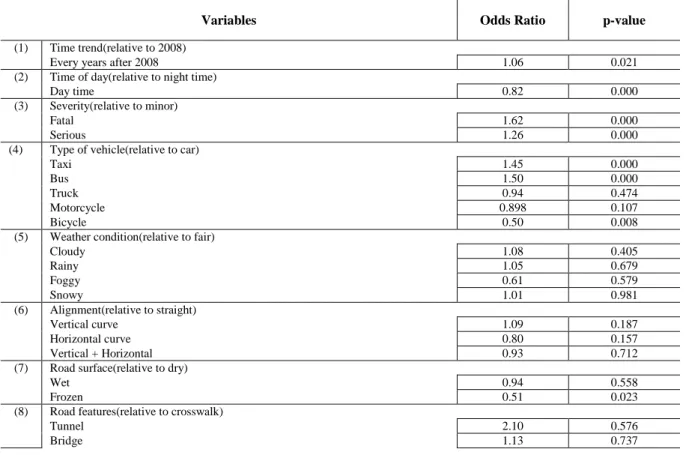
Applying logistic regression models to pedestrian crash data given in the previous section, the research found contributing factors of pedestrian crashes during jaywalking. Table 8 is the result. The odd ratio for years was 1.06, implying that the total number of pedestrian crashes involving jaywalking gradually increased as time passed. More jaywalk crashes occurred during the night. Although fatal pedestrian crashes given in row (3) of Table 7 (3) showed only 2.9%, its associated severity level was very high as given in row (3) of Table 8. Any pedestrian crash during jaywalking is likely to be fatal (1.62) or serious (1.26) as opposed to non-jaywalking crashes. When a jaywalker is hit by a taxi or bus, he/she will be more severely injured than non-jaywalking crashes. A more detailed finding will be given in the discussion section.
Table 8. Various Results for Pedestrian Crashes Occurred During Jaywalking
Variables Odds Ratio p-value
(1) Time trend(relative to 2008)
Every years after 2008 1.06 0.021 (2) Time of day(relative to night time)
Day time 0.82 0.000
(3) Severity(relative to minor)
Fatal 1.62 0.000
Serious 1.26 0.000
(4) Type of vehicle(relative to car)
Taxi 1.45 0.000
Bus 1.50 0.000
Truck 0.94 0.474
Motorcycle 0.898 0.107
Bicycle 0.50 0.008
(5) Weather condition(relative to fair)
Cloudy 1.08 0.405 Rainy 1.05 0.679 Foggy 0.61 0.579 Snowy 1.01 0.981 (6) Alignment(relative to straight) Vertical curve 1.09 0.187 Horizontal curve 0.80 0.157 Vertical + Horizontal 0.93 0.712 (7) Road surface(relative to dry)
Wet 0.94 0.558
Frozen 0.51 0.023
(8) Road features(relative to crosswalk)
Tunnel 2.10 0.576
Variables Odds Ratio p-value
Single route 2.78 0.000
Intersection 1.96 0.000
(9) Land use(relative to residential area)
Industrial 2.57 0.506
Green zone 0.88 0.520
Commercial 1.31 0.000
(10) Location about BRT(relative to other roads)
Bus stop in median 1.44 0.000 Median bus lane 0.98 0.809 (11) Number of lanes(relative to lanes≤4)
5 or more Lanes 0.89 0.025 (12) Driver gender(relative to female)
Male 1.19 0.012
(13) Age of Driver(relative to 65≤ age)
Age≤20 0.93 0.648
21≤Age≤40 1.39 0.002
41≤Age≤64 1.30 0.010
(14) Pedestrian gender(relative to female)
Male 1.30 0.000
(15) Age of Pedestrian(relative to age≤14)
15≤Age≤20 1.83 0.000
21≤Age≤40 1.50 0.000
41≤Age≤64 1.79 0.000
65≤Age 2.19 0.000
(16) Driving mode (relative to going straight)
Turning 0.33 0.000
Other 0.41 0.000
Log likelihood = -6458.98; Chi-square = 1456.57, p-value < 0.0001
5 DISCUSSIONS
5.1 General
Investigating officers may cite one or more factors that contributed to crash occurrence; because they are trained to look for human error, it is not surprising that mistakes by drivers and pedestrians are frequently cited, while highway or vehicle defects are rarely mentioned (Homburger et al., 1996). The research wanted to discuss these classical theories with our own analysis results and to find the contributing factors of jaywalk crashes as will be detailed in 5.2 Contributing factors.
The second issue we wanted to explore were policy aspect of jaywalking in South Korea. For instance, South Korean government enacted “Law of Promoting Pedestrian Safety and Comfort” in 2011 to support the concept of pedestrian priority design. However, current national crosswalk design standards (KOROAD, 2011) are opposed to the pedestrian priority designs, despite that the government has enacted such a law and people generally are supportive of pedestrian priority designs (Baik, 2012). Another example is the placement of pedestrian fences along urban streets to prevent jaywalking. It is an international practice that pedestrian fences are placed at locations where jaywalking is expected. Seoul Metropolitan Government followed suite and seemed to successfully suppress jaywalking (The total numbers of jaywalk crashes in Seoul before and after pedestrian fences were 57 and 27, respectively (Baik, 2012)). However, shamefully, city councils argued that such fences
created a less pleasing appearance of urban streets and they recently ordered the complete removal of pedestrian fences.
5.2 Contributing Factors
5.2.1 Road and Environment Factors
The result showed relatively high p-values for most weather and geometric feature variables, implying that they were not significantly related to pedestrian crashes involving jaywalking. In terms of road surface, the only variable with a significant result was frozen road surface. Despite reduced sight distance at icy roads, drivers will become defensive and slow down so there were few jaywalking crashes. At various crosswalk locations, variables with statistical significances were intersection and single-route, i.e. mid-blocks. When compared with crosswalk areas, intersection and mid-block areas were found to show far greater odd ratios of 1.96 and 2.78, respectively. At crosswalks, pedestrians remain waiting until safe vehicle gaps appear or the pedestrian signal starts. However, at intersections, pedestrians seemed to easily run the risk of jaywalking. Located far off available crosswalks, pedestrians at mid-block areas were also easily tempted to jaywalk, resulting in many crashes in such areas.
It was also revealed that commercial areas involved more jaywalking crashes in contrast with residential areas. Relaxation of crosswalk distances as well as application of traffic calming methods in commercial areas will result in fewer pedestrian crashes involving jaywalking. Finally, it needs to be discussed that median bus lanes and the total number of traffic lanes have significant effects on jaywalk crash occurrences. At locations with median bus stops, jaywalk crashes occurred more frequently.
As for the number of traffic lanes, locations with a total number of lanes equal to or greater than five tend to have fewer jaywalking crashes. This result contradicts the result obtained with total pedestrian crashes in Table 7. Geometric features within the median bus lanes in Seoul may be attributable to these unexpected jaywalk crashes, i.e., median bus lanes are usually placed at locations with greater than five traffic lanes and pedestrians will tend to make fewer jaywalks at such locations or can avoid jaywalk crashes with help from reduced walking distances to median bus lane locations.
5.2.2 Vehicle Factors
Taxis and buses were found to have significant effects on pedestrian crashes during jaywalking (bicycles and motorcycles were found not to have significant p-values). Despite that cars involved in 44.4% of pedestrian crashes as given in Table 7, taxis and buses represent typical vehicles when pedestrian crashes during jaywalking were the main issue of analysis. Speeding by these two modes is expected to contribute more jaywalk crashes. Similar experiences were published by other countries (Kajzer et al., 1992; Burns et al., 1995; Takeuchi et al., 1998; Bu et al., 2005).
5.2.3 Human Factors
Human factors with significant effects for jaywalk crashes included the gender and age of pedestrians, as well as the driving mode of drivers. Males were more responsible for jaywalk crashes. From Table 6, it is apparent that males over represent pedestrians killed during jaywalking. However, this pattern changes with age and female victims become a dominant
group at ages of 61-70 and 70 or older as shown in Table 6. Females usually refrain from jaywalking until their fifties but start to show a sudden increase after passing their sixties. A special consideration needs to be given to old female pedestrians, i.e., they should be one of the target groups of jaywalk preventive designs.
In the age group analysis, drivers and pedestrians showed quite different results: drivers with ages 21-64 were contributing to more crashes during jaywalking. However, in terms of pedestrians, senior pedestrians with ages equal to 65 or older boosted jaywalking crashes greatly. The elderly are more vulnerable to crashes than youngsters due to their lack of appropriate judgments in emergencies. They are also deprived of correct spatial feeling and proper reactions (Kim, 2011), as well as the physical strength required to overcome crash injuries.
Last, driving mode analysis revealed that drivers running straight road sections hit jaywalkers more frequently than drivers making turns. Once again, speed levels are attributable to this result. It is therefore recommended that speed limits within urban areas remain very low to prevent jaywalk crashes. As such, traffic calming devices such as chokers and speed camera installations to force vehicles to slow down can be very effective tools to deal with this problem (Tay et al. 2008; Tay et al. 2011). Alternatively, for locations with a straight alignment and frequent jaywalking crashes, it may be effective to provide a warning sign similar to the wild animal warning sign in rural roads.
6 CONCLUSIONS
Jaywalking occurs worldwide, and yet, uniquely in Seoul, jaywalk crashes over represent in pedestrian fatalities by accounting for 40% of pedestrian fatalities. The research was carried out to identify contributing factors of pedestrian crashes during jaywalking. Findings of the research are as follow:
Human factor analysis showed that high speed drivers were responsible for most pedestrian crashes. In terms of pedestrians, the elderly were the most vulnerable age group.
Vehicle factors contributing to pedestrian crashes during jaywalking included taxis and buses.
Road and environment factors showed both expected and contradictory results. For example, more crashes occurred at locations with four lane streets than with five or more lanes. Besides, dry pavement conditions involved more crashes than icy pavements.
It is expected that this result is useful in discussing pedestrian safety, as well as understanding better strategies to prevent crashes during jaywalking.
ACKNOWLEDGEMENTS
“This work was supported by the National Research Foundation of Korea (NRF) grant funded by the Korea government (MEST) (No. 2012R1A2A2A01015234).”
REFERENCES
Baik, S. (2012). A Study on Preventive Measures for Traffic Accidents Resulting from Jaywalking. Ph.D. Thesis. University of Seoul, South Korea.
Bu, F. and Chan, C. (2005). Pedestrian detection in transit bus application: sensing technologies and safety solutions. The Intelligent Vehicles Symposium, 2005. Proceedings. IEEE., pp. 100-105.
Burns, P. and Wilde G. (1995). Risk Taking in Male Taxi Drivers: Relationships Among Personality, Observational Data and Driver Records. Personality and Individual
Differences, Vol. 18, No. 2, pp. 267-278.
Choi, J., Kim, S., Hwang, K., and Baik, S. (2009). Severity Analysis of the Pedestrian Crash Patterns Based on the Ordered Logit Model. Journal of the Korean Society of Road
Engineers, Vol. 11, No. 1, pp. 153-164.
Choi, J., Kim, S., Heo, T., and Lee, J. (2011). Safety Effects of Highway Terrain Types in Vehicle Crash Model of Major Rural Roads. KSCE Journal of Civil Engineering, Vol. 15, No. 2, pp. 405-412.
Homburger, W. (1996). Fundamentals of Traffic Engineering (15th Edition). Institute of
Transportation Studies, University of California, Berkeley.
ITE (2010). Manual of Transportation Engineering Studies. Institute of Transportation Engineers.
Jeong, S. (1997). Suggestions Based on a Crosswalk Installation. Networks for Green Transport, No 30. Seoul.
Kajzer, J., Mohan, D., and Yang, J. (1992). Safer Bus Fronts for Pedestrian Impact Protection in Bus-Pedestrian Accidents. A Preliminary Investigation. International IRCOBI Conference on the Biomechanics of Impacts. 1992. Proceedings. Bron, IRCOBI, 1992, pp. 13-23.
Keegan, O. and O'Mahony, M. (2003). Modifying Pedestrian Behavior. Transportation
Research. Part A, Policy and Practice, Vol. 37A, No. 10, pp. 889-901.
Ki, G. (2009). Knowing the Psychology of Pedestrians Walking Seems the Answer to Reduce
Traffic Crash. Korea Road Traffic Authority. July, pp. 6-9.
Kim, C. (2009). US Metropolitan Pedestrian Crash Type of Analysis and Safety Management. Korea Transportation Institute, Monthly Traffic No 132, South Korea.
Kim, K., Brunner, I., and Yamashita, E. (2007). Modeling violation of Hawaii's crosswalk law. Accident Analysis and Preventions, Vol. 40, No. 3, pp. 894-904.
Kim, S. (2011). Study on Policy Strategies to Reduce Traffic Accident of the Elderly in Gwangju Metropolitan City. Chonnam National University, South Korea.
Korea Transportation Institute (2001). Considering the Driving Behavior of Older Drivers and Safety Driving Countermeasure Research, South Korea
Korea Road Traffic Authority (2010). Cost of Road Traffic Crashes Estimates and Evaluation on 2009. Seoul, South Korea.
Korea Road Traffic Authority (2012). Traffic Accident Comparison of OECD Member
Countries on 2010, South Korea.
Kwon, T. (2001). Daegu Plans to Establish the Pedestrian Environment. Daegu Gyeongbuk Development Institute, Daegu. South Korea.
Lee, S. (1993). Reduction Measures and the Characteristics of Pedestrian Crashes. Korea Road Traffic Authority, August, pp 79-84.
Mullen, B., Cooper, C., and Driskell, J. (1990). Jaywalking as a Function of Model Behavior,
Personality and Social Psychology Bulletin, Volume 16, No. 2, pp 320-330.
National Police Agency. (2012). Enforcement Decree of Road Traffic Act, South Korea
Seol, J. (1990). Study for Reducing Pedestrian Crashes. Korea Transportation Institute, South Korea.
Seoul Metropolitan Government (2011). Seoul Survey 2010. Seoul Statistics, South Korea. Seoul Metropolitan Government (2011). The Second Master Plan for the Traffic Safety in
Seoul, South Korea.
Takeuchi, K., Kajzer, J., Ishikawa, H. and Bunketorp, O. (1998). Car-pedestrian accidents in
Gothenburg during ten years. International IRCOBI Conference on the Biomechanics of
Impact, International Research Council on the Bio-kinetics of Impacts.
Tay, R., Rifaat, S., and Chin, H. (2008). A Logistic Model of the Effects of Roadway, Environmental, Vehicle, Crash and Driver Characteristics on Hit-and-Run Crashes.
Accident Analysis and Prevention, Vol. 40, No. 4, pp. 1330-1336.
Tay, R., Choi, J., Kattan, L., and Khan, A. (2011). A Multinomial Logit Model of Pedestrian-Vehicle Crash Severity. International Journal of Sustainable Transportation, Vol. 5, No. 4, pp. 233-249.
Tiwari, G., Bangdiwala, S., Saraswat, A. and Gaurav, S. (2007). Survival Analysis: Pedestrian risk exposure at signalized intersections. Science Direct, Vol. 10, No. 2, pp. 77-89.
Vanderbilt, T. (2008). Traffic: Why We Drive the Way We Do (and What It Says About Us), Knopf Doubleday Publishing Group.
Zhuang, X. and Wu, C. (2011). Pedestrians’ Crossing Behaviors and Safety at Unmarked Roadway in China. Accident Analysis and Prevention, Vol. 43, No. 6, pp. 1-10.
http://www.youtube.com/watch?v=nrFTEPeo3mo http://en.wikipedia.org/wiki/Jaywalking

![Table 6. Demographical Characteristics of Fatal Crash Victims during Jaywalking in Seoul [Total (Male/Female)] Year Pedestrians Killed During Jaywalking (person) Under 13 13-20 21-30 31-40 41-50 51-60 61-70 Above 70 2006 83(49/34) 4(2/2)](https://thumb-eu.123doks.com/thumbv2/5dokorg/4716593.124340/8.892.98.789.253.529/demographical-characteristics-victims-jaywalking-female-pedestrians-killed-jaywalking.webp)