Investigating the ‘Greenness’ of
Young Consumers
A Study on the Influence of Environmental Concern, Exposure to Green
Marketing and Green Scepticism on Green Purchase Decisions.
Darnéus Ekeroth, Julia Milner, Natasha Nurmi, Elina
School of Business, Society & Engineering
Course: Bachelor Thesis in Business Administration Course code: FOA230, 15 cr
Supervisor: David Freund Date: 2020-06-01, 2020-06-06
ABSTRACT
Date: 2020-06-06
Level: Bachelor Thesis in Business Administration, 15 cr
Institution: School of Business, Society and Engineering, Mälardalen University
Authors: Elina Nurmi Julia Darnéus Ekeroth Natasha Milner (1993-01-08) (1996-07-24) (1998-05-05) Title: Investigating the ‘Greenness’ of Young Consumers
Tutor: David Freund
Keywords: Environmental concern, green marketing, green consumer, green scepticism, green purchase decision.
Research Question: How can environmental concern, exposure to green marketing and green scepticism influence young consumers’ green purchase decisions?
Purpose: The purpose of this thesis is to investigate how young consumers’ green purchase decisions can be influenced by their environmental concern, exposure to green marketing and lastly, green scepticism. It will be analysed if consumers are now overexposed to green marketing, whether there is an action/awareness gap, and lastly, the number of green consumers in the sample will be established.
Method: Primary data was collected through a quantitative research method, via a self-completion online questionnaire. The chosen sample was Swedes, aged 18-30 and consisted of 140 respondents. IBM SPSS Statistics was used for the statistical tests undertaken such as Cronbach’s Alpha, Chi-square, Pearson’s correlation and Regression analysis.
Conclusion: Environmental concern and green scepticism were found to have a significant influence on the young Swedish consumers’ green purchase decision. A great deal of the sample possessed environmental concern, and it was found to influence their green purchase decision positively. The participants were not sceptical of green marketing, and green scepticism was found to significantly and negatively influence their green purchases. Finally, the young Swedes were minimally underexposed to green marketing with a slight negative, but insignificant, influence on green purchase decisions.
TABLE OF CONTENTS
1. Introduction 1 1.1 Background 1 1.2 Problematisation 2 1.3 Purpose 3 1.4 Research Question 3 2. Literature Review 42.1 The Green Consumer 4
2.1.1 Environmental Concern 6
2.2 Green Marketing 6
2.2.1 Greenwashing 8
2.3 Green Scepticism 8
2.4 Green Purchase Decision 9
2.5 Conceptual Model of the Theoretical Relationships 11
2.6 Hypotheses Formulation 12
2.6.1 Environmental Concern and Green Purchase Decision 12
2.6.2 Exposure to Green Marketing 13
2.6.3 Green Scepticism and Green Purchase Decision 13
3. Methodology 14
3.1 Research Approach 14
3.2 Survey Design 15
3.2.1 Dependent and Independent Variables 15
3.2.2 Control Variables 15 3.2.3 Scales 15 3.3 Sample 18 3.4.1 Pilot Study 18 3.4.2 Data Collection 19 3.5 Data Analysis 19 3.5.1 Data Preparation 19 3.5.2 Cronbach’s Alpha 20 3.5.3 Chi-square Test 20 3.5.4 Pearson’s Correlation 20 3.5.5 Regression Analysis 21 3.6 Quality Criteria 22 3.6.1 Reliability 22 3.6.2 Credibility 22 3.6.3 Validity 23
3.6.4 Objectivity 23
4. Results 25
4.1 Demographics 25
4.1.1 Sample Characteristics 26
4.1.2 Control Variables - Chi Square 27
4.2 Cronbach’s Alpha - Reliability 28
4.3 The Pearson Correlation- Construct Validity 28
4.4 Regression Analysis 30
5. Discussion 33
5.1 Sample Greenness 33
5.2 𝐻01 - Environmental Concern and Green Purchase Decision 34
5.3 𝐻02- Exposure to Green Marketing and Green Purchase Decision 35
5.4 𝐻03- Green Scepticism and Green Purchase Decision 36
5.5 Independent Variables 37 6. Conclusion 38 6.1 Conclusion 38 6.2 Managerial Implications 38 6.3 Limitations 39 6.4 Future Research 39 7. References 41
8. Appendix - The Survey 46
List of Models and Tables
Model 1: Conceptual Model Created by the Authors 12
Model 2: Deductive Approach 14
Table 1: Consumer Typology Retrieved from Rex and Baumann (2007) 5
Table 2: Survey Construction 17
Table 3: Demographics of the Respondents 25
Table 4: Sample Frequencies and Percentages of Variables 27 Table 5: Chi Square tests on the Study Population (Control Variables and Green Purchase Decisions) 27 Table 6: Chi Square tests on the Sample (Control Variables and Green Purchase Decisions) 28
Table 7: Cronbach’s Alpha Results 28
Table 8: Pearson’s Correlation 29
Table 9: Correlation Between Predictor Variables and Test for Collinearity 30 Table 10: Multiple Regression Analysis (EC, EGM and GSC on GPD) 30 Table 11: Linear Regression Analysis (EC, EGM and GSC on GPD) 31
1. Introduction
The background to pro-environmental behaviour is presented with a particular focus on green purchase decisions, environmental concern, exposure to green marketing and green scepticism. Following this, the problematisation and purpose of the present study are proposed and finally leads to the research question.
1.1 Background
Consumers have been increasingly demanding more environmentally friendly products, year after year (Finisterra Do Paço, Barata Raposo & Filho, 2009; Dangelico & Vocalelli, 2017; UL Environment, n.d.). Environmental concerns and the demand by consumers for environmentally friendly products has led to the appearance of a ‘new marketing ideology’, known as green marketing (Govender & Govender, 2016). The appearance of green marketing has expanded rapidly in the most recent years (Awad, 2011; Delmas & Burbano, 2011). Being ‘eco’, ‘environmentally friendly’ and ‘green’ are phrases commonly used in green marketing, and even though green claims should be easy to identify and clearly stated, they face the danger of coming off as fraudulent (Chen & Chang, 2012). Green is the term used throughout the study at hand in accordance to previous studies in this field of research (Chen & Chang, 2012; Finisterra Do Paço et al., 2009; Goh & Balaji, 2016; Kumar & Ghodeswar, 2015; Rahbar & Wahid, 2011) to signify pro-environmental characteristics. There are some companies who mislead consumers, thus taking part in an act known as “greenwashing” where the consumers are deceived in regard to the environmental benefits of the products or practices (Delmas & Burbano, 2011; Parguel, Benoît-Moreau & Larceneux, 2011). This could lead to green scepticism amongst consumers (Raska & Shaw, 2012), which has in the past been defined as doubt and mistrust towards messages and claims made in regard to green products (Mohr, Eroglu & Ellen, 1998).
Increasing environmental concern and environmental awareness have had a positive effect on green purchasing and have introduced us to the green consumer (Akehurst, Afonso & Gonçalves, 2012). ‘Greenness’ will be applied throughout the present study as a term to signify characteristics of pro-environmental behaviour and ideologies possessed by consumers. Although the green consumer has been identified to increase their awareness about the environment as a result of green marketing exposure (Awad, 2011), the change in their green purchase decisions was not as significant (Moisander, 2007). A particular focus on a young sample is needed when researching pro-environmental behaviour as they can be seen as
representative of the society (Kanchanapibul, Lacka, Wang & Chan, 2014). To further explain the green purchase behaviour of consumers, previous studies have focused on underlying factors that can generate changes in intentions for purchasing environmental products, such as values and attitudes (Kozar & Connell, 2013).
There is great complexity in identifying and determining the specific factors of green consumption solely by exploring the consumer’s own characteristics (Rex & Baumann, 2007). Whilst some factors have been identified in predicting green consumption behaviour, the area remains unclear and in need of continuous research regarding consumers’ green perceptions (Johnstone & Tan, 2015). Therefore, the study at hand will focus on contributing to this area. In the present research, environmental concern, exposure to green marketing and green scepticism in relation to green purchase decisions amongst young consumers will be examined. 1.2 Problematisation
The evolution of how individuals live their lives and what products they purchase expands their awareness of the environmental and ecological protection of the planet (Awad, 2011). However, more extensive information about consumer purchase behaviour is requested by companies as a result of an increased desire for green products (Kumar & Ghodeswar, 2015). Increased exposure to green marketing could diminish its intended impact on consumers (Mohr et al., 1998) and lead to a change in their purchase behaviour (Finisterra do Paço & Reis, 2012). A connection between exposure and scepticism has been identified (Elhajjar & Dekhili, 2015; Strother & Fazal, 2011), and there is a great risk that exposure can create scepticism or reluctance amongst consumers, and ultimately negatively affect environmental concern and green purchase decisions (Goh & Balaji, 2016). With green marketing comes the misunderstanding and confusion amongst consumers regarding the vague terminology used, which in turn, can increase green scepticism (Finisterra do Paço & Reis, 2012; Chen & Chang, 2012). It has therefore been suggested that scepticism is further researched in order to identify what else it could influence (Goh & Balaji, 2016). As some consumers are concerned with environmental issues and want to act in favour of the environment but do not follow through in buying green, what is known as an ‘action/awareness gap’ has incurred (Pickett-Baker & Ozaki, 2008; Ramayah, Lee & Mohamad, 2010; Szmigin, Carrigan & McEachern, 2009). This study will, therefore, further investigate the aforementioned contradictions and uncertainties
by investigating the influence of environmental concern, exposure to green marketing and green scepticism on green purchase decisions.
1.3 Purpose
As Swedish consumers are at the forefront of the green movement (Isenhour, 2010) it is of interest for the study at hand to view their degree of ‘greenness’ in quantifiable terms and investigate the green purchasing of the younger generation and what could potentially influence their decision. Additionally, the purpose is to investigate how young consumers’ green purchase decisions can be influenced by their environmental concern, exposure to green marketing and green scepticism. The present study, therefore, aims to provide a ‘snapshot’ of the ‘greenness’ within the generation and will identify whether there is an action/awareness gap amongst the respondents and if so, how large it is. Additionally, this research sets out to recognize what amount of the young Swedish consumers can be identified as ‘green’ consumers. Furthermore, with the recent increase in green marketing, it will be discovered whether it has increased to the point where it can be classified as overexposure and begin to negatively affect consumers’ green purchase decisions. The aforementioned will be analysed by conducting correlation and regression analyses to test the possible relationships and nature of the effects amongst the independent variables (environmental concern, exposure to green marketing and green scepticism) and the dependent variable (green purchase decision)- and with the results, the research question set for the study at hand shall be answered.
1.4 Research Question
How can environmental concern, exposure to green marketing and green scepticism influence young consumers’ green purchase decisions?
2. Literature Review
In this section of the research paper, relevant literature is presented. This includes introducing the green consumer and environmental concern, green marketing and its counterpart greenwashing, green scepticism and the consumer’s green purchase decision. The conceptual model of the present study, created by the authors, is thereafter shown. Lastly, three hypotheses are formulated.
2.1 The Green Consumer
At the turn of the millennium, consumers became more aware of the environment and Awad (2011) described a green consumer as someone who will “... avoid products that are likely to endanger the health of the consumer or others; cause significant damage to the environment during manufacture, use of disposal; consume a disproportionate amount of energy; cause unnecessary waste; use materials derived from threatened species or environments” (p. 57). Kinnear, Taylor and Ahmed (1974) believe that a ‘green consumer’ has two attributes- they express an attitude of concern, and their purchase behaviour is aligned with maintaining the ecology system. This thesis has chosen to define green consumers in accordance with Kinnear et al. (1974) throughout the research and use it as a basis of quantifying green consumers later on in the analysis. As a consumer is able to purchase a green product without being aware of its environmental benefits, the dimensions of attitude and behaviour were incorporated into ecological concern (Kinnear et al., 1974).
Five segments of consumers have been identified by US Roper Starch Worldwide Inc. 2000 (Charter, Peattie, Ottman & Polonsky, 2002) in which the level of concern and action varied in each category, in regard to green values and green purchases. Figure 1 below shows the five segments and their corresponding characteristics regarding buying green products. Although price has been shown to be an important factor in the decision making for consumers in the past, it has in recent years been proven that consumers are in fact willing to pay extra for environmentally friendly products (Charter et al., 2002; Laroche, Bergeron & Barbaro-Forleo, 2001).
Table 1: Consumer Typology Retrieved from Rex and Baumann (2007)
Polonsky, Vocino, Grimmer and Miles (2014) investigated how consumers’ past and future decisions are reflected in their environmental orientation and if that could be seen in their pro-environmental consumption behaviour. It was found in their study that consumers' own environmental orientation did in fact reflect their pro-environmental behaviour. Nonetheless, the consumers did not always manage to make environmentally conscious decisions due to their lack of long-term awareness of their actions. Polonsky et al. (2014) found that a consumer with a present-oriented mindset would favour a near future effect, while those that considered themselves future-oriented were found to be more aware of their environmental actions, and therefore wanted to engage more in pro-environmental consumption. It was further stated by Polonsky et al. (2014) that people with a stronger focus on the past would be harder to teach about the future and long-term effects on the environment. Therefore, how environmentally aware a consumer was would reflect in their wish to act in favour of the environment. This was also confirmed by Leonidou and Leonidou (2011).
With regards to focusing on young consumers, in particular, it has been found in a study by Govender and Govender (2016) that young consumers were greatly inclined by their natural and social environment and the awareness they possessed when purchasing green products. On the other hand, Ansar (2013) and Alharthey (2019) found contradictory results whereby demographic variables such as age, gender, and educational level showed no significant correlation to green purchase behaviour. When looking at Sweden in particular, it is a nation that has a thriving consumer culture with a strong environmental ethic and proactive focus of advocating sustainable living (Isenhour, 2010). In the study at hand, the identification of the green consumer will be done with a focus on young Swedish consumers as the chosen sample.
2.1.1 Environmental Concern
A person could be described as environmentally concerned when they support or contribute to attempts to help solve environmental issues; it relates to their consciousness about environmental problems (Suki, 2016). Despite consumers expressing environmental concern, their purchases at the check-out do not support their ethical values (Szmigin et al., 2009). Akehurst et al. (2012) discovered a potential ‘new time’ where the effects of green purchase decisions closely reflected consumers' environmental beliefs, which contradicted some of the previous research done in this field. Studies by Suki and Suki (2015) and Suki (2013) found that younger consumers were more environmentally concerned when it came to the consumption of green products. Environmental concern amongst young consumers was also revealed high when they were found to make ecological purchases (Heo & Muralidharan, 2019).
Consumers are encouraged to purchase environmentally friendly products by one out of two possible benefits- either a personal benefit or an ‘other-benefit’ (Green & Peloza, 2014). Previous studies have found that green marketing exposure in the mode of media had a positive relationship with environmental concern in adults (Good, 2006; Holbert, Kwak & Shah, 2003). Regarding green purchase decisions, Esmaeilpour and Bahmiary (2017) found that the environmental attitude of consumers exerted a positive influence on their decision. On the other hand, research by Straughan and Roberts (1999) found that environmental concern did not play an essential role in ecologically conscious consumer behaviour. The present study will contribute with up-to-date findings on the relationship between environmental concern and green purchase decisions, with a particular focus on young consumers.
2.2 Green Marketing
The rise of environmental concern and the need for more environmentally aware consumers has led to the increased usage of green marketing. In its early stages, green marketing was used to gain attention to more environmentally friendly products, but its purpose has shifted to now be more so an act of social responsibility (Awad, 2011). Nonetheless, companies have continued to increase their efforts in targeting green consumers (Mishra & Sharma, 2014). Green advertising has continued to dramatically increase; as of 2011 its presence had tripled in three years and increased tenfold in regard to the previous twenty years (Delmas & Burbano, 2011).
Green marketing was defined by Groening, Sarkis and Zhu (2018) as “... actions directed to all consumers, and incorporates a broad range of marketing activities (including planning, process, production, promotion, and people) designed to demonstrate the firm's goal of minimizing the environmental impact of its products and services” (p. 1850). While green marketing does possess the general characteristics of advertising: informing, selling and persuading, the main goal of green marketing has been argued to create awareness, curiosity and interest towards green brands and products (Finisterra do Paço & Reis 2012; Maheshwari, 2014; Rahbar & Wahid, 2011). Rahbar and Wahid (2011) and Maheshwari (2014) have stated that with extended knowledge about the environment and the green products, the consumer can make more aware purchase decisions. Additionally, Akehurst et al. (2012) claimed that green marketing communication in the future should come from a place of emphasizing the green features of the products, instead of educating the consumers on environmental problems in general. Kumar and Ghodeswar (2015) also argued for the importance of considering the green consumers’ own environmental concern in relation to the efforts of green marketing that are being practised, in order to highlight its benefits clearly and encourage the green purchase decision.
It has been shown previously by Pranee (2010) the imperativeness of transparency and truthfulness in environmental claims, since they are derived from sustainability policies and governmental regulations. In a study conducted by Pickett-Baker and Ozaki (2008), green marketing did not show a stronger engagement towards the green products, on the contrary, consumers claimed the marketing of green products did not come across as engaging to them. Even if a consumer that could be classified as ‘green’ was more open-minded to the exposure of green marketing, caution must be taken to not oversell and use messages that could confuse consumers and therefore push them to scepticism (Finisterra do Paço & Reis, 2012).
The increasing scepticism and unlimited amounts of information connected to the expanded exposure of green marketing and sustainability communication efforts have also been identified in previous studies (Elhajjar & Dekhili, 2015; Strother & Fazal, 2011). This is highly relevant for the present study that will try and identify if there is a now a low tolerance towards green marketing efforts due to its potentially excessive exposure. Previously, environmental advertisements have been found to have a positive influence on purchase behaviour (Ansar, 2013). This was also the result in research conducted by Govender and Govender (2016) where
they found that participants believed that they were influenced by green marketing and that it strongly affected their purchase decisions. Those same participants also believed that green products were insufficiently promoted. Lee (2010) tested whether media exposure to green marketing promoted green purchase behaviour in young consumers. Out of all the factors tested in that study, exposure to green marketing in the media exerted the least influence on the sample. This study will provide up-to-date research within the area of exposure to green marketing and its effect on consumers’ green purchase decisions. The present study contributes with a specific focus on young Swedish consumers’ green marketing exposure, to further investigate its influence on green purchase decisions.
2.2.1 Greenwashing
Greenwashing can be understood as misleading and deceptive marketing with fake and vague environmental claims, being used to attract more customers and to gain competitive advantage (Carlson, Grove & Kangun, 1993). It has been found to have a negative effect on consumers’ trust for brands, hence increasing scepticism about brands’ environmental efforts (Raska & Shaw, 2012). Amplified use of greenwashing amongst marketing, has made it difficult for a consumer to conduct an educated and informed green purchase decision (Zhang, Li, Cao & Huang, 2018). Raska and Shaw (2012) discovered that while greenwashing increased green scepticism, it could also in the long-term harm a consumer’s personal attempts in becoming more environmentally friendly and responsible in their everyday life.
2.3 Green Scepticism
The current increase of green marketing has led to confusion amongst consumers concerning some of the claims in the advertising (Elhajjar & Dekhili, 2015). The use of terminology such as ‘environmentally friendly’ and ‘biodegradable’ which have no agreed-upon meaning, has contributed to this confusion. Therefore, the struggle for consumers to discover the ‘environmental truth’ has led them to become sceptical towards green marketing (Finisterra do Paço & Reis, 2012). Green scepticism has been identified as a phenomenon where consumers express doubts towards green products and has been found to have a negative relationship with green purchase decisions (Leonidou & Skarmeas, 2017). The scepticism that could occur towards green advertisement could be seen as a representation of risk avoidance when purchasing green products. Additionally, a correlation can be argued for between consumers' loss of confidence in environmental claims made by companies and the consumers’ purchasing
decisions and general environmental behaviour (Laroche et al., 2001). Furthermore, Ottman, Stafford and Hartman (2006) concluded that an increase in green scepticism amongst consumers can be a result of their inability to verify the environmental and consumer values of green products.
Some researchers have previously labelled scepticism as being a trait carried by a person (Skarmeas & Leonidou, 2013), whilst others see it more as a state of the consumers that could be influenced by situations and outside factors, not solely on a consumer's own personal traits (Patel, Gadhavi & Shukla, 2017). Therefore, it is hard to identify a general perception of the scepticism amongst consumers towards green marketing. Finisterra do Paço and Reis (2012) argue that the way consumers responded to green products could vary depending on the current context and situation.
Albayrak, Aksoy and Caber (2013) stated that scepticism has been found to have a negative effect on the advertisements seen. When a consumer was sceptical about a company’s environmental claims, it negatively impacted the desired effect of green marketing and the expected purchase behaviour. Additionally, it was argued that scepticism often gets ignored as a factor when studying the purchase behaviour of an environmentally conscious consumer and that more research is needed (Albayrak et al., 2013). There is previous research that has shown no correlation between scepticism and green purchase decisions, even though the particular demographic possessed environmental concern (Finisterra do Paço et al., 2009). Goh and Balaji (2016) found that scepticism had a negative effect on environmental concern and green purchase decisions, and they suggested that future research should look into other factors that scepticism could influence. This research paper sets out to continuously add to and study green scepticism and its effect on green purchase decisions, and whether it also is affected by or affects environmental concern amongst consumers. Also, whether it can potentially be due to the exposure of green marketing.
2.4 Green Purchase Decision
The complexity of consumer behaviour in addition to the awareness and motives for purchasing products that are green has varied a lot- sometimes, it has even contradicted itself (Cleveland, Kalamas & Laroche, 2005; Moisander, 2007). The environmentally favourable behaviour of the individual could conflict with collective goals and consequently, the individual consumer
could be motivated by the positive outcomes, rather than the actual activity itself (Moisander, 2007). Additional research has shown that any environmental and sustainable behaviour could influence future sustainable behaviour in other areas, and with that came the sociocultural effects and personal factors along with any present behaviours (Phipps et al., 2013). It has been proven that young consumers claim to have knowledge about environmental aspects, yet it is not always reflected in their general green purchase behaviour (Finisterra do Paço et al., 2009). Contradicting that, Kanchanapibul et al. (2014) found that young consumers were highly educated within environmental issues and it positively affected their green purchase behaviour. In support of this finding, an additional study on young consumers discovered a positive relationship between environmental concern and green purchase decision (Muposhi, Surujlal & Dhurup, 2015).
Underlying factors of the purchase decision of environmentally aware consumers such as attitude and knowledge have been of focus in previous studies (Cohen, 1973; Esmaeilpour & Bahmiary, 2017; Rhabar & Wahid, 2011). Further factors have been examined in relation to consumers' decisions to purchase environmentally friendly products and are divided into intrinsic attributes and external factors. Intrinsic attributes included environmental responsibilities and the willingness to deepen one's knowledge about the environment. External factors regarded factors such as the features of the product itself that were influential within the purchase decision (Kumar & Ghodeswar, 2015).
Chen (2010) claimed that how one ultimately chooses a specific service or product is founded on the beliefs and expectations of the consumer. Joshi and Rahman (2015) concluded that basic knowledge about environmental issues was not enough to motivate consumers to purchase green products. Albayrak et al. (2013) discovered that environmental concern and scepticism did affect green purchase decisions; environmental concern had a positive effect, and scepticism a negative. The aforementioned study also stated that there was a need for similar studies in the future to further study the variables that could negatively influence green purchase behaviours. Sheikh, Mirza, Aftab and Asghar (2014) found a positive relationship between green marketing and green purchase decisions and also suggested that this should be further studied. Therefore, this research paper will continue to study the impact of environmental concern, green marketing exposure and scepticism on green purchase decisions.
2.5 Conceptual Model of the Theoretical Relationships
After reviewing previous literature, a conceptual model for this research was created. Figure 2 below demonstrates the model, created by the authors of the present paper. The following factors of environmental concern (Albayrak et al., 2013), exposure to green marketing (Maheshwari, 2014; Rahbar & Wahid, 2011) and green scepticism (Raska & Shaw, 2012) have been identified from previous research and have been investigated regarding their individual and combined effect on a consumer’s green purchase decision. However, a relatively uncharted approach that will be addressed in the study at hand is the potential overexposure to green marketing. Consequently, identifying potential negative responses that might occur amongst young consumers in the form of a change in their green purchase decisions. The aforementioned approach was deemed highly relevant to research, to expand the understanding amongst consumers and marketers and show potential pitfalls of the increased marketing efforts. In the present study, environmental concern, exposure to green marketing and green scepticism are the independent variables and green purchase decision will act as the dependent variable.
Research has found varying results for the correlation of environmental concern on green purchase decisions (Albayrak et al., 2013; Muposhi et al., 2015) and thus remains an unclear area. Therefore, this research will contribute with knowledge on the relationship between the two variables, specific to young, Swedish consumers. As green marketing is a relatively recent occurrence which has increased dramatically (Elhajjar & Dekhili, 2015) and has not remained within its original purpose (Awad, 2011), this research shall look into whether consumers are now ‘overexposed’ and how their exposure level to green marketing affects their green purchase decisions. The increase in green marketing has been argued to create confusion amongst consumers and therefore led to an increase in scepticism (Finisterra do Paço & Reis, 2012). Again, this research area remains uncertain as results vary amongst studies. As it is a factor which is often disregarded and more research is needed within the topic (Finisterra do Paço et al., 2009), green scepticism will also be tested in this research, against green purchase decisions.
Model 1: Conceptual Model Created by the Authors 2.6 Hypotheses Formulation
2.6.1 Environmental Concern and Green Purchase Decision
The environmental concern amongst consumers has been claimed to have increased since the turn of the millennium (Awad, 2011). A suggested ‘new time’ suggests that a consumer's purchase decisions should be closely related to their environmental beliefs, and therefore implies that if one possesses environmental concern, they will also purchase green products (Akehurst et al., 2012). It has been found in previous studies that environmental concern had a positive impact on consumers’ purchase decisions (Albayrak et al., 2013; Esmaeilpour & Bahmiary, 2017). Young consumers in particular have been found to be more environmentally concerned when they also purchased green products (Heo & Muralidharan, 2019; Suki & Suki, 2015; Suki, 2013). Based on fact that environmental concern varies amongst age groups and affects green purchase decisions differently (Finisterra do Paco et al., 2009), the first hypothesis was created:
𝑯𝟎1 Environmental concern will affect the young consumer’s green purchase decision positively.
2.6.2 Exposure to Green Marketing
As green marketing has increased in recent years (Awad, 2011; Delmas & Burbano, 2011), it has been argued that further exposure can lead to a decrease of impact in its intended message (Mohr et al., 1998). Continuous efforts in targeting consumers with green marketing are being taken (Mishra & Sharma, 2014). The information provided through green marketing can further lead to a disbelief in the environmental approaches used (Mohr et al., 1998). Furthermore, previous research has showed a weak perception of green marketing amongst consumers, where it was found disengaging (Pickett-Baker & Ozaki, 2008). Overselling and confusing consumers is a danger that could occur as a result of high exposure to green marketing (Finisterra do Paço & Reis, 2012). With this in mind, the second hypothesis has been developed:
𝐻02 Exposure to green marketing will affect the young consumer’s green purchase decision negatively.
2.6.3 Green Scepticism and Green Purchase Decision
As green marketing has heavily increased (Elhajjar & Dekhili, 2015) and its original intended purpose has developed into an act of social responsibility (Awad, 2011), the occurrence of greenwashing has emerged (Delmas & Burbano, 2011). Due to the vagueness and uncertainty that comes with understanding the terminology and intention of environmental claims (Finisterra do Paço & Reis, 2012), consumers have become sceptical towards the green marketing they come across. Furthermore, there is great complexity in attempting to label scepticism. It has been argued that scepticism is a personal trait that is held by consumers and this in turn can explain green scepticism (Skarmeas & Leonidou, 2013). Scepticism has been found to have a negative effect on consumers and their desired purchase behaviour (Albayrak et al., 2013). Therefore, further research is needed to continuously attempt to identify green scepticisms action changing and its potential underlying reasons (Goh & Balaji, 2016). Consequently, the last hypothesis was developed:
𝐻03 Green scepticism possessed by consumers will affect the young consumer’s green purchase decision negatively.
3. Methodology
In the following chapter, the chosen research approach, details of the conducted self-completion survey and the data collection process are presented. Additionally, the methodology includes specific features of the chosen sample and the statistical tests done for data analyses. Lastly, the present paper’s credibility, reliability and validity standpoints are expressed.
3.1 Research Approach
Since the present research set out to test hypotheses and was based on theories, it was done through a quantitative approach. Primary numerical data was collected through the use of an online self-completion survey. The study, therefore, took a deductive approach to research whereby knowledge around the domain was gathered through theories (Hair, Celsi, Money, Samouel & Page, 2015). Consequently, this led to the creation of hypotheses, which in turn were subject to empirical scrutiny and alteration of theory (Bryman & Bell, 2011). In the case of this present research, environmental concern, exposure to green marketing, green scepticism and consumer’s green purchase decision, were investigated before the creation of the aforementioned hypotheses. In accordance with Ozaki and Sevastyanova (2011) and Rahbar and Wahid (2011), a quantitative survey was considered an appropriate method to gather statistically significant answers in this field of research. A quantitative methodology approach through a questionnaire was chosen to be able to gather as much data as possible within a limited time frame as argued by Ozaki & Sevastyanova (2011). Hox and Boeije (2005) claim that the approach of a survey to collect primary data is suitable when studying feelings, opinions and attitudes within a population. Therefore, primary data was collected for the study at hand in order to answer the specific research question and to test several variables within the research. Model 1 below, was constructed for the present study to reflect the deductive approach taken.
3.2 Survey Design
3.2.1 Dependent and Independent Variables
In order to measure the dependent variable, green purchase decisions, two statements were used. These statements were adapted from a study conducted by Lee (2008) regarding factors affecting green purchase behaviour. The two statements were intended to reveal the green purchase decisions of the respondents.
Four statements which were previously used by Finisterra do Paço and Reis (2012) and which are originally from Dunlap and Van Liere (1978), were chosen to be adopted in this study to identify the level of environmental concern expressed by the respondents. Items to map out the exposure to green marketing were next in the survey. The three statements used to measure exposure to green marketing were adapted from Strother and Fazal (2011). The following section consisted of items regarding green scepticism. Mohr et al. (1998) created their own measure of scepticism regarding green marketing claims in marketing communications by combining previous methods used by past researchers. Statements regarding scepticism were first found in a study byFinisterra do Paço and Reis (2012) who had adapted them from the original source (Mohr et al., 1998). The items used were adapted to suit the present study to make the survey construct suitable for the study at hand. Alterations to the various survey items was needed. This was done to minimize the risk of creating an over extensive survey that strays from the research objectives of the present study.
3.2.2 Control Variables
Four control variables were first introduced to identify the demographics of the respondents; this included age, gender, highest completed educational level and nationality of the respondents. These control variables were adapted from Lee (2010) and Goh and Balaji (2016). The inclusion of control variables made it possible to filter out answers from participants who are not part of the intended sample of the present study.
3.2.3 Scales
The survey created for this study was based on established scales and items used in previous research, to justify measurements of the factors studied. The majority of the items (5-11 and 15-21) in the survey were measured with a five-point (1= strongly disagree, 5= strongly agree) Likert-scale with a bipolar numerical response format. A high score (4 or 5) on these
items indicated a strong positive attitude towards the statement and a low score (1 or 2) showed a negative attitude to the statement made. Additionally, a middle score (3) indicated a neutral opinion. Using a Likert-scale was suitable for the present study for the ability to measure the strength of agreement or disagreement in relation to attitudes and opinions and also the intensity of the participants’ feelings regarding the issues presented (Bryman & Bell, 2011; Hair et al., 2015). Another reasoning for the usage of a Likert-scale is the
administrative benefits and how it can be easily interpreted and established (Rosendo & Pérez, 2016). The present study chose to include an odd-numbered Likert-scale which included a midpoint in order to avoid respondents artificially creating an opinion and to provide them with the option to opt for a neutral answer, which ultimately increases measurement reliability and validity (Armstrong, 1987; Weems & Onwuegbuzie, 2001). For statements 12, 13 and 14, a different response scale was adapted (1= too little, 5= too much) to suit the nature of the statements. Four statements in the survey were in ‘reverse’ (marked with “(R)” in Table 2 below) whereby the coding for them must also be reversed. Reverse statements were included to correct agreement bias which can occur when there are no reverse statements, disrupt non-substantive response behaviour, and improve scale validity by broadening the coverage of the underlying construct (Weijters & Baumgartner, 2012). For identifying the responses in the survey, the Likert scale was pre-coded with numbers to efficiently process the data (Bryman & Bell, 2011). This was done with regards to using closed statements in the survey items.
Table 2: Survey Construction Variable Definition of
Variable Statements Source of Statements Control Control variables are
extra variables that could have an influence on the relationships between the main variables of the study (Bryman & Bell, 2011) 1. Age 2. Gender 3. Nationality 4. Educational level Lee (2010) and Goh and Balaji (2016) Environmental Concern Environmental concern regards a person’s consciousness regarding environmental problems (Suki, 2016).
5. Mankind in severely abusing the environment 6. Plants and animals exist primarily to be used
by humans (R)
7. Humans have the right to modify the natural environment to suit their needs (R) 8. The earth is like a spaceship with only limited room and resources
9. We are approaching the limit of the number of people that the earth can support
10. The balance of nature is delicate and easily upset
11. When humans interfere with nature, it often produces disastrous consequences
Finisterra do Paço and Reis (2012), originally from Dunlap and van Liere (1978). Exposure to Green Marketing Green marketing refers to advertising activities which concern environmental issues, promote environmentally friendly products and satisfy the green consumer (Liu, Kasturiratne & Moizer, 2012).
12. I believe the amount of information about green products provided through advertisement is...
13. I believe the amount of green marketing done by companies is…
14. I believe the amount of environmental messages I come across in advertisements is…
Strother and Fazal (2011). Green Scepticism Green scepticism is a phenomenon where consumers express doubts toward green products (Leonidou & Skarmeas, 2017).
15. Most environmental claims presented in advertising are true. (R)
16. Because environmental claims are overstated, consumers would be better off if such claims in advertising were eliminated.
17. Most environmental claims in advertising are meant to mislead rather than inform
consumers.
18. I do not believe most environmental claims presented in advertising.
19. Information from green advertising helps me to make better green buying decisions. (R)
Mohr, Eroglu and Ellen (1998) and Shrum, McCarty and Lowrey (1995) Green Purchase Decision A green purchase regards the purchase of environmentally friendly products (Chan, 2001).
20. I buy green products over non-green products when their product qualities are similar. 21. I buy products that claim to be
environmentally friendly
Lee (2008)
3.3 Sample
The sample chosen consisted of young (18-30-year-old), Swedish consumers. Therefore, the chosen unit of analysis in this study was on a consumer-level. The same particular age group has been investigated before within the field of green marketing (Finisterra do Paço et al, 2009; Finisterra do Paço & Reis, 2012; Mohr et al., 1998; Rahbar & Wahid, 2011; Strother & Fazal, 2011), and to further identify and add to those studies, this sample was chosen to contribute with research specific to the country, Sweden. Finisterra do Paço and Reis (2012) argued that focusing on young respondents provides a ‘snapshot’ of the future society in terms of green behaviour and is, therefore, a relevant generation to research.
Snowball sampling is a form of non-probability sampling (Rosendo & Pérez, 2016). This approach was chosen on the grounds of a greater potential response rate and participant accessibility, where initial contact was made through social media with encouragement to share the survey throughout the networks. As argued for by Bryman and Bell (2011), a self-completion web survey was chosen on the basis of the administrative benefits it provides and the fact that it is applicable to quantitative studies. Furthermore, using a web survey gives for a greater variance in the creation of the survey and makes it possible to create an
understandable and appropriate survey construct. Consequently, this gives the opportunity to pre-code and download the dataset into a database. However, issues were addressed regarding the limitations of controlling the sample size and knowing to what extent the survey and sample had been spread out. This was considered, and therefore control questions were asked to the survey population to be able to segregate the desired sample. The authors of the study found the approach particularly suitable as they are within the target age range and, therefore, their networks will to a great extent also reflect the sample characteristics.
3.4 Procedure
For this study, primary quantitative data was collected through an online survey that took the form of a self-completion questionnaire, constructed in Google Forms. A self-completion questionnaire is where the respondents individually reply to the survey, with the knowledge and skills they possess at that moment (Bryman & Bell, 2011). Since the authors of the paper at hand were not able to be present and help when respondents were completing the survey, it was important that the self-completion questionnaire should be clear and simple to follow, as Bryman and Bell (2011) clarify.
3.4.1 Pilot Study
as it tests the wording used, reveals the range of answers given on multiple-choice questions, and can provide warning of where the project could fail (Van Teijlingen, Rennie, Hundley & Graham, 2001). Once the results and comments were received from the pilot group, adaptations were made to the original version. Everything was phrased into statements rather than having a mix of questions and statements. Another Likert-scale response option was decided upon for the variable of exposure to green marketing, with considerations to how the items were going to be measured and answered in the survey. Lastly, a change of wording for item 16 was done, changing the word “over-exaggerated” to “overstated”, after considering the feedback from the pilot study.
3.4.2 Data Collection
After the pilot study was modified and approved by the control group, the final survey version was available to respondents from the 21st of April 2020 until the 4th of May 2020 (14 days). The survey link was spread by the authors on the social media platforms Facebook, LinkedIn, Instagram and Snapchat, as well as being sent to 192 university students at Mälardalen University via email. On Facebook and LinkedIn, the survey was displayed on the news feed as a public post for anyone to see and share onwards to their networks and friends. On Instagram and Snapchat, the story function was used, meaning that the authors’ followers had access to the survey link. Friends of the authors were also encouraged to send the survey link to their friends and colleagues and share the authors’ posts. Altogether, a total of 317 responses was collected.
3.5 Data Analysis
3.5.1 Data Preparation
When doing the analysis of the empirical data collected through the survey, the IBM SPSS Statistics tool was used. The chosen tool was thoroughly investigated and concluded to be the most suitable for the study at hand as it has been previously used in similar studies (Alhartney, 2018; Finisterra do Paço et al., 2009). The variables are measured with metric scales and were treated as interval variables, in accordance with Hair et. al (2015) and Bryman and Bell (2011). This was necessary in order to conduct the corresponding statistical tests that are appropriate for the specified data type. Firstly, the dataset was cleaned by removing two respondents who were under the age of 18. This was done since the intended sample was 18-30-year olds and parental consent would be required from participants who were under the age of 18. It has been
assumed that respondents who are 18+ are able to purchase on their own, and hence can answer questions about green purchasing. By deleting the two underage responses, the survey population was left with 315 responses. With the sample of focus being Swedish respondents in the age group of 18-30 years old, the control variables age and nationality were eliminated since they are predetermined in the sample. 140 responses reflected the chosen sample and thus were used for the main part of the analyses. Answers were then coded and reverse coded where needed using excel, before beginning SPSS analyses.
3.5.2 Cronbach’s Alpha
The Cronbach’s alpha estimate was the initial test conducted in accordance with previous studies (Alhartney, 2018; Goh & Balaji, 2016; Kumar & Ghodeswar, 2015). This was done to test the internal reliability of the items used and possibly remove any item which disturbed the consistency within the scale. The widely accepted value of Cronbach’s alpha is 0.7, whilst values between 0.6 and 0.7 are also considered moderately acceptable (Hair et al., 2015)- this will be the guideline in which this analysis will follow.
3.5.3 Chi-square Test
A Chi-square test was used as it can determine the relationship between two nominal variables in a confident manner (Bryman & Bell, 2011). This test was used on the two control variables of the chosen sample (gender and highest educational level) and the dependent variable, green purchase decision. For the whole population of the study, the Chi-square test was run between each of the four control variables on the dependent variable, separately. The Phi value reveals the nature of the relationship between the variables and can range from -1 to +1. Cramer’s V indicates the strength of the relationship between the two nominal variables and is always a positive value (Bryman & Bell, 2011). Phi values are generated when the two variables are dichotomous (Bryman & Bell, 2011), and thus were only presented for age and gender, which offered only two possible values.
3.5.4 Pearson’s Correlation
Pearson’s Correlation analysis was used as it provides a deeper understanding of the linear association, and therefore the relationship between variables (Hair et al., 2015). The analysis was run between all independent variables and the dependent variable (see table 4). The correlation coefficient can range from -1 to +1, indicating the relationship between variables, with values close to 0 showing no association (Hair et al., 2015). Descriptive statistics were
assessed by standard deviation and mean values (Meyers, Gamst & Guarino, 2013) for the separate independent variables and the dependent variable. A mean is understood as the average value of a data set and should be used with regards to interval/ratio variables (Bryman & Bell, 2011); therefore, it was deemed as appropriate to include in the present study. The standard deviation value is a measure of dispersions which shows for the average amount of variation around the mean value (Bryman & Bell, 2011).
Presented alongside the coefficient values are asterisks which signify the level of significance the values hold; one asterisk explains that the value is less than 0.05 and 2 that it is less than 0.01. At a 0.05 level, it can be inferred that there are 5 chances in 100 that the correlation could be due to chance and at a 0.01 level, only 1 chance; this demonstrates that there is a reasonably small degree of risk. It is imperative that both the coefficient and the significance level are looked at when examining the analysis (Bryman & Bell, 2011).
Results of the correlations were then placed in a correlation matrix in order to check for multicollinearity. The test for collinearity was done to identify any problematic values within the predictors (Belsey, Kuh & Welsch, 2004). The correlations between the predictor variables were tested initially (Pedhazur, 1997). Tolerance and the variance inflation factor were looked at in regard to the commonly used acceptable tolerance value of 0.1 (Tabachnick & Fidell, 2001) and a VIF value of 10 (Marquardt, 1970.; Neter, Wasserman & Kutner, 1989).
3.5.5 Regression Analysis
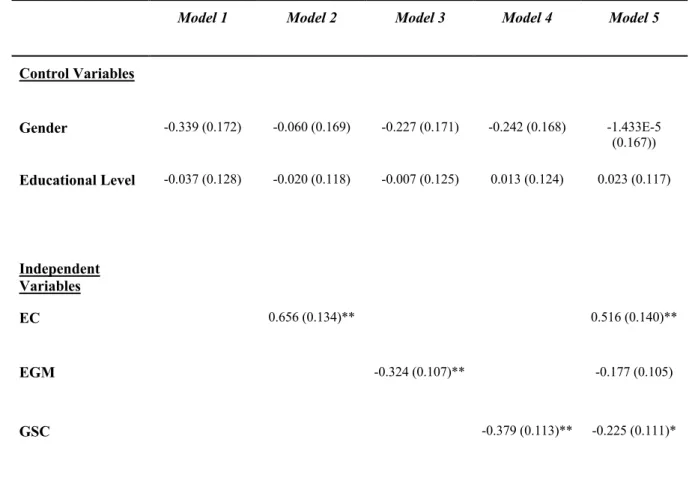
Next, a regression analysis was run in addition to a correlation analysis, as they are associative techniques in determining systematic and consistent relationships between two or more variables. A linear regression analysis (Meyers et al., 2013) was conducted between all of the independent variables separately and the dependent variable; this enables for a straight-line association between the variables (Hair et al., 2015). Effects of each independent variable tested were done in order to test the linear regression outcomes and compare with the multiple regression outcome. Here, regression coefficients were analysed to explain how much of the variance in the dependent variable is explained by the independent variables. Thereafter, multiple regression analysis was also run between the control variables (demographic variables) and an independent variable individually on the dependent variable, before testing everything together in model 5 of table 12.
For both regression analyses, 𝑅2 values were observed. The coefficient of determination, 𝑅#, is
also known as a measure of the goodness of fit whereby it reveals the amount of variation in the dependent variable that is associated with the variation in the independent variable(s). Values range from 0 to +1, whereby a stronger value indicates that the straight line works well and a lower value, that it does not. The unstandardised beta values (B) were assessed in order to explain and make comparisons of the independent variables’ influence on the dependent variable; values should range from -1 to +1, with the values closest to one (negative or positive) representing more importance when predicting the dependent variable. A positive value expresses a positive relationship, whereas a negative value shows for a negative one. Statistical significance is also of importance as it conveys confidence that the results from the statistical tests are reliable (Hair et al., 2015.
3.6 Quality Criteria
3.6.1 Reliability
As the present study is of a quantitative nature, the reliability lies within the results. Reliability is assessed in order to measure the stability of the results and whether the study is replicable (Bryman & Bell, 2011). The present paper is considered replicable since a similar sample could be gathered, the same analyses could be run, and the variables studied are not limited to the Swedish population. Internal reliability is also important to consider when conducting quantitative research. This criterion was met by conducting a Cronbach’s Alpha test, where all variables were deemed reliable.
3.6.2 Credibility
While a quantitative research method was best suited for this study, due to the present research’s aim to study a large population (Holton & Burnett, 2005), the research method does possess qualities that have received some criticism. The authors of the present study acknowledge that the findings of this research are not generalizable on statistical grounds and, therefore, shall not attempt to make a generalization to all young Swedish consumers, but provide insight to consumers who possess the same characteristics. According to Bernard and Bernard (2013), quantitative studies are often criticized due to the fact that they fail to understand that respondents are human and affected by the world around them. Respondents might interpret questions differently and they may not have adequate knowledge of the subject, prior to answering the survey. How the questions were asked in the present survey, is a way to
assure constructive validity (Bryman & Bell, 2011). Therefore, the study at hand made sure to test the format and questions before conducting the main study. This criticism was met by doing a pilot study. After making modifications based on the feedback given, the modified version was sent to the pilot group once more for approval, prior to beginning with the official data collection. This procedure increases the credibility of the study.
3.6.3 Validity
Looking at how the conclusion of two variables in relation to one another is able to be justified, counts for internal validity. This was tested in the present analysis. Internal validity is highly relevant for the present study as it shows that external interference should not produce a shift in the said outcome (Bryman & Bell, 2011). Nunnally (1967) justifies the testing of consistency between items in a quantitative survey methodology approach, showing for further internal validity. However, the external validity should show for the generalization of the present study’s results. Additionally, using and adapting scales and measurements that can show for the desired measures is highly important and identifying the underlying constructs of the obtained measures collected (Hair et al., 2015). This was met by adapting established scales that are suitable for the present study. As previously mentioned in 3.4.1, a pilot study was undertaken; this was done in order to increase the validity of the methodological approach chosen for the present study, by minimizing the chance of misinterpretations. In the present study, the focus of the measurements is on the dependent variable, green purchase decision, and additionally the independent variables, environmental concern, exposure to green marketing and lastly green scepticism. Throughout the literature review of the study at hand, the main focus was on showing for the variables and their relations to one another.
3.6.4 Objectivity
Confirmability, as well as objectivity, have been a focus throughout the writing process of the present study. Confirmability is concerned with whether or not the writers have allowed personal values or theoretical inclinations to affect their decision making (Bryman & Bell 2011). The paper at hand chose the subject of environmental issues due to personal interests and previous knowledge within business administration and marketing. However, all information is derived from previous research, published articles and theoretical literature. In addition to this, all topics and decisions made have been looked at from both a negative and positive point of view, in order to avoid subjectivism. Since the primary data was collected
from the authors’ networks, it could be seen as biased behaviour. However, all gathered data was anonymous and the authors did not analyse any data set individually.
4. Results
This chapter shows for the statistical tests carried out; descriptive statistics, Chi square, Cronbach’s alpha, Pearson’s correlation and regression analyses. This provides insight into the relations and natures of the results obtained.
4.1 Demographics
In Table 3 below, a complete representation of the entire data set is presented, as well as for the specific sample chosen for the study at hand. A total of 317 respondents answered the online survey, whereby the greatest majority were 18-30 years old with an almost equal split of males and females. The majority of the population was Swedish and had most often completed (or is undergoing) a bachelor’s degree as their highest level of education. The sample which was of focus for most of the analyses consisted of 140 Swedes aged between 18 and 30. The gender and educational level of the sample was reflective of the population, with an almost equal split between the genders (60% females and 40% males) and the majority having completed, or are currently undergoing, a bachelor’s degree.
Table 3: Demographics of the Respondents
Survey population Sample
Demographics Frequencies Percentage Frequencies Percentage Age 0-17 2 0.6% 18-30 256 80.8% 140 100% 31+ 59 18.6% Gender Female 204 64.4% 83 59.3% Male 113 35.6% 57 40.7%
Nationality
Swedish 164 51.7% 140 100%
Other European country 111 35%
Other non-European country
50 15.8%
Highest educational level (completed or ongoing) None 3 0.9% 0 High school 79 24.9% 30 21.4% Bachelor 183 57.7% 85 60.7% Master 66 20.8% 23 16.4% PhD 3 0.9% 2 1.4% Total (N) 317 140 4.1.1 Sample Characteristics
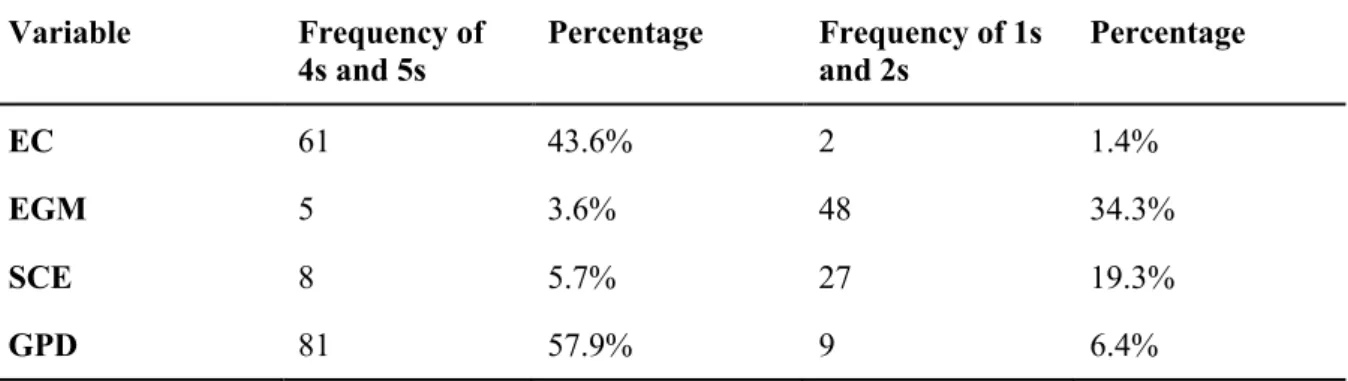
Excel was used to calculate frequencies of participants at bipolar ends of the variables studied (see table 4) using only answers 4 to 5 to account for a “high” valuation of the variable and 1 to 2 to account for a “low” valuation. It was found that a total of 61 respondents, 43.6% of the sample, can be considered environmentally concerned. The same method was used for the dependent variable and found that 81 respondents (57.9%) typically purchase green products. Regarding exposure to green marketing, more respondents were under exposed (34.3%) rather than over exposed (3.6%), with the majority being neutral on the matter and opted for 3 as an answer. The same goes for green scepticism whereby an even greater amount opted for option 3, revealing that most of the respondents are undecided, and not being sceptical following. A total of 43 respondents (30.7%) were both environmentally concerned and
purchased green products. 18 respondents (12.9%) were found to be environmentally concerned but did not purchase green products.
Table 4: Sample Frequencies and Percentages of Variables Variable Frequency of 4s and 5s Percentage Frequency of 1s and 2s Percentage EC 61 43.6% 2 1.4% EGM 5 3.6% 48 34.3% SCE 8 5.7% 27 19.3% GPD 81 57.9% 9 6.4%
4.1.2 Control Variables - Chi Square
The Chi Square tests for the control variables and green purchase decisions showed no statistically significant values, whereby p > 0.01 (see Table 5). Therefore, it can be concluded that no strong relationship exists between neither age, gender, educational level nor nationality in regard to the green purchase decision for the survey population of this study.
Table 5: Chi Square tests on the Study Population (Control Variables and Green Purchase Decisions)
Population
Variable Green purchase decisions Asymptotic Significance (2-sided) Cramer’s V value Phi Age 2.698 p = 0.100 0.093 Gender 1.848 p = 0.174 0.077 Nationality 2.489 p =0.288 0.089 Educational Level 1.665 p = 0.797 0.073
Similarly, no statistically significant results were found between gender nor educational level and green purchase decision for the sample, as p > 0.01 (see Table 6 below).
Table 6: Chi Square tests on the Sample (Control Variables and Green Purchase Decisions) Sample
Variable Green purchase decisions Asymptotic Significance (2-sided) Cramer’s V value Phi Gender 0.738 p = 0.390 -0.073 Educational level 0.936 p = 0.817 0.082
4.2 Cronbach’s Alpha - Reliability
With all variables tested being around the acceptable level of Cronbach Alpha (0.7), they were deemed as reliable. It was examined whether any items from within each variable could be removed in order to improve the alpha value; no item removal would make a significant change and so it was decided to not alter any of the variables. Table 7 below demonstrates the values found when analysing the target sample and shows that the variables used have internal consistency.
Table 7: Cronbach’s Alpha
Variable Number of
items
Cronbach alpha EC (environmental concern) 7 0.624
EGM (exposure to green marketing) 3 0.741
GSC (green scepticism) 5 0.678
GPD (green purchase decision) 2 0.782
4.3 The Pearson Correlation- Construct Validity
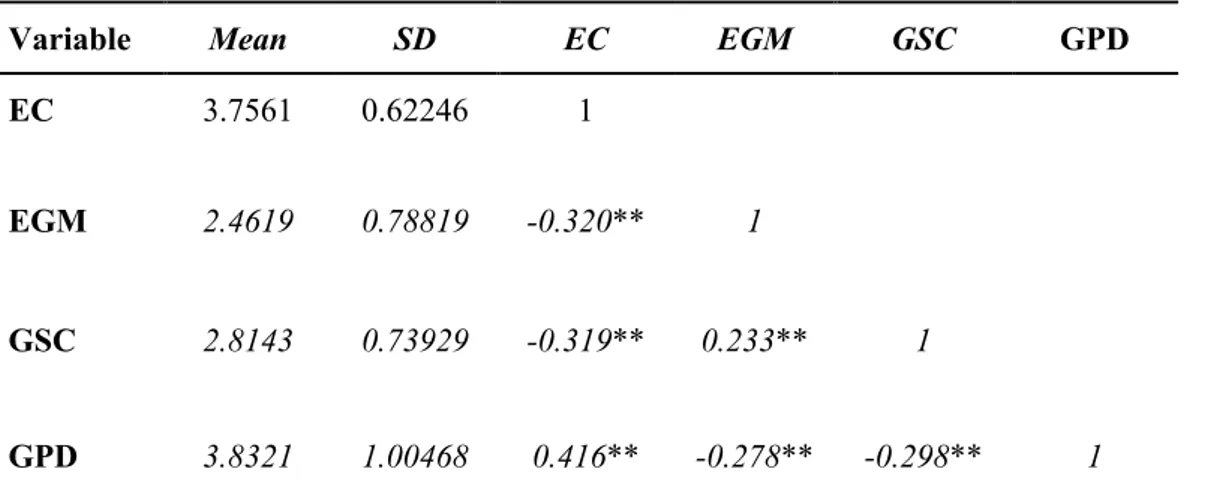
The Pearson correlation analysis (see Table 8) showed all correlations to be significant; three of which were between the independent variables and the dependent variable, and the remaining three between the independent variables. The strongest correlation coefficient with statistical significance (0.416), was found between environmental concern (EC) and green
purchase decision (GPD), whereby there was a positive correlation. This shows for when the EC of the consumer increases, so does their GPD. Furthermore, the correlation between exposure to green marketing (EGM) and GPD was negative (-0.278), showing for when one would increase, the other would decrease. Thus, if consumers' EGM increased, the GPD would decrease in accordance. Green scepticism (GSC) was found to have a negative correlation with GPD (-0.298), concluding that when GSC increases, the GPD decreases. Further significant findings were the negative association between EC and the other predictor variables EGM (-0.320) and GSC (-0.319). Finally, EGM proved a small negative correlation to GSC (-0.233). With respect to the means found for each variable, EGM and GSC were close to, but slightly more negative than, the neutral option (3), whilst EC and GPD were closer to 4, indicating a stronger positive valuation.
Table 8: Pearson’s Correlation
Variable Mean SD EC EGM GSC GPD
EC 3.7561 0.62246 1
EGM 2.4619 0.78819 -0.320** 1
GSC 2.8143 0.73929 -0.319** 0.233** 1
GPD 3.8321 1.00468 0.416** -0.278** -0.298** 1
Note: **. Correlation is significant at the 0.01 level (2-tailed)
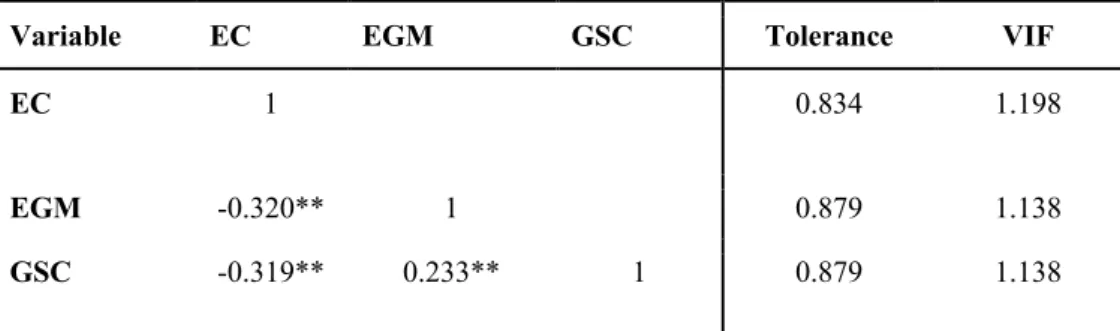
Before the regression analysis was conducted, the independent variables (EC, EGM and GSC) were tested for multicollinearity (see Table 9). No correlations close to 1.0 or -1.0 were found between the independent variables, thus no potential collinearity was observed. Furthermore, the test for multicollinearity showed no problematic values amongst the predictor variables (Table 9) and therefore, the outcomes in the model were deemed suitable and unproblematic in regard to the tolerance values and variance inflation values (VIF).
Table 9: Correlation Between Predictor Variables and Test for Collinearity
Variable EC EGM GSC Tolerance VIF
EC 1 0.834 1.198
EGM -0.320** 1 0.879 1.138
GSC -0.319** 0.233** 1 0.879 1.138
Note: **. Correlation is significant at the 0.01 level (2-tailed). *. Correlation is significant at the 0.05 level (2-tailed).
4.4 Regression Analysis
Analysis of the adjusted R squared value in Table 10 below reveals that 20.3% (0.203) of the variation in GPD can be explained by the independent variables, EC, EGM and GSC- the remaining variation being explained by variables outside of the scope of the model. This test was also proven to be statistically significant and therefore there is a confidence that the result from the statistical test is reliable and that the factors contribute in explaining green purchase decisions.
Table 10: Multiple Regression Analysis (EC, EGM and GSC on GPD)
Model R 𝑹𝟐 𝑹
𝒂𝒅𝒋
𝟐 Sig.
0.470% 0.220 0.203 0.000&
a. Predictors: (Constant) EC, EGM OGM, GSC. b. Dependent Variable: GPD
Furthermore, linear regression was carried out between each of the independent variables (EC, EGM and GSC) and the dependent variable (GPD) to show for the effects created by the variables independently on GPD. The results from the regression analysis can be seen in Table 11 below. All independent variables were of significant value in the analysis. When tested individually, 17.3% of the variance in the GPD could be explained by EC. EGM showed a variance of 7,8% in GPD. Another 9.8% of the variance in the dependent variable (GPD) could be explained by the GSC.