VTI särtryck
Nr 222 0 1994
Pavement Analysis Based on Measured
ln-Depth Deflection Data
Håkan Jansson and Leif G. Wiman
Paper presented at the 4th International Conference
on the Bearing Capacity of Roads and Airfields,
July 17 21, 1994, Radisson South Hotel, Minneapolis?
Minnesota, USA
Väg- och
VTI särtryck
Nr 222 0 1994
Pavement Analysis Based on Measured
ln-Depth Deflection Data
Håkan Jansson and Leif G. Wiman
Paper presented at the 4th International Conference
on the Bearing Capacity of Roads and Airfields,
July 17 21, 1994, Radisson South Hotel, Minneapolis,
Minnesota, USA
&»
Väg- och
transport-farskningsinstitutet
'
ISSN 1102-626XPAVEMENT ANALYSIS BASED ON MEASURED IN-DEPTH DEFLECTION DATA
Håkan Jansson & Leif G Wiman
Swedish Road and Transport Research Institute (VTI), Sweden
ABSTRACT
In-depth de ections were measured in three typical Swedish pavements during different seasonal conditions, as a part of a joint Norwegian/Swedish project. De ections in individual layers of the pavement were calculated with a number of computer programs,
including different material models, and compared to measured de ections. During
spring and autumn conditions, with no frozen zone in the pavement, the best match is
achieved with non-linear models (ILLI-PAVE). In the spring thaw, when the upper part
of the subgrade is still frozen, a good match is found with linear elastic models (CHEVRON). Algorithms were also developed for calculation of vertical compressive strains at the top of the unbound layers from the surface de ections measured with the Falling Weight De ectometer.
INTRODUCTION
Stresses and strains are calculated in pavement structures for evaluation and design purposes. Different models for the materials' behaviour under load may be used in the calculations. Materials may exhibit linear or non-linear stress-strain behaviour, and may in the linear elastic case be considered isotropic or anisotropic. De ections in different layers of the pavement were calculated with various computer programs, including different material models. Results were compared to the measured de ections in a joint Norwegian/Swedish project, where in-depth de ections were measured in pavements typical of these countries. Measurements were made in different seasons and repeated for three years [1,2,3]. In this comparison, the load of the Falling Weight De ectometer (FWD), approx. 50 kN, was used. The assumption is that the better the match between calculated and measured de ections in the individual layers of the pavement, the better the stresses and strains can be calculated. This is especially important when vertical strains in the unbound layers are calculated.
INSTRUMENTATION
The three Swedish pavement sections instrumented are shown in Figure 1. Measurements of the in-depth de ections were performed with four LVDT's (Linear Variable Differential Transformer) on top of steel bars anchored at different depths. The LVDT readings during loading are de ections between the surface and the anchor depth. By subtraction of de ections to different depths, de ections in different layers in the pavement are obtained. De ections are calculated for the following layers: asphalt concrete (AC) plus base, subbase, subgrade from formation level to 1.5 m below the surface and subgrade from 1.5 to 3 m below the surface. To distinguish between the two layers in the subgrade, the layers are termed the upper and lower subgrade. The FWD loadings are applied on the surface in different positions, so that in-depth de ections at different distances from the load can be calculated.
Road No. Road No.
34 30 30 30 234 30 30 30
V///////// Q) 6 sz qr f ggzg ?
©13 XWX : (A.. 332
(2314 s was:; »:C.A. Olo . _ __ _ __ (Dzo ... utigage...i. . . _ _ _
;'_.__.;._B_ 27 .,14.44 77728 ..50'. 55.03. 4 .: 4 _: 4 o. '. . o . . .. ©51 ::o...o.:o. ...-0 ©41 A = 6. = . ... o . , - o
'"'; ':' *;
3:32??
57
.. O'. O . : . ... . : __ W //;s='///s//"' 17s// ' '"" "77778 ' ' Clay !; 7150 A: 777300 G) AC Base©
(:) Subbase©
Sand Figure 1. Road No.72°
30 30 30
© 4 [_llillfllll ___ 77,19 : . . | __ 15 1/1: Ill-i m 777 57 ne SandDesign and instrumentation on test sections. Measurements are layer
thick-nesses, distances between LVDT's and anchor depth of steel bars, in cm.
One result from a measurement is shown in Figure 2. This shows measured de ections in the different pavement layers, together with the de ection basin measured at the same
time on the surface with the FWD. Surface de ections were measured with four sensors,
at 0, 300, 600 and 1200 mm from load centre. The shaded areas in the figure are the contributions of the individual layers to the total de ection, i. e. the surface de ection. In the figure, the de ections measured to the depth of 3 m below the surface are somewhat higher than the de ections measured with the FWD. Although this is not logical, the difference is small.
-1OO De fl ec ti on (u m) N _ ; O O O O (: O O O 400 500 Figure 2.
Distance from centre of load (mm)
Measured in-depth de ections and FWD surface 19 May 1987, road No. 34, FWD loading 52 kN.
l: Subgrade-Iower WWW Subgrade-upper (: Subbase _ AC & Base - -D- - Surface deflection deflection in spring,
CALCULATIONS
Deflections in the pavement were calculated with the following computer programs and models:
. CHEVRON. Linear elastic models. The program used has been modified at the Norwegian Institute of Technology [4].
. FLAP, "Four Layered Anisotropic Partial friction program" [5]. Anisotropic linear elastic models.
. ILLI-PAVE. Linear and non-linear elastic models. This program has also been modi ed at the Norwegian Institute of Technology.
Calculations were made in a manual iterative process until de ections in different layers under the centreline of the load matched the measured de ections in the pavement. The accepted discrepancy in a layer was 0.001 mm.
In some cases, for comparison, de ections in the pavement were also calculated from surface de ections, measured with the FWD. The backcalculation program used to
calculate moduli was:
. MODULUS [6]. Linear elastic models. Calculated moduli were input to the
CHEVRON program to calculate the in-depth de ections (and strains).
Due to different constraints in the programs, different assumptions regarding the subgrade were made, see Table 1. The difference between the two MODULUS calculations is that in case A the program calculated the depth to the stiff layer, while in case B the stiff layer was fixed at a depth of 3 m beneath the surface.
Table 1. Layers in the calculations with different programs (layers 1-3 are the same in
all calculations).
CHEVRON FLAP ILLI-PAVE MODULUS A MODULUS B Layer 1 AC AC AC AC AC
Layer 2 Base Base Base Base Base Layer 3 Subbase Subbase Subbase Subbase Subbase Layer 4 Subgrade 1) Subgrade 3) Subgrade 4) Subgrade 3) Subgrade 4) Layer 5 Subgrade 2) - Stiff layer Stiff layer Stiff layer Layer 6 Stiff layer - - -
-Note: 1) from formation level to 1.5 m beneath surface
2) from 1.5 to 3 m beneath surface
3) thickness varies (in FLAP the bottom of layer 4 are fixed) 4) from formation level to 3 m beneath surface
Since the AC and base layers were not separated in the measurements, the AC modulus
was chosen with regard to the measured temperature in the layer at the time of measurement. Moduli for the other layers were calculated in the iterative forward
manner described above. Other inputs used in the FLAP and ILLI-PAVE calculations
are shown in Tables 2 and 3. In the CHEVRON and MODULUS calculations, the same
Poisson's ratios were used as in Table 3. All inputs to the programs are based on a combination of laboratory results, experience and assumptions.
Table 2. Degree of anisotropy, relation between modulus in vertical (Ev) and
horizontal (Eh) direction, and Poisson's ratio used in FLAP calculations.
Layer Anisotropy (EV/Eh) Poisson's ratio AC 2 0.52
Base 2 0.6 Subbase 2 0.6 Subgrade 0.5 0.27
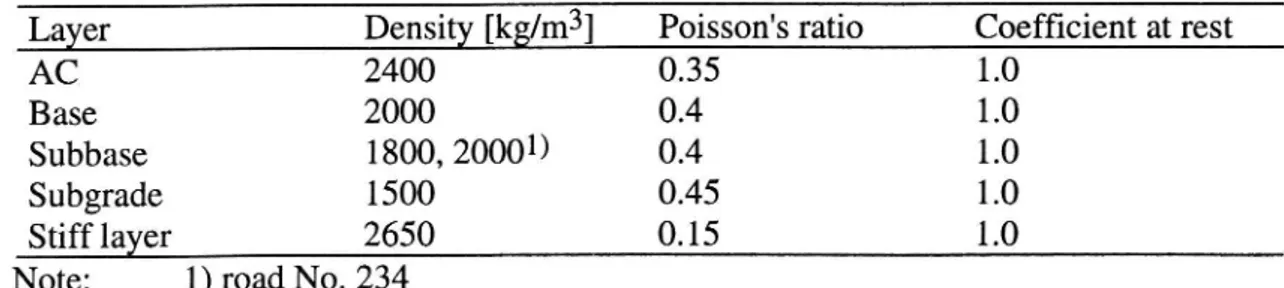
Table 3. Density, Poisson's ratio and coef cient of earth pressure at rest used in ILLI-PAVE calculations.
Layer Density [kg/m3] Poisson's ratio Coef cient at rest AC 2400 0.35 1.0
Base 2000 0.4 1.0 Subbase 1800, 20001) 0.4 1.0 Subgrade 1500 0.45 1.0 Stiff layer 2650 0.15 1.0
Note: 1) road No. 234
In the ILLI-PAVE calculations, materials were assumed to be linear elastic in the spring thaw, when there was a frozen zone in the upper subgrade. In the other seasons, spring
and autumn, they were assumed to be stress dependent, as a function of the bulk stress
(0) in the case of the base and subbase and as a function of the deviator stress (od) in the case of the subgrade. Moduli and stress dependences used are shown in Table 4.
Table 4. Moduli and materials models for layers used in ILLI-PAVE calculations, different roads and time of measurement. All constants in MPa.
Road No. Date AC Base Subbase Subgrade 34 85.04.10 6700 160 180 200 34 87.05.19 4700 10>k9 0.7 35449 0.5 31>k0'd -1.07 34 87.09.17 4700 12*0 0.7 32%) 0.5 56*0'd 1.07 234 85.04.12 6000 150 182 125 234 86.05.14 3500 3,74*e 0.7 40.8*0 0.5 256>1=5d -1.0 234 86.09.04 4300 4.83*e 0-7 46*0 0.5 283>kc5d -1.0 720 86.04.09 7000 452 209 92 720 87.05.20 7000 64:9 0.7 28.7*0 0.5 113>z=gd 0.5 720 87.09.16 7000 6.2*0 0.7 37.6*0 0.5 94*0'd -O.5
COMPARISON BETWEEN MEASURED AND CALCULATED DEFLECTIONS Measured and calculated de ections are compared for the three roads in different seasons (spring thaw, spring and autumn). One measurement from each season was chosen, making a total of 9 comparisons. Some general conclusions from these comparisons are:
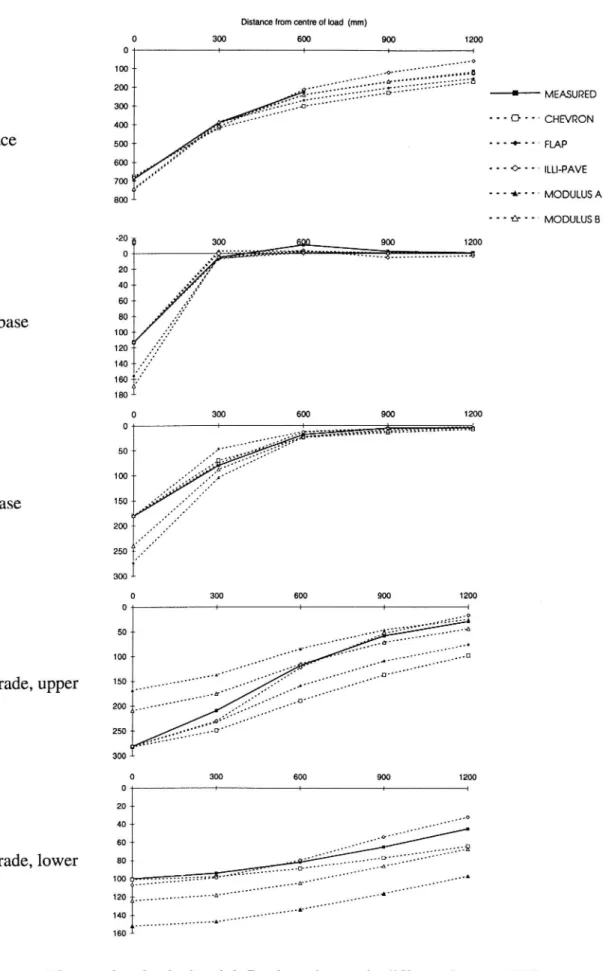
With no frozen zone in the pavement, spring and autumn, the de ection basins in the upper subgrade calculated with CHEVRON tend to be atter than the measured basins. Also the FLAP calculated basins are atter, although they are closer to the measured basins. The best agreement with measurements is found with the ILLI-PAVE calculated basins, even if they are sometimes atter and at other times steeper. See example in Figure 3.
De ections calculated in the subbase with FLAP are somewhat lower than those measured at distances of 300-600 mm from the load centre. Apart from this the
differences in de ections calculated with CHEVRON, FLAP and ILLI-PAVE are
fairly small and agree with the measured de ections. See example in Figure 3. Also in the AC and base layer, the differences in de ections calculated with CHEVRON, FLAP and lLLI-PAVE are fairly small and agree with the measured de ections. Either program, however, calculates the negative de ection, dilation,
measured at 600 mm from the load centre, shown in Figure 3.
In the lower subgrade, calculated de ections differ partly due to differences in handling the subgrade as one or two layers. This also leads to a difference in the surface de ections, i.e. the sum of the de ections in the different layers. Dividing the subgrade into more than one layer will usually give a better match to the measured de ections, independent of the material model used.
De ections under the centreline of load calculated with a combination of MODULUS and CHEVRON differ from the measured de ections in all layers. In the upper subgrade layer, there is agreement at a distance of 1200 mm from load centre. See example in Figure 3.
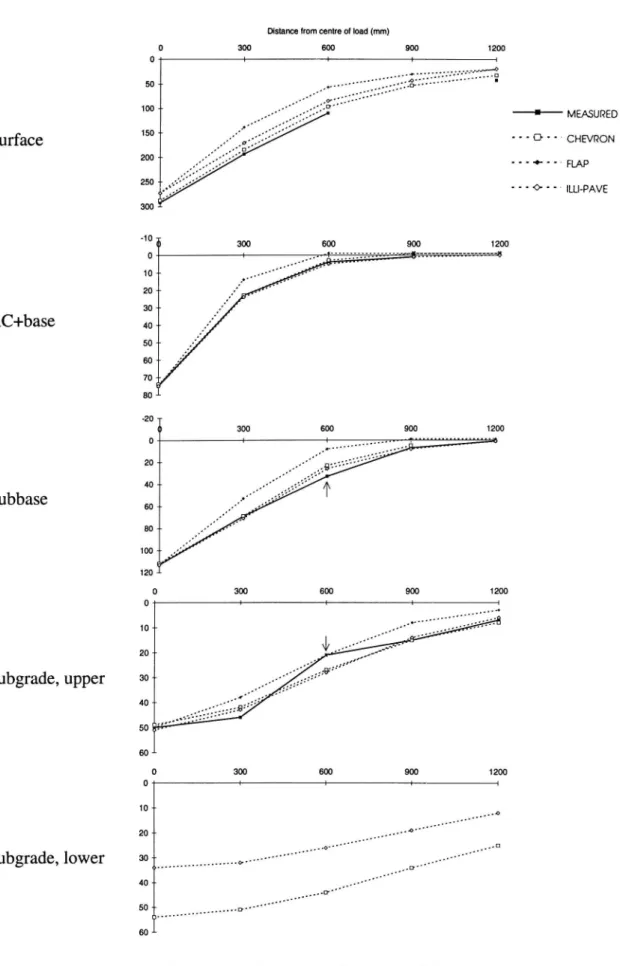
In the spring thaw, good agreement can be found with constant moduli of the layers (CHEVRON and ILLI PAVE calculations), see Figure 4. This implies that the frozen zone, upper subgrade, can be modelled as a linear elastic layer.
COMPARISON BETWEEN CALCULATED VERTICAL STRAINS
In the calculations with CHEVRON, FLAP and ILLI PAVE, the de ections under centreline of load were the same as the measured de ections. When the calculated
vertical strains at the top of the unbound layers are compared, the result can be
summarised as follows:
In the base, the difference in calculated vertical strain is fairly small, less than 15%,
Distance from centre of load (mm) 0 300 600 900 1 200 '_' MEASURED " D"'CHEVRON
Surface
_ _ _ + _ .. FLAP
- - - <> - -- lLLl-PAVE - - - + - -- MODULUSA 'na- MODULUSB AC+base 0 300 600 900 1200 O l .-.l """ 1x11 : su' lnnu ========= I; 50-100 -- . Subbase 150 -~ 2 200 -~ 250 fil 300 --Subgrade, upper 0 300 600 900 1 200 Subgrade, lowerFigure 3. Measured and calculated de ections, in mm, in different layers. FWD
Distance from centre of load (mm) + MEASURED "'D"'CHEVRON Surface . . - + - - ' FLAP . . - (> - -- ILLl-PAVE AC+base Subbase Subgrade, upper Subgrade, lower
Figure 4. Measured and calculated de ections, in um, in different layers. FWD
loading 50 kN, road No. 34, 1985.04.10. Arrows indicate probable
. In the subbase, ILLI-PAVE gives lower strains than the other programs, 15-45%, see Figure 6.
. At the top of the subgrade, the differences between strains calculated with
CHEVRON and ILLI-PAVE are fairly small, less than 10%, while those calculated
with FLAP are higher, 40-70%, see Figure 7.
Note that in the spring thaw, the materials were assumed to be linear elastic also in the ILLI PAVE calculations.
The vertical strains calculated after backcalculation with MODULUS differ con-siderably (as do the de ections under centreline of load and moduli), see Figures 5 7.
1600 l o o I D 1400 G 8 C - FLAP 5 8 8 D lLLlPAVE Cl ' MODULUS A
%
MODULUS B Ve rt ic al st ra in (u m/ m) C D 8 II 400 El0 200 400 000 800 l 000 i 200 1400 i 000
Vertical strain CHEVRON (um/m)
Figure 5. Comparison of calculated vertical strains at the top of the base.
1400 0 l200 O A , l & 1000 ' å <> FLAP E 800 U D ILLIPAVE Ö +3 I E] 6 600 ' MODULUSA O %, D <> MODULUSB > 400 D SERIE] D 200 + 0 1 0 200 400 600 800 1000 1200 1400
Vertical strain CHEVRON (um/m)
%
%
ä'
%
D ' FLAP%
+ ' MODULUS A (> MODULUS B Ve rt ic al st ro ln (p m/ m) I 4415 ' D lLLlPAVE D O O0 100 200 300 400 500 600 700 800 900
Vertical stroln CHEVRON (um/m)
Figure 7. Comparison of calculated vertical strains at the top of the subgrade. VERTICAL STRAIN AS A FUNCTION OF SURFACE DEFLECTIONS
The calculated vertical strains at the top of the unbound layers, when calculated and measured deHections under centreline of load match, may be related to the surface de ections measured with the FWD. To establish the relationships, linear regression analysis was used. Based on the ILLI-PAVE calculations, the vertical strain (eV) can be explained with the following equations (see remarks below):
Base: EV = 1227+3425*DO-1 1799*D300+15680*D 1200 (R2=0.99) Subbase: av = -74+2389*D0+2320*D300 173 14*D 1200 (R2=0.98) Subgrade: SV = -256+925*D0+3533*D600-56 1 3*D 1200 (R2=0.99)
Where ev = vertical strain, in um/m
Dx = de ection x mm from load centre, in mm
The high coefficients of correlation (R?-) depend to a large extent on the small number of
measurements/calculations. In the case of the subgrade strain, measurements in the spring thaw are excluded from the analyses, since there was a frozen zone in the upper subgrade. The stiffness of the asphalt layers and material thicknesses were also used in the regression, but due to the fact that only three pavements were included and the
variations in thicknesses and stiffness are small, the results are not very reasonable. It
may also be noted that no de ection was measured at 900 mm from the load centre. Strains calculated with the above equations must be used with caution and consistency.
10
CONCLUSIONS
Materials used in road pavements are complex. In pavement analyses, simplifications are necessary when the materials' behaviour under load is being described. However, the more appropriate the models used in the calculations, the more appropriate the results will probably be.
A number of computer programs, including different material models, were used to calculate vertical de ections in different layers of the pavement. A match with measured in-depth de ections under the centreline of a FWD load was obtained after repeated forward calculations. Vertical de ections at different distances from the load centre in each layer were compared. Based on the assumed inputs, the best match during spring and autumn conditions, with no frozen zone in the pavement, is achieved with non-linear models (ILLI-PAVE). This fact does not exclude that an even better match could be achieved with other more appropriate material models incorporated to the ILLI-PAVE program. In the spring thaw, when the upper part of the subgrade is still frozen, a
good match is found with linear elastic models (CHEVRON).
Backcalculated moduli with MODULUS were used in CHEVRON calculations. In-' depth de ections under the centreline of load are different from the measured de ections in all layers. In the upper subgrade layer, there is agreement at a distance of
1200 mm from load centre.
Vertical strains at the top of the unbound layers calculated with CHEVRON, FLAP and
ILLI-PAVE were compared, the de ections under centreline of load being the same as
those measured. In the base, the difference is fairly small, less than 15%. In the subbase, lLLI-PAVE gives lower strains than the other programs. At the top of the subgrade, the differences between strains calculated with CHEVRON and ILLI-PAVE are fairly small, less than 10%, while those calculated with FLAP are higher. More important is the difference between these strains and those calculated after backcalculation from
measured surface de ections (MODULUS). This means that when the concern is to
calculate vertical strains in an existing pavement, preferably non-linear models should be used in the backcalculation. However, at this moment no proper method is available. Therefore, algorithms were developed for calculation of vertical compressive strains at the top of the unbound layers from surface de ections measured with the FWD. Strains calculated with these must be used with caution and consistency.
ACKNOWLEDGEMENTS
These measurements were performed in co operation between the Norwegian Road Research Laboratory, the Norwegian Institute of Technology, the Norwegian Asphalt
Industry Laboratory, the Swedish Road Administration and VTI. The Swedish part of
the work at VTI is sponsored by the Swedish Road Administration.
ILLI-PAVE is a pavement analysis program provided by the Transportation Facilities Group, Department of Civil Engineering, University of Illinois at Urban-Champaign.
11
REFERENCES
[1]
[2]
[3]
[4]
[5]
[6]
Noss P M and Mork H, A Norwegian/Swedish in-depth pavement de ection study (1) - Instrumentation and test loading, Third International Conference on Bearing Capacity of Roads and Air elds, Trondheim 1990, pp 817-828.
Jansson H and Wiman L G, A Norwegian/Swedish in-depth pavement de ection study (2) - Seasonal variation and effect of loading type, Third International Conference on Bearing Capacity of Roads and Air elds, Trondheim 1990, pp 829-839.
Mork H, A Norwegian/Swedish in depth pavement de ection study (3)
-Backcalculation of moduli, Third International Conference on Bearing Capacity of Roads and Air elds, Trondheim 1990, pp 841-852.
Mork H, Analyse av lastresponsar for vegkonstruksjonar (in Norwegian), Doktor ingenioravhandling 1990z6, Institutt for veg- og jernbanebyggning NTH,
Trondheim.
Van Cauwelaert F, Lequeux M and Delaunois F, Computer programs for the determination of stresses and displacements in four layered systems with fixed bottom. Centre de Recherches de l'Institut Superieur Industriel Catholique du
Hauinaut, 1986.
Scullion T and Michalak C, MODULUS 4.0, User s Manual. Research Report