COMMUTER TRAIN
WINDOWS DUE TO
EXPLOSION
Window explosion tests within the METRO
project
HAZARD OF BROKEN
COMMUTER TRAIN
WINDOWS DUE TO
EXPLOSION
Window explosion tests within the METRO project
Studies in Sustainable Technology
inbjuder lärare och forskare att publicera resultat från forsknings- och utvecklings-arbeten. Det kan exempelvis handla om teoretiska frågeställningar, genomförda experiment, rapportering från samverkans- eller samproduktionsprojekt eller från externa uppdrag.
Skriftserien omfattar forskningsrap-porter, arbetsrapporter och student-rapporter. Forskningsrapporter är på en högre vetenskaplig nivå och ska därför granskas av behörig forskningsledare eller professor. Arbetsrapporter kan t.ex. utgöras av beskrivningar av delförsök och utredningar som kan ligga till grund för kommande paper eller forskningsrapporter. Studentrapporter kan t.ex. utgöras av examensarbeten med extern uppdragsgivare. Arbets- och studentrapporter ska seminarie-behandlas före publicering.
Manuskript lämnas till redaktören, som ombesörjer slutlig granskning och redigering inför publicering. Varje författare är dock själv ytterst ansvarig för skriftens veten-skapliga kvalitet.
Studies in Sustainable Technology invites
teachers and researchers to publish results from research and development work. It can e.g. be about theoretical topics, carried out experiments, reports from cooperation or coproduction projects or from external assignments.
The publication series includes research, work and student reports. Research reports are at a higher scientific level and should therefore be examined by a research director or professor within the research field of the study. Work reports may e.g. consist of descriptions of pilot studies or studies as a basis for future papers or research reports. Student reports may e.g. consist of master theses for external principals. Work and student reports should undergo a seminar prior to publication.
Report scripts are to be submitted to the editor for a final review and editing before publication. The author, though, is solely responsible for the scientific quality of the report.
S
TUDIES IN
S
USTAINABLE
T
ECHNOLOGY
Research Report: 2012:6
Title: Hazard of broken commuter train windows due to explosion Subtitle: Window explosion tests within the METRO project
Authors: Gero Meyer & Roger Berglund
Keywords: Explosion, windowpane, iso-damage curve, fragments, velocity
Language: English
Photographs: Gero Meyer
ISBN: 978-91-7485-122-9
PDF edition: http://urn.kb.se/resolve?urn=urn:nbn:se:mdh:diva-23855 Copy Editor: Mikael Gustafsson, mikael.gustafsson@mdh.se
Publisher: Mälardalen University
Print: Arkitektkopia AB
Mälardalens högskola
Akademin för ekonomi, samhälle och teknik Box 883
721 23 Västerås www.mdh.se
Mälardalen University
School of Business, Society and Engineering P.O. Box 883
SE-721 23 Västerås Sweden
www.mdh.se © Copyright Mälardalen University and the authors,2014.
Contents
LIST OF FIGURES ... 6 LIST OF TABLES ... 8 ACKNOWLEDGEMENTS ... 9 ABSTRACT ... 11 1 INTRODUCTION ... 122 MATERIAL AND METHOD ... 13
2.1 Limitations ... 13
2.2 Test set-up ... 13
2.3 Components and assembly of the test ... 14
2.4 Tunnel ... 17
2.5 Explosive device ... 17
2.6 Instrumentation and Equipment ... 18
3 RESULTS ... 20
3.1 Protocols of the conducted shots ... 20
3.2 Suggested iso-damage curve for a 5 mm toughened glass windowpane ... 22
3.3 Glass fragment velocities ... 23
3.4 Observation of glass spread ... 25
4 DISCUSSION ... 33
5 CONCLUSIONS ... 35
6 FURTHER RESEARCH ... 36
REFERENCES ... 38
ANNEX A–ANALYSIS OF HIGH SPEED CAMERA FRAMES ... 39
ANNEX B–GRAPHS OF THE MEASURED RESULTS ... 51
List of figures
Figure 1: Vertical cross section of the test set-up ... 14
Figure 2: Window in original aluminium frame... 15
Figure 3: Window with the outside rubber moulding towards the camera and the inside towards the explosion ... 15
Figure 4: Vertical cross section of a commuter train window frame ... 15
Figure 5: Spall catch box with indicated glass spread zones ... 16
Figure 6: Sketch of the Shock Tube IV in Märsta ... 17
Figure 7: Explosive charges ... 18
Figure 8: High speed camera ... 19
Figure 9: Measured peak pressure values for shot 1 to 15 ... 22
Figure 10:Iso-damage-curves from previous tests [5] and the suggested IDC for the 5 mm pane in this test series ... 23
Figure 11:Plane view of the test site [mm] ... 24
Figure 12:Shot 5 time estimation ... 25
Figure 13:Spall catch box with indicated glass spread zones ... 26
Figure 14:Glass spread shot 5 (25 g) ... 27
Figure 15:Glass spread shot 14 (30 g) ... 27
Figure 16:Glass spread shot 6 (40 g) ... 27
Figure 17:Glass spread shot 7 (80 g) ... 27
Figure 18:Shot 5 – Frames of the high speed camera ... 28
Figure 19:Shot 5 – Route of splinters ... 29
Figure 20:Shot 15 – Location of fragments in the wall ... 30
Figure 21:Shot 15 – Weight and shape of some fragments ... 30
Figure 22:Third-mode shape of glass spall of shot 5 ... 31
Figure 23:Third-mode shape of glass spall of shot 15 ... 32
Figure 24:Shot 5 – Frames from the high speed camera ... 40
Figure 25:Shot 5 – Route of splinters ... 40
Figure 26:Shot 5 – Time estimation ... 41
Figure 27:Shot 6 – Frames from the high speed camera ... 42
Figure 28:Shot 6 – Route of splinters ... 43
Figure 29:Shot 6 – Time estimation ... 43
Figure 30:Shot 7 – Frames from the high speed camera ... 44
Figure 31:Shot 7 – Route of splinters ... 45
Figure 33:Shot 14 – Frames from the high speed camera ... 46
Figure 34:Shot 14 – Route of splinters ... 46
Figure 35:Shot 14 – Time estimation ... 47
Figure 36:Shot 15 – Frames from the high speed camera ... 48
Figure 37:Shot 15 – Route of splinters ... 48
Figure 38:Shot 15 – Time estimation (middle) ... 49
Figure 39:Shot 15 – Time estimation (lower end) ... 49
Figure 40:Calibration shot A (1 g, 20 m) ... 52
Figure 41:Calibration shot B (1 g, 40 m) ... 52
Figure 42:Calibration shot C (1 g, 20 m) ... 53
Figure 43:Shot 1 (5 g, 20 m) ... 53 Figure 44:Shot 2 (5 g, 20 m) ... 54 Figure 45:Shot 3 (15 g, 40 m) ... 54 Figure 46:Shot 4 (20 g, 40 m) ... 55 Figure 47:Shot 5 (25 g, 40 m) ... 55 Figure 48:Shot 6 (40 g, 40 m) ... 56 Figure 49:Shot 7 (80 g, 40 m) ... 56 Figure 50:Shot 8 (10 g, 40 m) ... 57 Figure 51:Shot 9 (15 g, 40 m) ... 57 Figure 52:Shot 10 (20 g, 40 m) ... 58 Figure 53:Shot 11 (20 g, 40 m) ... 58 Figure 54:Shot 12 (25 g, 40 m) ... 59 Figure 55:Shot 13 (1 g, 40 m) ... 59 Figure 56:Shot 14 (30 g, 40 m) ... 60 Figure 57:Shot 15 (80 g, 40 m) ... 60
Figure 58:Fragments of shot 6 ... 62
Figure 59:Locations of impact of shot 7 ... 63
Figure 60:Fragments of shot 7 ... 64
Figure 61:Fragments of shot 14 ... 65
Figure 62:Further fragment of shot 14 ... 66
Figure 63:Locations of impact of shot 15 ... 67
Figure 64:Fragments of shot 15 ... 68
Figure 65:Further fragments of shot 15 ... 69
List of tables
Table 1: Sensor characteristics and recorder settings ... 18
Table 2: Measured values of window tests ... 20
Table 3: Measured values of window tests (cont.) ... 21
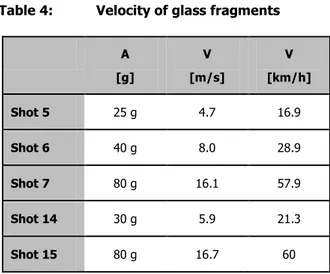
Table 4: Velocity of glass fragments ... 25
Acknowledgements
Tests like these always need an extra helping hand to get it put in place. Tobias Carlberg was this extra pair of hands that took care of maneuvering the several tons heavy tunnel parts and crawling into the tunnel to install the explosive devices. Thanks a lot for your effort in the performance of the tests.
Further, the authors want to thank for the excellent literary support from Lena Johansson Westholm, Bo Janzon and Rickard Forsén who spent a lot of time reading through the writings, giving comments and leaving valuable suggestions. Thank you very much!
Abstract
This report compiles the results of window explosion tests carried out by the Swedish Defence Research Agency (FOI) and Mälardalens Högskola (MDH) in shock tube IV in Märsta, Sweden. These tests were performed as part of the METRO project. 15 shots were made with varying distances between window and charge and varying charge weights. The windows used were taken from a decommissioned commuter train. This report describes the components and assembly of the tests and presents the results in detail. It further questions the previous method of defining danger zones, suggests a new approach and gives ideas to improve further similar tests.
1
Introduction
These window explosion tests were conducted as part of the METRO project, which seeks to improve the safety and security of underground mass transport systems in case of fire and explosions due to an accident or a deliberate attack. The overall aim of the METRO project is to improve the tactics of first responders and investigate the impact of different fire and explosion scenarios on materials and building structures in a rescue operation and evacuation point of view. The behaviour of materials and building structure due to an explosion is strongly linked to the safety of passengers and employees and certainly demands special investigation.
The objective of the commuter train window explosion tests is to gain some knowledge about the glass fragments hazardousness for passengers, focusing on the 5 mm toughened glass pane commonly used in the train type X1. This report describes the test settings, results and observations of the 15 shots that were carried out in the shock tube IV in Märsta, Sweden.
2
Material and Method
In total five windows were examined. Variations were made concerning the distance between the charge and the window and concerning the charge size. Three of the windows were tested with the pressure propagating from outside to inside and two further ones were tested in opposite direction. The pressure waves were directed orthogonally to the surface of the window, originating from the charges at 20 or 40 m distance. The gauges were placed centered above and below the windowpane and hence measured the reflected pressure.
Three test shots with 1 g explosive (A, B and C) were accomplished to verify the systems functionallity. The aims of window-I and -IV were to find out the point of breaking by slow increase of the explosive charge. Window-II, -III and -V were broken by a larger charge in order to collect information concerning the glass spread and the velocity as well as the shape of the fragments. Window-IV and -V were installed with the inside towards the explosive. This was performed to see whether the direction of the fixation in the frame would have any importance.
The tests were conducted in Shock Tube IV in Märsta (Sweden). Responsibility lay with FOI.
2.1
Limitations
The pressure wave was directed orthogonally to the surface of the window glass. A side-on pressure was not taken in consideration. The windows used were taken from an discarded commuter train, and some scratches or graffiti could be found on the surface of the glass, which certainly could have an impact on the test results.
A shock tube is designed to simulate open blasts with long duration but it is not creating the negative phase that typically occurs at explosions in open space. The negative phase of an explosion might have an impact on the performance of a glass panel. In these tests only the positive phase was consicered.
There were no calibration shots performed for this tests, which limits the comparability to previous performed tests at shock tube IV or other facilities.
2.2
Test set-up
The test set up followed similar instructions of earlier performed window explosion tests that were carried out in Shock Tube IV with different kind of windowpanes [1]. Five faultless
X1, were collected after the full-scale commuter train explosion test in Arvika, Sweden. The windows were of toughened glass and some of them showed minor scraches or graffiti paintings caused by earlier vandalism. More detailed information about the train type, which is still used by Storstockholm Public Transport (SL), can be found in the full-scale test report [2]. The windows in their frames were fixed to a steel frame, which was placed centered in the shock tube. One gauge above (Gover) and one below (Gunder) the window collected data of the reflected pressure. The gauges were installed in 100 mm distance to the upper and respectively lower edge of the windowpane. The glass spall was caught in an adjacent box. The high speed video camera was placed orthogonal to the centerline of the tube in 9 m distance to the center of the glass spall catch box.
Figure 1: Vertical cross section of the test set-up
2.3
Components and assembly of the test
The windows had the dimensions of 84 x 100 cm and were fixed at the test site in a steel frame that was manufactured as similar as possible to a window section of the original commuter train.
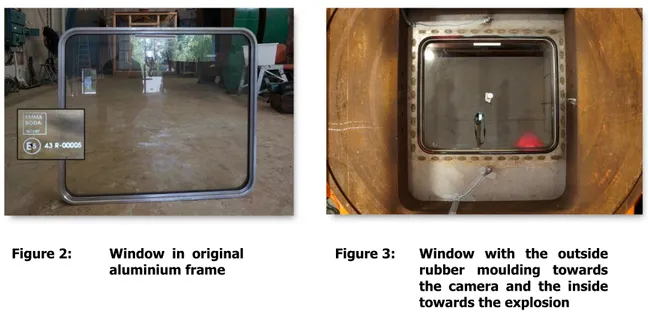
Figure 2: Window in original
aluminium frame Figure 3: Window with the outside rubber moulding towards the camera and the inside towards the explosion
The window frames were original parts from the commuter train, consisting of a rubber moulding that kept the window level with the outside, surrounded by an aluminium frame, and four aluminium profiles along the inside of the carriage wall that were fixed to the frame with screws to keep the window in place.
Figure 4: Vertical cross section of a commuter train window frame
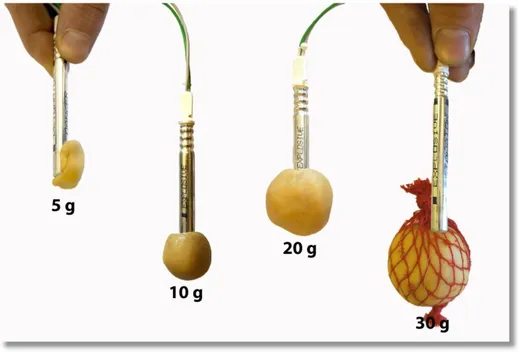
The explosive device was placed at 20 or 40 m distance to the windowpane and was suspended on a wire at the center of the tube. The 5 g charge contained of 4 g explosive that was stuck to one side of the 1 g detonator, the other larger charges were placed spherically surrounding the detonator. Charges heavier than 25 g were suspended in a thin plastic net to preserve the positioning of the detonator. For detailed information about the explosive
The gauges were placed centered above and below the window so that only reflected pressure was measured. A white cotton ball was fixed at the middle of the windowpane to get aware of the oscillation during the tests when the window would not break and used to estimate the velocity of the fragments after breaking. The high speed camera was placed 9 m orthogonally to the tunnel length axis in front of the box.
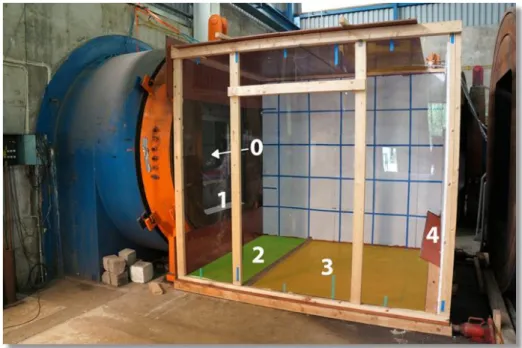
A similar box as used in earlier tests [1] of 3 m length, 2,3 m width and 2,5 m height was placed in front of the tube to catch the glass spall. The sidewall towards the camera was closed up with Plexiglas®
and the opposite side showed a white wall with a grid of blue lines. The side length of each square was 0,5 m. The grid made it possible to calculate the velocity of the fragments.
The top of the box was covered with partly loose arranged wooden boards, which kept the majority of the glass spall inside the box but gave the pressure the possibility to dissapate into the open hall.
The wall that was facing the pressure wave frontally was covered with styrofoam to limit the rebounds of the glass spall. At the same wall, at half a meter´s height, a board was installed to collect the glass spall that would drop off the wall. A list was mounted at 1 m distance to the test window on the floor. This was done to indicate different zones for the documentation of the glass spread.
Figure 5: Spall catch box with indicated glass spread zones
In total five zones were created. The area inside the tunnel was defined as zone 0. Zone 1 included the window ledge and the parts that remained in the window frame. The green area indicates zone 2 and yellow zone 3. Zone 4 is indicated by the red color and includes the pieces that got stuck in the Styrofoam. Pieces bigger than 2 g that remained in the styrofoam were located and weighed (see Annex C).
2.4
Tunnel
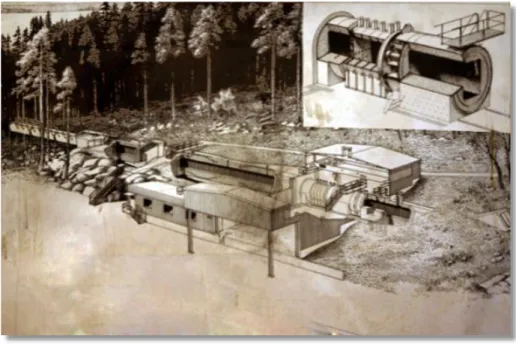
The Shock Tube IV at Märsta is a 90 m long tube with rectangular cross-section of 120 x 160 cm. It is made of steel, and enables the detonation of charges at a maximum distance of approximately 50 m from the test object. It is strong enough to withstand a detonation of 10 kg Trinitrotoluol (TNT) equivalent. The facility is owned by the Swedish Fortification Agency (FortV) and used by FOI.
A calibration report for shock tube IV was written in the year 1973 [3] where 50 g TNT was used as minimal amount of explosive.
Figure 6: Sketch of the Shock Tube IV in Märsta
2.5
Explosive device
The explosive charge was made of standard Swedish military plastic explosive (sprängdeg m/46), which is composed of 85 % Penterithrytoltetranitrate (PETN) and 15 % mineral oil. The detonator was a VA Gr2 blasting cap, which is compatible with the fixed installed electrical system in Märsta.
Figure 7: Explosive charges
2.6
Instrumentation and Equipment
The transmitting cables were coaxial. These consist of a solid copper wire in the middle, which is surrounded by plastic insulation and a woven net of steel for protection against other electromagnetic influences. The signals were recorded by a Nicolet Vision high speed transient data acquisition system. It sampled the data at 100 kHz with a resolution of 16 bits, maximum in 16 channels. Two gauges were installed, one above the window (Gover) and one beneath the window (Gunder). The gauges were manufactured by PCB Piezotronics, Inc.
Table 1: Sensor characteristics and recorder settings Manufacturer Model Serial
number Span ± V Gauge sensitivity kPa/V Gover PCB 103B27 20024 0.5 133.8 Gunder PCB 102A18 26356 1.0 68.4
A Photron APX high speed video camera (running at 1 000 frames per second) was placed at about 9 m distance to the model and was triggered manually.
3
Results
3.1
Protocols of the conducted shots
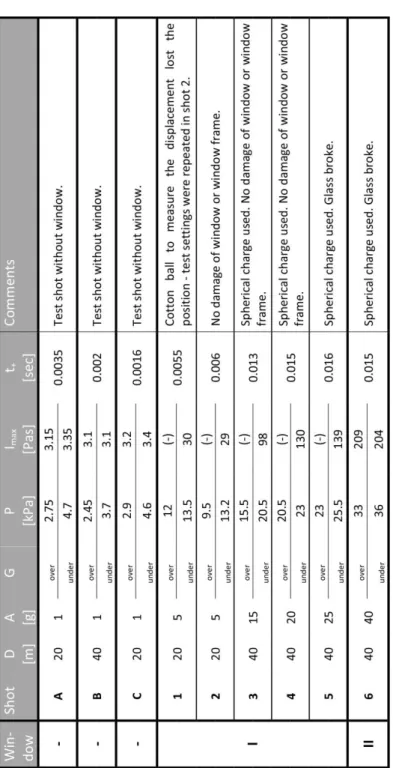
The windows of the tests window-I, -II and -III were installed with the outside towards the explosive device. The windows in the window-IV and -V tests were directed with the inside towards the explosive device.
Table 3: Measured values of window tests (cont.)
Table 2 and 3 are presenting the settings of the conducted shots and the corresponding measured results of the peak pressure (P), the maximum impulse density (Imax) and the time of positive duration (t+).
The signals from gauge Gover during shot 1 to 5 and shot 7 show unexpected and strange behavior and need to be considered as not reliable. Therefor they were excluded from Table 2 and Table 3.
Figure 9: Measured peak pressure values for shot 1 to 15
The graph (Figure 9) shows the maximuim peak pressure value from Gunder or Gover of shot 1 to 15 and an equation to the trendline. These values give an idea of what peak pressure is to be expected when using a certain amount of explosive. Shot 1 and 2, presented with a white square dot, are performed with only 20 m distance to the window. All other shots were made with a distance of 40 m to the windowpane. Square dots (black and white) indicate a non-broken window while the red round dots indicate a non-broken one. The amount of explosive can be found in Table 2 and Table 3.
The peak pressure measurements of window-I (shot 3, 4 and 5) are corresponding well to the peak pressure measurements of window-IV (shot 9, 10/11 and 12). Shot 3 can be compared with shot 9, shot 4 with shot 10 and 11, and shot 5 with shot 12. These pairs had the same amount of explosive and the same distance to the charge, but window-I was mounted with the outside and window-IV with the inside towards the charge. The comparison of the corresponding values shows no significant difference so it can be assumed that the direction of the fixture has no significant influence on the results.
But window-I failed at a charge size of 25 g with a peak pressure of Punder = 25.5 kPa and a maximum impulse density of Imax = 139 Pas (see Table 2, shot 5). Window-IV failed at a greater load of 30 g with an average peak pressure of Punder = 28.5 kPa and a maximum impulse density of Imax = 156 Pas (see Table 3, shot 14). Window-IV was able to take a load with about 10 % higher pressure before failing than window-I.
3.2
Suggested iso-damage curve for a 5 mm toughened glass
windowpane
The iso-damage curve (IDC), or pressure-impulse curve, emphazises the combination of pressure and impulse density to define the threshold of damage. [4]
Figure 10 presents IDC for a 4 mm and a 6 mm single glass pane from previous tests [5] and the suggested IDC for the 5 mm windowpane from these tests. The dots are indicating the measured peak pressure and the evaluated impulse density values of the shots 1 to 15. Black square dots resulted in not broken windows and red round dots in broken ones. The suggested IDC, the blue graph, was simply roughly handdrawn with reference to the neighbour graphs and coincides well with the border between not broken and broken windows of the tests.
Figure 10: Iso-damage-curves from previous tests [5] and the suggested IDC for the 5 mm pane in this test series
3.3
Glass fragment velocities
The velocity of the glass splinters was estimated with help of a grid on the wall opposite to a fix installed high speed video camera (see Figure 11). The high speed video camera is showing the glass spall passing the gridlines and is giving the time needed for the spall travelling the defined distance.
Some limitations of this method should be kept in mind. The view from above (plane view) of the test area is not recorded, so the spreading in the horizontal plane cannot be detected. Hence the real travelled distance of the glass splinters could only be assumed. To ensure that the same fragment was traced and to limit the probability of tracing a diagonal flying glass splinter a cotton ball was fixed centered to the windowpane facing the spall catch box, which was traced instead of the glass spall. The centered positioning of the cotton ball most likely insured a flight route along the centerline of the glass spall catch box but it might have had the effect of slowing down the glass splinter. The evaluated velocity gives therefor only a rough impression.
Figure 11: Plane view of the test site [mm]
The velocity of fragments in shot 5 was estimated as following. The cotton ball was travelling 0.45 m in 0.096 s, which results in 4.7 m/s or 16.9 km/h.
Figure 12: Shot 5 time estimation
Similar evaluation of the high speed films of shot 6, 7, 14 and 15 can be found in Annex A. The velocity of the glass spall can be taken from the following table.
Table 4: Velocity of glass fragments A [g] V [m/s] V [km/h] Shot 5 25 g 4.7 16.9 Shot 6 40 g 8.0 28.9 Shot 7 80 g 16.1 57.9 Shot 14 30 g 5.9 21.3 Shot 15 80 g 16.7 60
A = Amount of explosive device; V = velocity
3.4
Observation of glass spread
The spread of the glass spall depends on different parameters like the type of glass, the size of the charge, the shape of the room, obstacles within the travel route and the character of the boundary surfaces.
Except the charge weight, all parameters were kept similar during the test series. With the changing size of the charge, the velocity of the spall changed, which led to a significantly different picture of glass spread. To be able to categorize the glass spread the room, which caught the glass spall, was divided into 4 different zones. Those zones are described in chapter 2.3. The glass spall of the 5 broken windows (shot 5, 6, 7, 14 and 15) were weighed
Figure 13: Spall catch box with indicated glass spread zones Table 5: Weights of glass spall within the zones
A [g] Zone 0 [g] Zone 1 [g] Zone 2 [g] Zone 3 [g] Zone 4 [g] Total [g] Shot 5 25 g 640 135 618 7 754 973 10 120 Shot 6 40 g 219 92 1 465 6 574 1 076 9 426 Shot 7 80 g 1 039 590 3 869 4 337 115 9 950 Shot 14 30 g 499 298 666 6 655 1 570 9 688 Shot 15 80 g 789 388 3 099 5 411 360 10 047
The final glass spread of the different charge sizes is presented in Figure 14 to Figure 17. The red arrows indicate the direction of the initial pressure wave propagation.
Figure 14: Glass spread shot 5 (25 g) Figure 15: Glass spread shot 14 (30 g)
Figure 16: Glass spread shot 6 (40 g) Figure 17: Glass spread shot 7 (80 g)
The glass distributions of shot 5 (25 g) and 14 (30 g) do not differ much from each other, as can be seen in Figure 14 and Figure 15. This was to be expected, since the charge weights are rather similar. The glass was pushed 3 m across the room but did not have sufficient energy
weight of the glass fragments can therefore be found in zones 3 and 4 in shot 5 with a total weight of 8 727 g and in shot 14 with a total weight of 8 225 g. The windowpane unbroken weight was about 10,2 kg.
A charge weight of 40 g, as it got used in shot 6, however made a significant difference in the distribution of the spall. Figure 16 shows a rather equal distributed glass spread. The glass splinters reached the opposite wall a little higher and rebounded therefore a little further. But still with 7 650 g, most of the spall ends within zones 3 and 4.
After shooting 80 g of explosive, the glass spall was found rather equally distributed, with a slight concentration in zone 2. The glass spall had enough energy to return to zone 2 after rebounding from the opposite wall.
The following pictures show frames of the breaking window captured by the high speed camera during shot 5. Similar edits of shot 6, 7, 14 and 15 can be found in Annex A. These pictures should give an understanding of the relation between the charge weight and the flight route of the glass spall.
Figure 19 describes the route of the splinters. For this purpose five frames from the high speed video, which are shown in Figure 18, were placed on top of each other.
Figure 19: Shot 5 – Route of splinters
Although a tempered glass was used, some fragments remained together in bigger pieces. Shot 14 (30 g explosive) displayed glass pieces of up to 65 g. During shot 6 (40 g explosive) glass fragments of up to 19 g were found. Fragments of shot 7 and 15 (80 g explosive) travelled at a significantly higher velocity. Therefore some fragments got stuck in the styrofoam panels on the opposite side to the window. The locations of impact are shown in Figure 20. The shape of the two largest fragments found in shot 15 can be seen in Figure 21. These fragment had a weight of 26 g and 18 g. While removing them from the styrofoam, they broke into small pieces. All recovered fragments are listed in Annex C.
Figure 20: Shot 15 – Location of fragments in the wall
A further interesting observation was made. Although the windowpane was nearly square (84 cm x 100 cm) and fixed at the center of the tunnel cross-section, it seemed that the upper and the lower ends of the window were breaking up earlier than the middle of the windowpane. The glass spall from the left and the right end of the windowpane seem to start up travelling at the same time as the middle part. This results in a rather clear third-mode shape of the glass spall front in the vertical view from the side as presented in Figure 22 and Figure 23.
However, the glass spall from the middle part of the windowpane reaches the same velocity as the pieces from the upper and lower end.
4
Discussion
Measuring explosions is a difficult undertaking since the duration time of an explosion is excessively short. The peak pressure, for instance, is extraordinary steap and exists only for an infinitesimal short time. The commonly used measure equipment is memorising values in a certain time step and most likely misses the absolute peak value. But nevertheless the captured values are giving a good impression about the peak pressure.
Window-I and -IV were loaded with slowly increasing amounts of explosive to investigate the point of breaking. The difference between these test series was the direction in which the windows were installed. Window-I faced the explosive device with the outside of the carriage frame and window-IV with the inside. It was to be tested whether the direction of the fixation has any impact on the resistance of the windowpane. Window-I managed a load of 20 g explosive and failed as loaded with a charge size of 25 g. Window-IV managed a load of 25 g and failed as loaded with the pressure of a 30 g device. The step of 5 g between the previous and the following load size is rather large. Window-I might have been able to withstand 24 g and window-IV might have been broken with 26 g. In that case there would not have been a big difference in the mounting directions, but if window-I would have been broken with a load size of 21 g and window-IV would have withstand 29 g, the difference would be large. Whether the direction of the fixation had an impact on the outcome is difficult to state with only one comparison and a difference of 5 g to the next load size. The impulse density at time of breaking was not able to get measured, since the time of the explosion was not accurately defined.
But since in both cases the fixation of the windows were still intact, it is more likely that the different values in peak pressure and impulse density were caused by inhomogeneity of the windowpane, caused by production or surface damage by vandalism. Some windowpanes exhibited scratches on the surface, which could have had an impact on the results.
The values of the gauge above the window (Gover) in shot 1 to 5 and 7 show deviations and should not be considered accurate. After around 5–10 ms in shot 1 to 5, Gover started to capture slightly increased values of pressure, which shows most obvious in the impulse density graphs. It might be reasoned in a problem with the fixture of the window or the gauge. After installing window-II these deviations do not show any longer. But window-III (shot 7) shows again some irregularities in form of unusually high deflection of the pressure graph that most likely was caused by an electrical disturbance in the connection of the cable to the gauge.
For shot 8 to 15, both gauges were reinstalled and showed from there on good performance so that the poor performance of Gover was most likely due to a problem with the fixture of the gauge.
It was observed that the gauge that was installed under the windowpane (Gunder) was recording consistently greater values than Gover. The differences are very small but might worth a discussion anyway. Both gauges were installed centrically at same distance to the windowpane and the same distance to the charge. There were no obstacles disturbing the proceeding of the pressure wave that could have caused the different measurements. Since the point of explosion was 40 m away, heat should not have had any impact on the measurements either. But the gauges were not protected or covered with grease. A flaw in the cables, the sensor or its amplifier, might be possible reasons for the slightly different values. The calibration of systems with gauges for dynamic pressure is very difficult. Basically it is only able to rely on the calibration of the single components of the system.
The upper and the lower edge of the windowpane were mostly breaking earlier than the middle part. Viewed from the side, it appears as a glass spall front, which reminds of the third mode of vibration.
The use of cotton balls as indicators of the velocity of the glass spall showed advantages and disadvantages. The cotton ball presents only the velocity of a certain fragment and this fragment might not be the one with the greatest velocity. It must be even considered that the cotton ball might slow down the measured fragment. But a great advantage was the possibility to observe defined areas within the windowpane and the ball was easy to identify from frame to frame in the high speed video.
The validity of the glass-spread zones within the box is rather limited. The settlement of the fragments utterly depends on the velocity of the fragments and the boundary conditions. But after a rebound the fragments will be reduced in velocity and hazard to passengers. So it is of more interest to see which way the fragments take initially after the explosion. During this first travel the fragments will have their greatest injurious capacity.
Also discussed should be the usage of toughened glass versus laminated glass. There are basically two theories how to keep the injury level as little as possible. The first one is to install toughened glass that bursts into thousands of small pieces to reduce the impact force of the glass spall. The second theory is to keep the glass in one piece by installing laminated glass panes to limit the number of fragments. Although toughened glass is supposed to break up into very small pieces without sharp edges, the tests showed that many larger pieces of fragmented glass remained together and formed dangerous splinters as can be seen in Annex C. Furthermore, the glass spall gets accelerated to high velocities and spreads widely over the passenger area. At high velocities even small pieces of glass can cause great injuries. Because of the enlarged spread zone of toughened glass during an explosion more passengers will be affected.
A simple measure to counteract the number of the fragments would be to use a laminated glass pane with a thin adhesive layer of tough plastic on the inside. In a case of an attack, that would lead into a broken window that remains in one piece. But it should be taken in consideration that the whole windowpane might get thrown out of the frame and causes locally tremendous injuries to the passengers. However, there are measures to keep a laminated windowpane from being thrown out in its entirety. And limiting the amount of fragments within the passenger cabins increases the safety tremendously.
5
Conclusions
These window explosion tests showed that not all tempered window glass breaks into small pieces. Within the shattered glass, pieces of up to 65 g were found and pieces of up to 26 g were stuck in the styrofoam wall opposite the window. Such fragments could cause serious injury to persons being hit, even if their velocity is relatively low.
The peak pressure (P) and the positive duration time (t+) are behaving rather linearly versus the amount of explosive.
The glass spall get accelerated by a 25 g charge in 40 m distance to 4.7 m/s. With an explosive device of 80 g in 40 m distance the velocity of the glass fragments reaches up to 16.7 m/s. This is accompanied by a significant difference in the initial flight route of the glass fragments.
The different charge loads created a significant difference in the final distribution of the glass fragments over the floor. The location of settlement of the debris depends on the charge weight and the characteristics of the boundaries like the wall, roof, floor and any other obstacle whithin the area of settlement.
The upper and the lower part of the windowpane seem to be accelerated earlier than the middle. This is shown by the third-mode shaped glass spall front.
6
Further research
This chapter will give ideas for further research or improvements for comparable tests. This report takes only the reflected pressure in consideration although the side-on pressure certainly has a great influence on the durability of a window. Especially in a tunnel, were the pressure wave propagates along the tunnel walls and along the adjacent carriages of a commuter train, the side-on pressure might even turn into the major force that the window has to withstand. Over-pressure (pressure) as well as under-pressure (suction) in relation to the space available between carriage wall and tunnel wall are interesting topics to look into.
Furthermore, hazard zones for passengers of commuter or underground trains at various types of blast loading on windows should be estimated. More interesting than the final settlement might be the initial flight route of the fragments. This is the part of their path where the fragments have the greatest energy and constitute the greatest hazard.
An investigation on the different behavior of toughened glass and laminated glass in case of an explosion would certainly be of interest. A significant change of the hazard zones is to be expected.
The third-mode shaped glass spall front that was observed during the tests, also requires a further investigation. One camera filming from above and one from the front could give great information about the process of breaking up. When and where does the glass break first? Why does the splinter front remind of the third mode of vibration?
To detect the resistance of windowpanes it would be great to define the peak pressure and the impulse density at time of breaking (Patob and Iatob). The combinations of peak pressure and impulse density that causes the windowpane to fail are described in the iso-damage curve. The values Patob and Iatob are therefore relevant to create more accurate iso damage curves.
The Iatob could be determined if the high speed camera would get a trigger signal to start recording exactly at time of ignition. By defining the time delay from the start of the explosion to the actual breaking of the window from the high speed video, the Iatob can get determined with the help of the impulse density graph.
These tests reveal only one point of breaking at a certain combination of peak pressure and impulse density, so that an iso-damage curve cannot be developed. It is common to use an iso-damage curve to visualize the resistance of windowpanes to pressure. For defining an iso-damage curve more than one point of breaking resulting from different peak pressure and impulse density values have to be determined.
Recommendations for improvements in further tests:
Smaller steps of charge sizes in the critical zone from unbroken to broken windows.
Synchronize the high speed camera (trigger start) with the pressure recording to be able to detect the impulse density at time of breaking.
Find different combinations of peak pressure and impulse density that breaks the window to be able to create an iso-damage curve (increasing the pressure and decreasing the impulse density and vice versa).
Install a camera that shows the pane view.
Use a camera with a better resolution or focus on a smaller area of interest to increase the resolution to be able to follow chosen fragments.
References
[1] Lööf, A. (2008). Compilation and evaluation of tests done on windows in a tunnel. Technical Report FOI-R--2638--SE.
[2] Meyer, G., Berglund, R., Lönnermark, A. & Kumm, M. (2002). Full-scale Commuter Train Explosion
Test. SiST Research Report 2012:1. Västerås: Mälardalen University.
[3] Anom (1973). TUBE IV Reflektionstryck.
[4] Baker, W.E., Cox, P.A., Westine, P.S., Kulesz, J.J.& R. Strehlow, A. (1983). Explosion Hazards and
Evaluation, vol. 5: Elsevier Scientific Publishing Company Inc.
Annex A – Analysis of high speed camera frames
The Annex A contains frames from the high speed camera taken during the commuter train window explosion tests carried out by FOI. Those pictures give a good idea about the propagation of the glass spall and describe the calculation of the fragment velocity. The fragment velocity is in fact the velocity of the cotton ball that was fixed to the center of the windowpane. The cotton ball might have changed the velocity over time.
Shot 5:
Figure 24: Shot 5 – Frames from the high speed camera
Figure 25: Shot 5 – Route of splinters
Figure 25 describes the route of the splinters. For this purpose five movie shots from above (Figure 24) were placed on top of each other.
Velocity of cotton ball in shot 5:
0.45 m in 0,096 s => 0.45 m/0.096 s =4.7 m/s => 16.9 km/h
Figure 26: Shot 5 – Time estimation
Shot 6:
Figure 28: Shot 6 – Route of splinters
Figure 28 describes the route of the splinters. For this purpose six movie shots from above (Figure 27) were placed on top of each other.
Velocity of cotton ball in shot 6:
0.45 m in 0.056 s => 0.45 m/0.056 s =8.0 m/s => 28.9 km/h
Figure 29: Shot 6 – Time estimation
Shot 7:
Figure 31: Shot 7 – Route of splinters
Figure 32 describes the route of the splinters. For this purpose six movie shots from above (Figure 31) were placed on top of each other.
Velocity of cotton ball in shot 7:
0.45 m in 0.028 s => 0.45 m/0.028 s =16.1 m/s => 57.9 km/h
Figure 32: Shot 7 – Time estimation
Shot 14:
Figure 33: Shot 14 – Frames from the high speed camera
Figure 34: Shot 14 – Route of splinters
Figure 34 describes the route of the splinters. For this purpose five movie shots from above (Figure 33) were placed on top of each other.
Velocity of cotton ball in shot 14:
0.45 m in 0.076 s => 0.45 m/0.076 s =5.9 m/s => 21.3 km/h
Figure 35: Shot 14 – Time estimation
Shot 15:
Figure 36: Shot 15 – Frames from the high speed camera
Figure 37: Shot 15 – Route of splinters
Figure 37 describes the route of the splinters. For this purpose five movie shots from above (Figure 36) were placed on top of each other.
Velocity of cotton ball in shot 15 (middle):
0.45 m in 0.027 s => 0.45 m/0.027 s =16.7 m/s => 60 km/h
Figure 38: Shot 15 – Time estimation (middle)
One meter behind the window the cotton ball had a velocity of 16.7 m/s.
Velocity of cotton ball in shot 15 (lower end):
0.45 m in 0.027 s => 0.45 m/0.027 s =16.7 m/s => 60 km/h
Figure 39: Shot 15 – Time estimation (lower end)
Annex B – Graphs of the measured results
The following pages contain pressure and impulse density graphs from the commuter train window explosion test. Each graph is presenting the measurements from the gauge installed above the windowpane (Pover and Iover) in red and the one installed underneath the windowpane (Punder and Iunder) in blue.
Figure 40: Calibration shot A (1 g, 20 m)
Figure 42: Calibration shot C (1 g, 20 m)
Figure 44: Shot 2 (5 g, 20 m)
Figure 46: Shot 4 (20 g, 40 m)
Figure 48: Shot 6 (40 g, 40 m)
Figure 50: Shot 8 (10 g, 40 m)
Figure 52: Shot 10 (20 g, 40 m)
Figure 54: Shot 12 (25 g, 40 m)
Figure 56: Shot 14 (30 g, 40 m)
Annex C – Fragment weights and location
Annex C contains photos of glass spall found after test shot 6, 7, 14 and 15. In shot 7 and 15 some of the glass fragments got stuck in the styrofoam wall opposite the tested windowpane. Photos are showing the locations of impact.
The largest piece of coherent glass weighed 65 g and was found after shot 14. Only pieces of 2 g and larger were listed. Yet Figure 58 shows an example of a 1 g and a less than 1 g fragment.
Shot 6:
Shot 7:
Shot 14:
Shot 15:
This report compiles the results of window explosion tests carried out as part of the METRO project by the Swedish Defence Research Agency (FOI) and Mälardalens Hög-skola (MDH) in Shock Tube IV in Märsta, Sweden.
15 shots were made with varying distances between window and charge and varying charge weights. The report describes the components and assembly of the tests and the results are presented in detail. It further questions the previous method of defining danger zones, suggesting a new approach and gives ideas to improve further similar tests.
The METRO project is a three year research project, financed by the Stock-holm Public Transport, the Swedish Fortifications Agency, the Swedish Civil Contingencies Agency, the Swedish Transport Administration, the Swedish Research Council Formas and the Swedish Fire Research Board.
The project is unique as nine Swedish organizations work multidiscipli-nary with the same aim – to make metro systems safer. The organizations are; Mälardalen University, SP the Technical Research Institute of Sweden, Lund University, FOI the Swedish Defense Research Agency, the Swedish For-tifications Agency, the Swedish National Defense College, Gävle University, the Stockholm Public Transport and the Greater Stockholm Fire Brigade.
A study from MERO
This study is published within the MERO research area (Mälardalen Energy and Resource Optimization) at Mälardalen University. The research within MERO is directed towards various aspects of a sustainable society, with particular focus on the optimization and protection of community resources and infrastructure. The research groups within the area are mainly specialized in energy efficiency, resource conservation, design of sys-tems and processes, remediation of contaminated land and fire safety in underground facilities. A common denominator is all aspects of optimization and risk management, where modeling, simulation, validation and applied mathematics are important tools. Responsible research leader is Professor Erik Dahlquist.
http://www.mdh.se/forskning/inriktningar/mero


![Figure 10 presents IDC for a 4 mm and a 6 mm single glass pane from previous tests [5]](https://thumb-eu.123doks.com/thumbv2/5dokorg/4827135.130141/23.892.189.703.304.668/figure-presents-idc-single-glass-pane-previous-tests.webp)