School of Innovation Design and Engineering
Västerås, Sweden
DVA331
Thesis for the Degree of Bachelor in Computer Science
CLIENT-SIDE EVALUATION OF
QUALITY OF SERVICE IN CLOUD
APPLICATIONS
Jonathan Larsson
jln14010@student.mdh.se +46720477555
IDT supervisor: Alessandro Papadopoulos
Company supervisor: Emil Sundberg
Examiner: Saad Mubeen
Abstract
Cloud computing is a constantly developing topic that reaches most of the people in the world on a daily basis. Almost every website and mobile application is hosted through a cloud provider. Two of the most important metrics for customers is performance and availability. Current tools that mea-sure availability are using the Internet Control Message Protocol (ICMP) to monitor availability, which has shown to be unreliable. This thesis suggests a new way of monitoring both availability and response time by using Hypertext Transfer Protocol (HTTP). Through HTTP, we are able to reach both the front-end of the cloud service (just as ICMP), but also deeper, to find failures in the back-end, that ICMP would miss. With our monitoring tool, we have monitored five different cloud data centers during one week. We found that cloud providers are not always keeping their promised SLA and it might be up to the cloud customers to reach a higher availability. We also perform load tests to analyze how vertical and horizontal scaling performs with regards to response time. Our analysis concludes that, at this time, vertical scaling outperforms horizontal scaling when it comes to response time. Even when this is the case, we suggest that developers should build applications that are horizontally scalable. With a horizontally scalable application and our monitoring tool combined, we can reach higher availability than is currently possible.
Contents
1 Introduction 4
2 Background 5
2.1 What is cloud computing? . . . 5
2.1.1 Quality of service . . . 6
2.1.2 Scalability . . . 6
2.1.3 Vertical and horizontal scaling . . . 7
2.1.4 Rapid elasticity . . . 7
2.1.5 On-demand self-service . . . 7
2.1.6 Resource pooling . . . 7
2.2 Service models . . . 8
2.2.1 Software as a service (SaaS) . . . 8
2.2.2 Platform as a service (PaaS) . . . 9
2.2.3 Infrastructure as a service (IaaS) . . . 9
2.3 Deployment models . . . 9 2.3.1 Private cloud . . . 9 2.3.2 Community cloud . . . 10 2.3.3 Public cloud . . . 10 2.3.4 Hybrid cloud . . . 10 3 Related Work 11 3.1 Availability monitoring . . . 11 3.2 Scaling techniques . . . 11
3.3 Performance metrics and evaluation critera . . . 11
4 Problem formulation 13 5 Method 14 5.1 Observation . . . 14 5.2 Induction . . . 14 5.3 Deduction . . . 14 5.4 Testing . . . 14 5.5 Evaluation . . . 15
6 Ethical and Societal Considerations 16 7 Design and implementation 17 7.1 Horizontal scalability . . . 17
7.1.1 Implementation of horizontal scalability . . . 17
7.2 Monitoring tool . . . 18
7.2.1 Internet control message protocol . . . 18
7.2.2 Hypertext Transfer Protocol . . . 18
7.2.3 Choice of protocol . . . 19
7.2.4 Implementation of the tool . . . 20
7.3 Testing . . . 20
7.4 Cloud providers’ SLAs . . . 21
8 Results 23 8.1 One-week monitoring . . . 23
8.2 Horizontal vs. Vertical scaling . . . 27
8.3 Answer to research questions . . . 28
9 Discussion 30
11 Future Work 33
1
Introduction
Cloud computing has revolutionized the way developers build and deploy applications [1]. With the future of Internet of things (IoT) within our grasp, choosing the correct cloud provider and knowing how to utilize the different provided solutions is essential [2]. By having this knowledge, we can develop our application to have better performance, increase scalability, decrease financial costs and on top of that, we won’t need the expertise of knowing what hardware to buy and how to manage it correctly [3]. The specification of the Quality of Service (QoS) level is typically de-scribed through the definition of Service Level Agreements (SLAs), included in the service provider contract. Currently, most of the QoS techniques utilize service measurements that are collected by the network elements, adopting a service-side QoS monitoring, while a client-side perspective may be more relevant from the customers’ perspective. The client-side QoS monitoring approach gives the major role to the clients to evaluate the dedicated services through gathering the network measurements and reporting the necessary information [4]. Currently, evaluations of Infrastructure as a Service (IaaS) providers can be misguided for a number of different reasons [5]. One reason is that they rely on Internet Control Message Protocol (ICMP), which can overestimate availability because ICMP only reaches the edge of the cloud environment and therefore not finding failures in the clouds’ back-end, for example in the apache web server or in the MySQL database. ICMP can also underestimate availability because it can experience false periods of loss from some vantage points. Therefore it is important to find a proper way of doing this from what the end-users will experience, also called the end-to-end customer-experienced availability, to know how the actual customers would experience it.
When an application attracts more visitors or customers, it needs to scale with that growth. With a highly scalable application, the performance will be more or less the same no matter how many customers it gets. There are two major scaling techniques, one is vertical (scaling up) and the other is horizontal (scaling out). The easiest way of scaling is vertical, that means we are using one machine and when needed, we buy better hardware to increase its capacity. Horizontal scaling is when instead of giving more resources to one machine, we buy more machines with the same capacity [6]. Horizontal scaling actually means that we are parallelizing the load. Since enforcing horizontal scalability can ensure scaling in a more effective and cheaper way [7], we needed to investigate different methods of actually implementing the horizontal scalability from a client perspective. By having both a vertically scalable version of the application and a horizontally scalable version, we could with experimentation show if and how the QoS experienced from the client changes with different scaling methods.
Previous work has targeted different problems with finding reachability problems [8,9], failures in the network [10,11] and finding typical durations of different outages [8,12,13]. There has not been any work on finding a client-side monitoring system that monitors the end-to-end customer-experienced availability and response time. Previous studies and current monitoring tools are also using ICMP as monitoring protocol, which have shown to be unreliable.
This study will follow empirical guidelines to find and test a new way of monitoring cloud application using HTTP instead of ICMP, the same protocol as end-users will go through to access the website. We are therefore proposing a more reliable way of monitoring cloud applications as opposed to current techniques that use ICMP.
Section 2 explains the background of the problem, starting at what cloud computing is and going into details about certain terminology in cloud computing. Section3 shows previous work that has been done in the area, both regarding monitoring availability and work on the two scaling techniques, but also work that have been evaluating performance metrics. Section4explains the problem that this thesis will investigate, why this is important and a brief introduction on how it will be done. Section5 describes what research methodology this thesis will use, what different steps that will be performed and how they will be performed. Section6 explains the ethical and societal considerations taken in this thesis. Section 7 describes in detail what choices we have made in this thesis, what we have done and show detailed pseudo-code and figures that shows how we have implemented the different solutions. Section8presents our interpretation of the data gathered when performing the experiments and discusses their significance. Section9 goes into more detail about the results and provides a deeper discussion on the results, but also on the full report. Section 10 discusses the conclusions we made from this thesis and shows the most
important results. Section11 gives our interpretation on what should and can be done in future research of the problem being investigated in this thesis.
2
Background
This section gives both general and more detailed information about cloud computing. In Section
2.1we describe a general overview of cloud computing and show how different organizations de-scribes the term. We are also discussing certain topics in cloud computing, for example, quality of service, scalability and scaling techniques. Section2.2describes the different service models that exists and Section2.3describes different types of cloud deployment models.
2.1
What is cloud computing?
The traditional way of hosting applications is that organizations use their own server that has a fixed price and a cost for setting it up, this is also called "on premise computing". If the applications gets too big for their server, they need to buy better hardware. This requires a lot of planning in advance and people with knowledge to set up the infrastructure [14]. Before cloud computing got popular, server operators either had to provision for peak demand in advance or suffer from the cost with degradation in response time [15].
The more modern way of doing this is to host the application "in the cloud". Essentially, cloud computing is the art of using computing resources over the internet. The difference between these two approaches is that using computing resources "in the cloud" means that the organization are out-sourcing the responsibility to the cloud providers. The cloud providers are responsible for providing as much resources as the customer needs, thus eliminating the requirement for customers to plan ahead for provisioning [16]. Cloud providers usually offers a pay-per-use payment model which means the customer only pays for what they are using [17]. The number of resources provided will grow with the need from the customers. This removes the issue of needing to buy better or more hardware when the organization needs more computing resources.
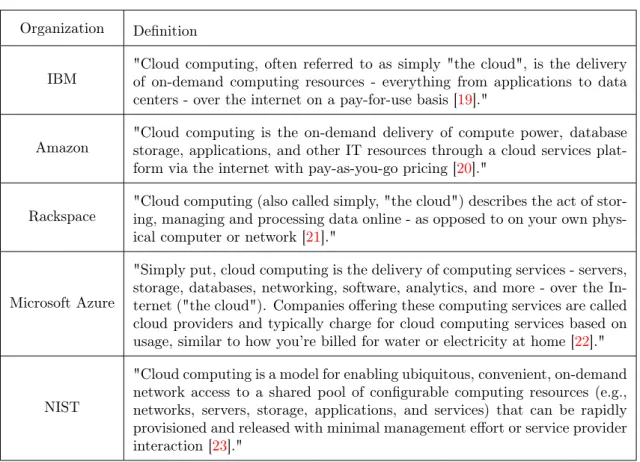
The term cloud computing doesn’t have a clear definition and in recent years there has been work on standardizing a definition. For example, Vaquero et al. compared over twenty different definitions and tried to find the common denominators to produce a standard [18]. Definitions of cloud computing from successful IT companies are shown in table1. Some of the reasons why cloud computing is attractive to business owners are shown below.
No investment cost from start : When businesses are using a cloud provider instead of investing in their own infrastructure, the up-front investment cost will be zero. This is because cloud providers uses a pay-as-you-go pricing model where customers rent resources according to their demand and only pay for what they are using [16].
Smaller operational costs: Since the customers rent resources and can de-allocate these on demand, they don’t need to provision capacities according to the peak demand [16]. Thanks to this, customers don’t need to pay for infrastructure as if they have peak demand all the time. When the demand is lower, they pay for less resources.
Easy access: Since cloud services are usually web-based, they are easily accessed through any device with a internet connection and a browser.
Reducing risks and staff expenses: When customers use a cloud provider instead of han-dling the whole infrastructure themselves, they can save both business risks and expenses. Using a cloud provider removes the need to hire their own staff with expertise within hardware. They will also out-source the responsibility for failures to the cloud provider, who probably has more expertise in the area.
High scalability : Cloud providers earn their living by offering resources through the internet. Because of this, they will often have almost endless resources and can give as much as the customer needs at any time.
Organization Definition
IBM
"Cloud computing, often referred to as simply "the cloud", is the delivery of on-demand computing resources - everything from applications to data centers - over the internet on a pay-for-use basis [19]."
Amazon
"Cloud computing is the on-demand delivery of compute power, database storage, applications, and other IT resources through a cloud services plat-form via the internet with pay-as-you-go pricing [20]."
Rackspace
"Cloud computing (also called simply, "the cloud") describes the act of stor-ing, managing and processing data online - as opposed to on your own phys-ical computer or network [21]."
Microsoft Azure
"Simply put, cloud computing is the delivery of computing services - servers, storage, databases, networking, software, analytics, and more - over the In-ternet ("the cloud"). Companies offering these computing services are called cloud providers and typically charge for cloud computing services based on usage, similar to how you’re billed for water or electricity at home [22]."
NIST
"Cloud computing is a model for enabling ubiquitous, convenient, on-demand network access to a shared pool of configurable computing resources (e.g., networks, servers, storage, applications, and services) that can be rapidly provisioned and released with minimal management effort or service provider interaction [23]."
Table 1: Different organizations definition of cloud computing.
The definition of cloud computing produced by the National Institute of Standards and Technology (NIST) can be seen as the current standard. NIST reports that cloud computing is built from five essential characteristics (On-demand self-service, Broad network access, Resource pooling, Rapid elasticity and Measured service), three service models (Software as a service, Infrastructure as a service and Platform as a service) and four deployment models (Private cloud, Community cloud, Public cloud and Hybrid cloud) [23].
2.1.1 Quality of service
Quality of service (QoS) is a measurement of how good a service actually is to the customer. QoS exists in every business where both a provider and a customer exchanges services. In anything from the restaurant business to the banking business and all the way to the cloud computing business. The specification of the QoS level in cloud computing is typically described through the definition of Service Level Agreements (SLAs), included in the service provider contract. Attributes of quality of service in cloud computing can be defined as availability, accessibility, integrity, performance, reliability, regulatory, security and response time [4]. Companies should always reach for a high QoS because it means the customers appreciates their services.
2.1.2 Scalability
Scalability is an attribute that shows how capable a system is to adapt to the current need of resources. When an application attracts more visitors or customers, it needs to scale with that growth. With a highly scalable application, the performance will be more or less the same no matter how many customers it gets [24]. If the system can receive more resources without any change in code, it is a highly scalable system. If the system crashes when receiving more resources, it is a non-scalable system [25]. An example on Snowfires’ platform is, imagine the platform is generating 2 000 visitors per day and the allocated resources are just enough for those requests. If one of the websites in Snowfires’ platform launches tickets for an upcoming event, the amount of
visitors that day might rise to 10 000. Then the allocated resources won’t be enough to handle all of the requests. With a scalable platform, this problem can easily be avoided by either auto-scaling or knowing that the load will increase and scale the platform "manually". Even though scalability is often mixed up with elasticity, there is a few differences. For example, the term scalability, doesn’t take in consideration how fast, how often and at what coarseness different scaling actions can be performed [26].
2.1.3 Vertical and horizontal scaling
There are two major scaling techniques, one is vertical and the other is horizontal, these strategies can also be called "scaling up" and "scaling out". The easiest way of scaling is vertical, that means we are using one machine and when we need to, we buy better hardware to give it more capacity. Horizontal scaling is when instead of giving more resources to one machine, we buy more machines with the same capacity [6]. Horizontal scaling actually means that we are parallelizing the load. All working systems can scale vertically with no code changes at all. To achieve horizontal scalability, the system needs to be developed in a different way. One example that many people can relate to is with Facebook. If a user uploads a new profile photo to one machine, the other machines need to be able to access this photo. This wouldn’t be a problem for vertical scalability because then we only have one machine. To achieve horizontal scalability, the servers also need a load balancer to send an equal amount of requests to each machine [27]. Some advantages with horizontal scaling is the almost unlimited access to resources and reliability. If one of the servers malfunctions, the other servers can still take care of the load. Advantages with vertical scaling can be a decrease in both amount of resources that needs to be allocated and the time that it takes to allocate more resources [28].
2.1.4 Rapid elasticity
One of the key characteristics defined by NIST is rapid elasticity [23]. Elasticity is the ability to provision and release resources to rapidly scale both out ward and in ward according to the demand [29]. There are many different algorithms to achieve this, these algorithms are often defined as elasticity algorithms, dynamic provisioning techniques or autoscaling techniques. These algorithms eliminates the need for provisioning for peak demand in advance to satisfy customer needs [15]. With autoscaling, a company that has peaks in demand but the average demand is not even close to the peaks only has to allocate a lot of resources when those peaks actually happens. Netflix is an example, when they are launching a new season of a very popular series, the peak demand will rise an enormous amount. Without cloud computing, they would need huge datacenters that could handle the peak demands and when there are no peak demands, they would have a lot of resources which wouldn’t be used. With cloud computing, they don’t need to invest huge amounts of money in buying these data centers. They only pay for what they are using.
2.1.5 On-demand self-service
On-demand self-service refers to the ability to handle resources provided by the service provider. That means, the consumer can allocate more resources if needed, without requiring human interac-tion with each service provider [23]. Most cloud providers provides a control panel for the consumer which allows him or her to to perform tasks like building, deploying, managing and scheduling [30]. 2.1.6 Resource pooling
The idea behind resource pooling is to make a set of resources behave like a single unit [31]. Cloud providers need to utilize their data centers to their full potential, and the way they are doing it is with resource pooling. Customers are sharing their resources with other customers. This is done transparently and the customer will never notice. The customer usually doesn’t use the full potential of the allocated resources and therefore this is possible. If the customer receives a higher demand, they will have those resources at hand anyways.
2.2
Service models
There are different ways to build a successful cloud provider company. The three models that NIST points out are Software as a service (SaaS), Infrastructure as a service (IaaS) and Platform as a service (PaaS) [23]. The idea of cloud computing is to out-source the management to the cloud providers. A service model can then tell how much of the cloud computing stack that is out-sourced to the cloud provider. With a IaaS model, the customer will manage more of the stack than with a SaaS model. Each service model offers a different level of user flexibility and control. Figure1 shows the layered architecture for the different models. The layers filled with green are handled by the customer and the white layers are handled by the cloud provider in the different models. Applications Data Runtime MiddleWare O/S Virtualization Servers Storage Networking Application Data Runtime MiddleWare O/S Virtualization Servers Storage Networking Application Data Runtime MiddleWare O/S Virtualization Servers Storage Networking Application Data Runtime MiddleWare O/S Virtualization Servers Storage Networking
On-Premise IaaS PaaS SaaS
Cloud provider handles the layer Cloud customer handles the layer
Figure 1: Layered architecture with responsibilites for cloud computing
2.2.1 Software as a service (SaaS)
The way people get in contact with the cloud in their private lives is usually through SaaS. As we can see in Figure1, this is the model where the customer has no control over how the application is configured. From a customer perspective, applications using these are almost any application where the customer interacts with the application without the need of knowing anything about
cloud computing. The customers will not have access to any underlying infrastructure or platform, they will only be able to change the data associated with them. These applications are normally accessible through a user interface. Examples of this are Facebook, Pinterest and Google Drive. The user has an interface where they interact with the application. When the user for example uploads a photo, this will get uploaded to a cloud service but the user doesn’t have to know that to use the application. It can also be a service that a company needs which is accessible through the cloud. For example, Snowfires’ [32] platform allows customers to have their own website without having to handle any of the infrastructure around it. Some of the advantages with SaaS is lower initial costs and painless upgrades [33]. Initial costs are lower because the customer doesn’t need to build any infrastructure and only pay for what they are using. There is painless upgrades because when the service provider makes upgrades, this will immediately be upgraded also for the customer. SaaS can also take advantage of the Service Oriented Architecture (SOA) [34]. This can give applications the possibility to communicate with other applications. Each software can act as a service provider and provide their functionality to other applications. These services can often be of the type Application Programming Interfaces (APIs).
2.2.2 Platform as a service (PaaS)
The next level of service model is PaaS. With PaaS, the cloud customers can deploy their own code but don’t have to worry about the hardware. PaaS provides the customers with platform layer resources, including operating system support and software development frameworks [16]. The customer has tools to deploy their code and the cloud provider usually supports most of the available languages. This model can be a good solution for developers who don’t have the time or resources to handle the runtime, middleware or the operating system as in an IaaS model which are shown in Figure1. Instead of spending time maintaining these layers, developers can spend time with development of the application. The cloud customer doesn’t maintain the underlying cloud infrastructure, but often has the opportunity of choosing their preferred configuration settings for the hosting environment. PaaS customers are usually developers who deploy their applications to the platform and provide the application to the end users. One example of this is Google App Engine [35]
2.2.3 Infrastructure as a service (IaaS)
As we can see in Figure1, IaaS is the service model most recognizable with on-premise hosting. Here, the cloud customers are responsible for all layers except virtualization, servers, storage and networking. IaaS provides the customer with on-demand provisioning of infrastructural resources, usually by renting virtual machines (VMs) [16]. Users usually rent a VM with their preferred operating system installed and the cloud providers don’t care about what the customers do with the VM. With IaaS, customers don’t manage the underlying cloud infrastructure but has control over the operating system and sometimes limited control over networking components [23]. Snowfire AB is for example a IaaS customer which provides the actual application to their customers and thereby is a SaaS provider for their customers.
2.3
Deployment models
We have talked about cloud computing as a whole and what different service models there are. There are also different deployment models, each with their own agenda and functionality. The biggest difference between these models are to whom they are targeting.
2.3.1 Private cloud
A private cloud is provisioned exclusively for a single organization that can have multiple business units (consumers) [23]. This is often a cloud which have the resources on-premise. The on-premise data centers can be called a cloud when they are large enough to benefit from the advantages of cloud computing [36]. With that said, a small on-premise data center can not be called a private cloud because it can not utilize the advantages of cloud computing.
2.3.2 Community cloud
A community cloud is a kind of private cloud, but instead of only being provisioned for a single organization, it is provisioned for a community of organizations. These organizations typically have shared concerns about things like security requirements and policies [23].
2.3.3 Public cloud
The cloud is provisioned for the general public. That means, anyone that wants and can afford to use a public cloud, will have access to do so.
2.3.4 Hybrid cloud
There are also clouds that are a composition of two clouds. A hybrid cloud can be combined of two or more distinct cloud infrastructures (private, community or public) and be bound together by technology that ensures data and application portability [23].
3
Related Work
This section gives an overview of previous work. Section 3.1 shows previous work in finding availability problems and work on evaluating monitoring techniques. In Section3.2 we describe previous work on the two different scaling techniques, both evaluations and how scalability can be achieved. Section3.3shows previous work on finding definitions for performance evaluations and what performance metrics that are important in such an evaluation.
3.1
Availability monitoring
There has been some work on measuring availability on cloud services and on the internet. These studies have targeted the problem with finding reachability problems [8,9], failures in the network because of blackholes or IP hijacking [10,11] and finding the typical duration of different outages [8, 12, 13]. Some studies focused on determining the cause of different outages, where one study proposed a tool for troubleshooting some unreachability problems, specifically link failures, router failures and router misconfigurations [37]. Another study which focused on determining where the outage took place proposed a tool for determining which network was responsible for the misdirected path change [38]. Other studies have focused on measurement technologies that predict path changes [39] and of edge networks [9]. The common denominator for most of these studies are that they are using ICMP as tool when probing the internet. One study shows that ICMP is not measuring availability in a correct way since ICMP can only reach the clouds’ front-end [5]. The authors suggests the need for a better end-to-end measurement tool that probes with HTTP instead of ICMP.
As already mentioned in Section 1, all of the studies carried out with evaluating availability in the cloud can be misguided because of the use of ICMP as measurement protocol. This thesis suggests an approach by using HTTP as measurement protocol to get a real end-to-end customer-experienced availability. Since our monitoring system is also monitoring the end-to-end response time, it can also be used to evaluate the choice of both cloud provider and scaling technique with regards to response time and availability. To the best of our knowledge, we are the first to propose such a monitoring system.
3.2
Scaling techniques
There has been extensive work on both horizontal scaling [40,41,42], to reduce energy consump-tion, and on vertical scaling [43] with automatic provisioning. There has also been a study that shows why we, in some cases, should scale vertically instead of horizontally [44], the authors sug-gest this because of the recent growth in DRAM for computers. Comparisons of horizontal and vertical scaling architectures is presented in [45] and in [46], where an automated approach for comparison is recommended. With such a method, comparisons could show the optimal scaling method to meet SLAs at the lowest possible cost. Older comparisons of horizontal vs. vertical scaling architectures for different workloads was done by [47, 48], where the authors found that horizontal scaling typically can offer better cost and performance trade-offs compared to vertical scaling. Nonetheless, more recent studies [44,49], have shown that vertical scaling can, sometimes, achieve even better performance than horizontal scaling for different workloads.
In most of the studies carried out with comparing horizontal and vertical scaling, the authors either had access to the clouds code or programmed their own cloud infrastructure. This study shows one way of evaluating the cloud provider and different scaling techniques from the client-side, without the need of having access to the actual cloud.
3.3
Performance metrics and evaluation critera
One of the open research problems is what different metrics to consider when evaluating per-formance. There is currently no definition on how to perform a performance evaluation. There has been work on evaluating performance produced from different cloud providers [50] where the authors found that performance was still a big struggle for cloud providers to be useful for the scientific community. A similar experiment was performed by [51], where the authors collected performance indicators from CloudStatus and show that performance variability is an important
factor when choosing cloud provider. Specific work on finding performance metrics is seen in [52], where eight different metrics was taken in consideration when evaluating performance, these were: accuracy, availability, efficiency, innovation, interoperability, maintainability, reliability and re-sponse time. One study on evaluating different auto-scaling techniques can be found in [53], where the authors highlight the problems of evaluating performance on different auto-scaling techniques and also suggests a framework for doing this. A similar study is carried out in [54] where the authors try to answer the question: "How to compare auto-scalers?". One organization that tries to find a standard for evaluating performance in the cloud is Standard Performance Evaluation Corporation (SPEC). They provide a detailed report on this in [55] where they show what metrics that are relevant when performing such an evaluation.
Even though there is ongoing work on defining a standard when evaluating performance in the cloud, the only performance metric that this thesis measures is response time. This is mostly because of the limited resources and time, but different metrics should be taken in consideration for future work.
4
Problem formulation
This study suggests a new way of monitoring availability and response time of cloud applications. The most important difference with this monitoring system and previous is that we use HTTP instead of ICMP as monitoring protocol. HTTP can show how the customers are experiencing the cloud application by reaching all the way to the clouds’ back-end. This has previously been a problem in current monitoring systems because of the use of the ICMP protocol, more known as pinging different services. Current monitoring systems might therefore show outages when there are none and sometimes not find the outages because ICMP only reaches the clouds’ front-end. We are using this approach to both monitor cloud applications over time and monitor the applications during load tests to see how the application is behaving during scaling.
One problem of the SLAs of cloud providers is that they are usually just involving availability, but not other metrics, like response time or performance [56]. Since low response time is important to SaaS providers, we have found a way to evaluate and monitor the response time that the end users are experiencing. Even though availability is a typical SLA metric, the customers of the cloud provider needs to trust the cloud provider to report undesired behavior. This is something that the customers should be able to monitor themselves since cloud providers typically don’t give out monitoring tools to their customers. Another motivation for this study is that, with this new way of monitoring the end-to-end customer experienced response time and availability, companies will be able to take actions when the server is showing undesired behaviour. This will help companies obtain an even better service than is currently possible.
Rackspace is one of few cloud providers to actually give out a monitoring tool to their customers. The problem is that the SLA for that tool is to alert the customer within 30 minutes of an outage. If the downtime for an outage is less than 30 minutes and the monitoring tool alerts after 30 minutes, the tool is almost useless. It would tell that the server was down but it wouldn’t let the customer take any actions to obtain a high availability.
Snowfire has for some time been thinking about changing their servers to scale horizontally instead of vertically. The problem is that they don’t know how this will affect the end-users. The problems this thesis is going to investigate is:
• How can we evaluate different QoS metrics of cloud providers from the client side? – End-to-end customer-experienced response time.
– End-to-end customer-experienced availability over a one week period.
• What impact the choice of scaling technique has on the end-to-end customer-experienced response time of the application?
– During workload variations that require scaling up or scaling out of the computational resources.
Both the testing of the monitoring tool and the evaluation of scaling techniques has taken place on Snowfires’ platform. Even though this is tested on Snowfires’ platform, it is applicable on any business that is hosting their application in the cloud.
5
Method
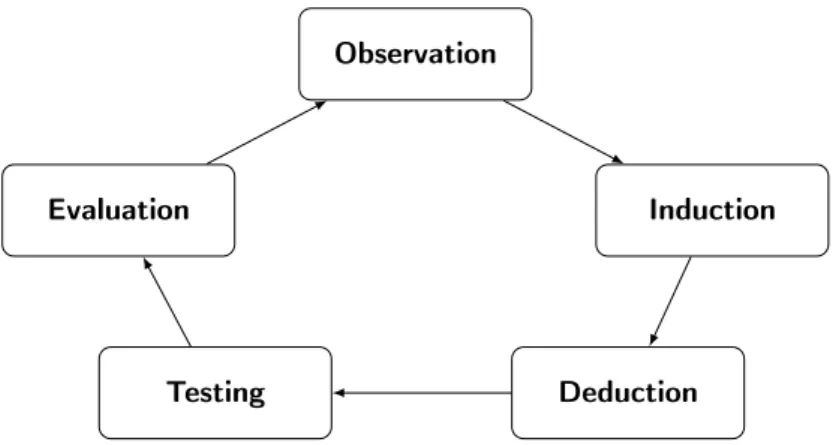
To answer the research questions, this study rigorously follows empirical guidelines. Figure2shows how our empirical study is performed.
Observation
Induction
Deduction Testing
Evaluation
Figure 2: Steps in our empirical study
5.1
Observation
By collecting relevant publications about the current state-of-the-art we have been able to find out how scientists today are evaluating the QoS of cloud providers. With this knowledge, we have found another method to do this from an end-to-end client perspective. To be able to evaluate the QoS of different cloud providers, we first needed to have a deep understanding of their provided SLAs. We also needed to collect relevant publications about both vertical and horizontal scaling.
5.2
Induction
When we had gathered the pros and cons of the scaling techniques, we could create our hypothesis based on the information gathered.
5.3
Deduction
We have implemented a monitoring tool using curl and more specifically libcurl [57]. This tool can monitor availability and response time to given URLs and save the data to a file for later evaluations. Libcurl transfers data through HTTP which is the same protocol that users will go through when visiting a website. When trying to get information from the given URL, we are always checking if the internet connection is down before confirming that the cloud provider has an outage and is not available. To be able to run the experiments with horizontal scaling on Snowfires’ platform, we needed to change the way they are handling files. Previously they were using a traditional file storage in their file structure and this has been changed. The solution we propose and have implemented is to store the files using object storage in the cloud, more specifically using Amazon S3 [58].
5.4
Testing
By running experiments with the monitoring tool during a one-week period for five different cloud providers/centers, we could test our hypothesis based on those measurements. We have tested the end-to-end availability and long-term response time of applications using different cloud providers by simulating a customer that was using the applications for a week. The cloud providers/center we have monitored and tested are:
• Rackspace, London • Rackspace, Dallas
• Digital Ocean, Amsterdam • Digital Ocean, London • Elastx, Stockholm
When testing the two scaling techniques, we deployed the applicaion to Elastx, Stockholm. While running the scaling tests, we needed to put pressure on the servers to make it scale. This is called a load test and we used LoadImpact [59] to help us achieve this. Even though we can run performance tests using Loadimpact, we only used it to increase the load, the actual experiment was handled by our own monitoring tool.
5.5
Evaluation
When we collected the response time of different evaluations, we showed and analyzed the results with an empirical cumulative distribution function. This shows all of the different percentiles in a graph that will define exactly how the platform is behaving with regard to response time. This is because percentiles can show more how the response time are distributed than if we would only use an average estimation. The data that was collected was then transfered to matrices in Matlab to perform the empirical cumulative distribution function and present the results in graphs.
6
Ethical and Societal Considerations
Snowfire AB approves of this thesis and is not asking to keep any data confidential. Another ethical consideration is as in any thesis to correctly cite any reference being used and don’t take credit for other peoples’ work.
7
Design and implementation
This section describes what choices we have made and what we have done purely implementation-wise. Section 7.1 shows how we needed to change the previous file handling to be horizontally scalable and how the new system looks. Section7.2 shows why we choose HTTP as monitoring protocol and how the monitoring tool was implemented. Section7.3 explains how the tests/ex-periments was performed and also shows how the data received was stored. Section7.4 describes what the different cloud providers SLAs promise in regards to availability.
7.1
Horizontal scalability
The two different scaling techniques, horizontal and vertical scaling differs when it comes to ar-chitectural decisions. A horizontally scalable application will also be vertically scalable, but a vertically scalable application is not always horizontally scalable. To achieve horizontal scalability, we need to have the same data on all different servers at any time.
If we think of a web application built on Snowfires’ platform, every time we save some code in their code editor or upload a file, every machine that is hosting this website, needs access to this file. This could be done by either uploading the file to all the machines at once, this would of course spend a lot of resources and time, thus being ineffective. Another option would be to upload the file only to the machine that is currently being used, and then storing what machine we uploaded that file to in the database. That would be a functional solution, but what happens when the load on the servers decreases and that machine gets temporarily shut down? Until the load increases again, the file that got uploaded, would be unaccessible. The solution we implemented in this thesis was to use object storage and uploading the files to Amazon S3 [58] for third-party storage.
7.1.1 Implementation of horizontal scalability
Before this thesis was carried out, Snowfire handled files the traditional way. That is, storing the files right on the server in the application file structure. By using Amazon S3, the files are stored in a third part data center and can be accessed through their Representational State Transfer (REST) API. Changing Snowfires’ whole platform to handle files through Amazon S3, required a lot of implementation. To show the full implementation of this is unnecessary for the cause of this thesis. What we will show is one example of how files were handled before and one more example of how files are handled today.
In figure3a, we can see how files were uploaded previously. The user uploaded a file through their web browser, the file gets uploaded to the application back-end and then the name of the file gets uploaded to the database and the actual file gets stored in the application file structure. Figure3bshows how files was accessed by the user. The user goes to a web page where files have been uploaded. The application back-end notices this, asks for the relevant file from the database, gets the name of the file and grabs that file from the application file structure.
Figure 4shows how files are handled the new way. When uploading a file, as shown in figure
4a, the user does the same thing as previously. When the back-end is uploading the file, a global reference is stored in the database. That way, the file that gets uploaded to Amazon S3, can be accessed by anyone, from anywhere. Figure4bshows how the user can access files. This is handled almost identical as the old version, but with the new version, the file is globally accessible and it doesn’t matter which server machine we uploaded the file through. The new way makes horizontal scaling viable. The last thing to point out about scalability is that, if we would never upload files, any application would be both vertically and horizontally scalable. What this means, is that static websites, or 100% read-only websites, are both vertically and horizontally scalable.
Client browser
Application
Database
File structure Start
(a) Uploading of files the old way
Client browser Database
Application File structure Start
(b) Downloading of files the old way
Figure 3: The old way of handling files
Client browser
Application
Database
Amazon S3 Start
(a) Uploading of files the new way
Client browser Database
Application Amazon S3
Start
(b) Downloading of files the new way
Figure 4: The new way of handling files
7.2
Monitoring tool
7.2.1 Internet control message protocol
As already mentioned in section3, previous studies on availability and routing-failures have been based on ICMP based pings and traceroutes. ICMP is part of the Internet Protocol (IP) imple-mentation and therefore, also exists in the network layer in the protocol stack. An ICMP echo request works by sending a message to the remote host and then listen for a reply. The sending machine can then get a reply which can have different meanings. Examples of replies are 0 which means "OK" or 3 that means "Destination unreachable".
7.2.2 Hypertext Transfer Protocol
There are multiple different protocols to send data over the network. One protocol in the ap-plication layer is HTTP. This is used to transfer web pages over the world wide web. HTTP has numerous different ways of communicating with the server, this includes, for example, POST, GET, HEAD and PUT. As a response to these requests, the client will receive a code and if the request is a GET it will also receive whatever it is requesting. The codes that the server will send is shown in table2.
Status code Meaning 1xx Informational response 2xx Request succeeded 3xx Redirected 4xx Client errors 5xx Server error
Table 2: HTTP status/response codes
7.2.3 Choice of protocol
For the monitoring program that has been developed, HTTP is the protocol that has been used. One of the reasons we choose HTTP is that it has shown to be more reliable than ICMP [5]. The other important reason is that the goal of this thesis was to build a monitoring tool that monitors from the client side and shows a customer-experienced availability and response time. Since customers accessing a web application will go through HTTP, this is the required protocol to use. One practical example of when ICMP would show a false success and HTTP would show a correct error is when Apache is shut down on the server computer. ICMP would still see that the server is up but because it doesn’t look further than the surface, it wouldn’t find that the user can’t reach the website. HTTP on the other hand, would try getting information from the server and get a bad response code. If the client hasn’t shut down apache manually, but the cloud environment can’t reach the apache server, would be one way a cloud provider can have an outage in their back-end. Other ways that ICMP can return success but HTTP will find failures is when the database in the environment is unreachable or when the actual IaaS environment is stopped. In other terms, ICMP pings can not get the actual website that the end-user would try to get, and therefore not find failures in important parts of the cloud infrastructure. HTTP can get the page and will therefore find failures in those important parts. Figure5 shows the difference between HTTP and ICMP. The red lines show how a HTTP request would travel through the servers and cloud environment. The blue lines show how an ICMP request would only travel between the client computer and the cloud server.
Figure 5: HTTP request vs ICMP request
7.2.4 Implementation of the tool
An early decision in this thesis was to use HTTP to monitor both availability and response time for the server. There are mainly two ways of sending HTTP requests through the command line, cURL [60] and Wget [61]. Both of these open-source packages originated in the middle of the 90s and support HTTP, HTTPS and FTP. The monitoring tool developed in this thesis uses cURL, this is because cURL provides a cross-platform library called libcURL [57] and Wget only works from the command line. We use libcURL and implement the tool in c++.
In this thesis, we have full control over the actual websites being monitored and we can therefore know that our websites won’t respond with any other status code than 200 when the service is up and running. The monitoring tool will therefore record downtime on any requests that responds with any other code than 200. One early problem when developing the tool was to implement it in a way that would notice when the network connection for the monitoring tools’ computer was down and when the actual server was not responding. Before testing if the server is up, the tool tests if either google or yahoo is up, two of the biggest search engines with a very high availability and reliability. If both google and yahoo is down, we can safely assume that the monitoring tool has no network connection and won’t falsely accuse the cloud provider of being down. To investigate that this actually worked, we tried turning off the network during monitoring and recording the time there was no network connection. When this time corresponded with the time that the actual network connection was down and the tool didn’t record any server downtime, we could safely assume that this approach worked.
The steps that the monitoring program does during execution is shown in algorithm1
7.3
Testing
To do the tests of the different cloud providers and centers listed in Section 5.4, we used the monitoring tool we developed. By getting data from each request that we sent to the server, we
Algorithm 1 Pseudo-code for the monitoring tool while true do
network ← f alse if isUp(google) then
network ← true else if isUp(yahoo) then
network ← true end if
if network then
response ← curl(siteT oM onitor) if response.code == 200 then
save(response.responseT ime) else
downT ime ← 0
while response.code 6= 200 do
downT ime ← downT ime + response.responseT ime end while
save(downT ime) end if
end if end while
could monitor both response time, availability, when the network was down and at what time every request was sent. Figure 6 shows how the data received from the monitoring tool is stored in a file. The first column shows the response time. The second column shows the amount of time the cloud application is not responding from when the request was first sent. The third column shows the amount of time the network of the monitoring tools’ computer is not responding. The last column show the date and time of when the last request in that row was sent. With all of this data, we can analyze the results in a correct way. If the cloud application is down, we can easily map this against what the cloud provider is reporting. If they also report downtime, we have nothing to complain about. If they haven’t reported any downtime but our monitoring tool says the application was down, the cloud provider has kept this from the client. This would definitely prove how much such a monitoring tool is needed. With this data we can also take all the response times and analyze them using the empirical cumulative distribution function used in this thesis. If we want, we can also check at what times the response time was bad and when it was good. It might be a pattern that needs investigation.
Figure 6: How data is stored in file.
7.4
Cloud providers’ SLAs
An important part in this thesis, was to fully understand the SLAs of the cloud providers we monitored. This is both because we wanted to evaluate if the cloud providers breaks their SLA and if the SLAs provided are reasonable according to the monitored data. Since SLAs typically don’t include any performance metrics, the important metric we investigated is availability.
Rackspace has a detailed and extensive SLA [62]. It includes SLAs of all of the services they provide. For their actual servers, their SLA specifies a promised 99.9% monthly uptime. If they don’t meet this, they will compensate the customer equal to a specific percentage of the customers monthly payment.
The second cloud provider that we monitored, Digital Ocean, promises even more availability. Their SLA provides a promised 99.99% monthly uptime. Downtime is refunded back at the hourly rate incurred [63].
The last cloud provider we have monitored is Elastx. Their public SLA only shows the response time they guarantee from their support when an error has occurred [64]. The agreed SLA between Snowfire and Elastx is to provide at least 99.95% uptime on a monthly basis.
8
Results
The results obtained in this thesis can be divided into two parts. Section8.1 shows the response time that was stored during a one-week period of the five different cloud providers/centers. It will also show how much of the time during that week, that each data center was available. Section
8.2will show the response time stored from the experiment with horizontal and vertical scaling.
8.1
One-week monitoring
This section shows the obtained results from the one-week monitoring of five different cloud data centers. After storing response time for each request, we could plot the results in graphs using the empirical cumulative distribution function. Figure 7, 8, 9, 10 and 11 shows the plotted re-sponse time during the one-week period where the bold red vertical line highlights the one-second threshold. We highlight this threshold because the requirements from Snowfire is to keep as much response times as possible below one second. The cloud providers don’t state any response time requirements in their SLAs, so this is just what Snowfire is expecting based on their experience. This section also shows the monitored uptime for each data center, this can be found in Table3.
As previously mentioned in Section7, we used libCurl and HTTP to monitor the different cloud data centers. By sending requests with a five-minute interval we could monitor both response time and a near-perfect availability. We sent request every five minute instead of all the time to not affect the load on the servers more than necessary. Even though one request will not create a large amount of load, with a five-minute interval, we should be able to record almost all of the downtime. Since a cloud data center could be down when the monitoring tool was resting, the uptime for the cloud data centers will not be 100% accurate. Even if the monitoring tool can’t monitor 100% accurately with the five-minute interval configuration, Table3will only overestimate uptime, never underestimate. A similar limitation can be seen when monitoring the response time. Since we send request with a five-minute interval, we didn’t monitor response time for all the request that we could have sent in the one-week period. Since the requests are spread out with the same amount of time between every request, this should still represent a fair analysis.
One of the foundational QoS metrics is reliability [4]. This can be seen with different perspec-tives, but one metric in reaching high reliability is to keep the response time at an even level at all times. As we can see in figure7, 9,10 and11, all of these cloud data centers provide reliable response time. Especially, Figure9 and 10 has almost identical lines every day. One cloud data center that absolutely doesn’t provide reliable response time is Rackspace in Texas. As we can see in Figure8, the response times are very much spread out every day.
When it comes to performance, one of the key metrics is response time [52]. It should be as low as possible and as we can see in Figure7,9,10and11, at least the 95th percentile of response time for each day is below 1 second. When analyzing pure response time, the same cloud data center that showed poor reliability, also showed bad response time. As we can see in Figure8, the 95th percentile of response time for each day is between 5 and 14 seconds, which should be seen as very high. The cloud data center with the lowest response time when analyzed for the whole week is Digital Ocean in Dublin. As we can see in Figure 10, the plotted lines are very steep in the beginning and are always reaching the 98th percentile before they even out. Here, the 98th percentile for every day is always under 300ms, which should be seen as very low.
As we can see in Table 3, both Rackspace in London and Digital Ocean in Dublin, was up and running 100% of the time during the one-week monitoring. They therefore reached their provided SLA of 99.9% and 99.99% uptime respectively. All of the other cloud data centers, Rackspace in Texas, Digital Ocean in Amsterdam and Elastx in Stockholm failed to provide 100% uptime. Rackspace in Texas was up and running approximately 92.6% of the time and they did not reach their provided SLA of 99.9% uptime. Digital Ocean in Amsterdam was up and running approximately 99.98% of the time and did therefore not reach their provided SLA of 99.99% uptime. Elastx in Stockholm was up and running approximately 99.8% of the time and did therefore also not reach their provided SLA of 99.95% uptime.
Since we only monitored the data center for one week, Digital Ocean in Amsterdam and Elastx in Stockholm could still reach their provided SLA. This is because SLA-violations are calculated during a full month. With this weeks uptime and 100% uptime for the rest of a month, they
could reach approximately 99.996% and 99.954% uptime respectively. Rackspace in Texas, with approximately 92.6% availability, can not reach their provided SLA even with 100% uptime for the rest of a month. The maximum uptime they could achieve would be approximately 98.3%. Since their provided SLA promises 99.9% uptime, this would be a typical SLA-violation and they will need to compensate Snowfire this month.
Figure 8: Response time stored from Rackspace, Texas
Figure 10: Response time stored from Digital Ocean, Dublin
Cloud provider Downtime minutes Uptime percent Uptime/month SLA
Rackspace, London 0 min 100% 99.9%
Rackspace, Texas 740 min 92.65% 99.9%
Digital Ocean, Amsterdam 1.45 min 99.98% 99.99%
Digital Ocean, Dublin 0 min 100% 99.99%
Elastx, Stockholm 20 min 99.80% 99.95%
Table 3: Measured availability for cloud providers during a one-week period
8.2
Horizontal vs. Vertical scaling
This section shows the response times that was stored during the load test on Elastx. We created a five-minute load test where the requests per second gradually increased from 0 to 2500. The actual scaling was performed with auto-scaling, that means, the algorithms provided by Elastx handled the scaling automatically. Figure12shows how the response time behaved with both vertical and horizontal scaling during the load test. The graph is created for every response time we stored with the empirical cumulative distribution function. Figure 13 shows how the average response time behaved depending on how many requests per second we sent. The Y-axis represents the response time and the X-axis represents requests per second.
As we can see in both Figure 12 and 13, using vertical scaling on Elastx, is much better for response time than using horizontal scaling. The plotted lines in Figure12 shows that approxi-mately 98% of all response times with vertical scaling was lower than all of the response times with horizontal scaling during our five-minute load test. The graph also shows that the response time with vertical scaling is much more consistent than with horizontal scaling. With vertical scaling, the line goes almost directly straight up while the line representing horizontal scaling, is more flat, which represents inconsistent response times.
Figure13shows exactly what the average response time was for every increase in requests per second. Here we can see that the line with vertical scaling is very flat and with a very low amount of sudden peaks. The peaks in response time with vertical scaling are not very different from the lowest response time that was obtained. When the peaks occur is probably right before the scaling has taken place. The graph shows us that the vertical scaling technique used on Elastx is very quick to adapt when noticing the need to scale, they therefore have rapid vertical elasticity. In Figure13, we can also see that the average response time with horizontal scaling is always much higher than the response time obtained when using vertical scaling. We can also see that some of the peaks that occurred during horizontal scaling, is peaks that represents response time much higher than normal. This means that horizontal scaling on Elastx isn’t as fast as the vertical option to adapt to the current load. We can also see that when it has allocated enough resources, and the response time is back to normal, another peak occurs almost immediately.
To summarize these results, we can with all certainty see that vertical scaling gives better response time than horizontal scaling during load tests of this kind. It also showed to have better average response time even when the servers had scaled and had the computational resources to handle the current load. The most probable reason why horizontal scaling was more inconsistent than vertical scaling, is because when we horizontally scale, we need to copy a full application to a new virtual machine before it can run. With vertical scaling, we only need to give the server more virtual resources. Therefor, we can state that horizontal scaling isn’t able to handle load increases at this rate.
Figure 12: Response time stored from five-minute load test using the Empirical cumulative distri-bution function
Figure 13: Average response time for Requests Per Second during five-minute load test
8.3
Answer to research questions
• How can we evaluate different QoS metrics of cloud providers from the client side? – End-to-end customer-experienced response time.
These two subquestions is answered by the work we have done with the monitoring tool. Earlier monitoring tools that monitor availability only measures what the network elements will experience, not what the actual end-users will experience. Therefor we have proposed to monitor using HTTP, which is both more reliable than ICMP and will monitor what the end-users will experience. HTTP is also able to monitor both availability and response times for an application at the same time. ICMP can not monitor response time, at least not what the end-users will experience.
• What impact the choice of scaling technique has on the end-to-end customer-experienced response time of the application?
– During workload variations that require scaling up or scaling out of the computational resources.
This question was answered during our load tests. Since we have some limitations due to the short time we had while conducting the study, we have only been able to create one type of load test. With that load test we could see that horizontal scaling isn’t a viable approach when the load increases at a rather fast rate. Vertical scaling on the other hand, does this very well. It scaled within seconds and the application will therefor respond with almost the same response time at any time.
9
Discussion
This thesis has obtained results that can be analyzed in a simple way. As cloud data center, there was two centers that reached 100% uptime, Rackspace in London and Digital Ocean in Dublin. Both of these also show acceptable response times and either one of them could be the future choice for Snowfire. If we want to choose a cloud data center from the five that we have monitored, one of these is the answer. Since Digital Ocean in Dublin shows lower response time in our plotted graphs, that data center is the best one based on end-to-end customer-experienced response time and availability. These results are still very much questionable when it comes to the decision of the best cloud provider. Even though response time is one of the metrics to evaluate performance, there are still many other metrics to take into consideration [52]. One QoS metric that we evaluated in this thesis was availability. Availability is very easy to evaluate, is the service up or is it down? Previous work on evaluating availability have used ICMP as monitoring protocol, this thesis starts a new chapter for this kind of problem. Instead of using ICMP, which has shown to be unreliable [5], we use HTTP requests to measure if the service is up or down.
The results obtained in this thesis has also shown that a reliable monitoring system is needed, we can’t always trust that the cloud providers will keep the promised SLA. Three cloud data centers failed to keep the promised SLA during the one-week period we monitored the services. One of them wasn’t even able to obtain their monthly promised SLA even if they would have had 100% uptime for the rest of the month. The response time for Rackspace in Texas this week, wouldn’t even cut it in 2004, where [65] conducted a study on waiting time that users would accept to download a website. They concluded that users will often leave if they needed to wait more than 2 seconds. If the response time is around 10 seconds, the load time will be even more. That means, the websites that Snowfire is hosting on Rackspace in Texas, may have lost a substantial amount of customers this week. We suggest that every company that hosts their application in the cloud, uses this monitoring tool to control when the cloud provider is violating their SLA.
This monitoring tool can be used in any business that hosts their application in the cloud, both for monitoring and for reaching higher availability and better performance. If we want to reach higher availability, there are some things that can be used. We should deploy the application on either multiple clouds or on multiple data centers. Then we can use for example a "hot standby", where we mirror all of the information from one server to the other in real time. When the monitoring system discovers an outage, we switch to the other cloud provider/center. When the monitoring system discovers a higher than normal response time, we can give the server more resources and hopefully reduce the response time. These approaches rely on that the cloud provider has an API for changing different aspects in the environment. Another weakness in this approach is that higher response time is not always because of to few resources, it can for example happen because of bad network connection/speed on the monitoring system. This can be avoided with the same approach that we use to check that the network connection is up. If both google and yahoo is showing slow response time, it is most definitely bad network connection at that time, otherwise the actual server is responding slow. This is one of the problems that wasn’t considered when the monitoring tool was implemented. Some of the requests probably had a slow network connection and therefore responded slowly. If the solution to this would have been implemented, the plotted graphs could have been even better.
Since this thesis only monitored the cloud data centers for one week, the results can be misguided when we look at different cloud data centers as a whole. The week we monitored might have been a very bad week for Rackspace in Texas or a very good week for Digital Ocean in Dublin. We can also not control if at least Rackspace in Texas, that has no chance of recovering from the downtime this month, will compensate Snowfire for not keeping their promised SLA.
The results obtained when load testing a web application on Elastx in Stockholm showed us that, just as [44,49] also stated, vertical scaling is a far more effective alternative than horizontal scaling when it comes to response time. With a load test that gradually increased the requests per second from 0 to 2500, the response time with vertical scaling was 98% of the time, faster than the response time with horizontal scaling. Even though we only did the load test during five minutes with a maximum of 2500 requests per second, we showed that when the server had adapted to the current load, vertical scaling always had a much lower average response time.
scaling algorithm can perform better than vertical scaling, and in that case which one it is. If Snowfire chooses Elastx to be their future cloud provider, vertical scaling will definitely be used. But since we stated that, to reach the highest possible availability, we need to deploy the application on multiple data centers or multiple cloud providers, the application needs to be built for horizontal scalability. Either if we use a "hot standby" or have multiple active servers that use vertical scaling individually, we need to have the same data on every machine. If files are uploaded to one machine, it will be to heavy for the server to copy them to every machine. That is why we need to build for horizontal scalability.
This thesis has shown how we can evaluate the end-to-end customer-experienced response time and availability over a one-week period and why our monitoring tool is more reliable than previous work. We have also shown how the tool was implemented, how we can use it to evaluate different cloud providers and given examples on how we can use it to reach higher availability and better performance.
10
Conclusions
A big problem in previous work on monitoring cloud application is that the tools have shown to be unreliable. Therefore, a new approach was needed, this time monitoring the end-to-end customer-experienced response time and availability. At the end of the day, the customers are the most important people to please.
This thesis has shown a new way of monitoring cloud applications, by using HTTP instead of ICMP, we can reach a higher degree of reliability. With the results from the one-week monitoring, we ask ourselves, should we start questioning cloud providers? During this one week of monitoring, Rackspace in Texas only reached approximately 92.6% of uptime but there is no sign of them reporting it to the customers. Maybe it is time we take it into our own hands and use this monitoring tool to control the availability ourselves.
With the experimentation with vertical and horizontal scaling, we could with load tests show that using vertical scaling will help the application perform better than when using horizontal scaling. Even though vertical scaling is at this point a better alternative than horizontal scaling, we suggest that developers build applications that are horizontally scalable. The reasons behind this is, first of all, there might come a time where vertical scaling is not enough to serve all the customers. Second, and most important, to reach the highest possible availability, the application needs to be horizontally distributed. No matter what alternative for horizontal distribution that is used, all the servers need to have the same data at any time, with a horizontally scalable application, this will not be as heavy for the servers as with a non horizontally scalable application. Even though we suggest a horizontally scalable application, it should still scale vertically, but if we want horizontal distribution, all of the servers need to have access to the same data at any time.
Our study has obtained results that are important for the decision that Snowfire will make on whom their future cloud provider will be. The actual monitoring tool can also be of importance for companies either trying to reach high availability or only trying to compare different cloud providers.
11
Future Work
There is a substantial amount of research on cloud computing. One of the most important topics is reaching high availability. We predict, that by using our monitoring tool, cloud customers can reach higher availability and better performance than was previously possible. Our estimations will though need to be experimented with and analyzed.
The most basic idea for future work is to do a similar experiment with our tool, but on many different cloud providers and in a much longer period of time. This way, we can evaluate how much availability different cloud providers should promise and if they report the correct uptime. A second step would be to compare our HTTP approach with an ICMP approach during a long period of time, this can be done in the same study. Hopefully, HTTP will show a higher degree of reliability than ICMP.
Other future work is to continue developing our monitoring tool to do more than just reporting data. As mentioned in Section9, a study should be performed while using the tool to reach higher availability. This can be done in many different ways but one suggestion is to use a "hot standby" and when discovering an outage, we swap to the "hot standby" and set the other server as the "hot standby". When an outage occurs, we should only get a few seconds of downtime until the monitoring tool discovers it and starts sending customers to the server that doesn’t have an outage. Another suggestion is to horizontally distribute the application and use a load balancer to handle the load between the servers. The servers should individually use vertical scaling.
Horizontal vs. vertical scaling is a hot topic and different researchers have different opinions on what scaling option is the best. More recent studies have shown the vertical scaling often gives better performance, and this might be because of the current growth in DRAM for computers. We urge others to continue doing these types of experiments, the algorithms are getting better and better, and without experiments, we won’t know what scaling option to choose from.