Mälardalen University Press Dissertations No.24
RAPID MEASUREMENTS OF THE MOISTURE CONTENT OF
BIOFUEL
Jenny Nyström 2006
Department of Public Technology Mälardalen University
Copyright © Jenny Nyström, 2006 ISSN 1651-4238
ISBN 91-85485-08-X
Cover photo: Ana Marta da Paz
Printed by Arkitektkopia, Västerås, Sweden Distribution: Mälardalen University Press
I
A
BSTRACT
An increasing number of power plants in Scandinavia are beginning to use biofuel instead of coal or oil. The material in the new fuel is a mixture of woodchips, mostly Pine, Spruce and Salix, bark, GROT (tops and branches from felling waste) and sawdust from sawmills. It is heterogeneous, having a moisture content varying from 15% up to 65%. The moisture content affects the combustion of the fuel and therefore its commercial value. The industry is now interested in obtaining a method for measuring the moisture content of biofuel, quickly and reliably; preferably on delivery at the power plant.
The measuring technique presented in this thesis is the first reported in the literature capable of measuring the moisture content of a large sample of such an heterogeneous material as biofuel. The equipment is today calibrated for a sample volume of 0.1 m3. A radio frequent signal is
supplied from an antenna and penetrates the biofuel. Its reflection is modeled using partial least squares.
As part of the work presented in this thesis, a new type of measuring rig and an analysis method for measurement of the moisture content of large samples of heterogeneous material have been developed. A statistical model for moisture content measurements of five different biofuel materials using radio waves has been built, having a root mean square error of prediction of 2.7. The interactions between biofuels and radio frequent signals have been demonstrated, indicating a variation of the reflection with varying types of biofuel material and variation in the reflection and delay of the signal with varying moisture content.
III
S
VENSK SAMMANFATTNING
S
UMMARY IN
S
WEDISH
I Skandinavien sker en omfattande omställning från kol och olja till biobränslen i kraftbranschen. Materialet i biobränslet består till största delen av flis från gran, tall, Salix, bark och GROT (Grenar, Rötter och Toppar) från skogsavverkningen, samt sågspån från sågverken. Bränslet är heterogent med en fukthalt mellan 15% och 65%. Fukthalten påverkar såväl prissättning som förbränning. Därför är industrin intresserad av att en metod tas fram som kan mäta fukthalten snabbt och tillförlitligt och allra helts redan när bränslet vägs in på kraftvärmeverken.
I denna avhandling redovisas framtagning och utvärdering av en ny metod för att mäta fukthalten i biobränsle. Det är den första metoden, rapporterad i litteraturen, som klarar fukthaltsmätningar av stora prover av heterogena material. Inom ramen för denna avhandling har också en ny mätutrustning och en metod för dataanalys av mätningar på stora prover av heterogent material tagits fram. Statistiska modeller för fukthaltsmätning med radiovågor på biobränsle har också tagits fram.
Mätutrustningen är idag kalibrerad för prover på 0.1 m3. En
radiovågssignal passerar genom bränslet i vågledaren och reflekteras i botten. Den returnerade signalen filtreras och modelleras. Genom att använda en multivariat modell i kombination med radiovågsmätningar har fukthalten kunnat mätas i stora volymer av olika typer av biobränslen med en osäkerhet på 2.7 %. Interaktionen mellan biobränsle och radiovågor visas. En variation av beloppet på reflektionen kan påvisas med varierande sorters biobränsle och en variation av beloppet på reflektionen samt en tidsförskjutning med varierande fukthalt.
V
A
CKNOWLEDGEMENTS
The road leading to this thesis has been tough and rocky, but I have also had a lot of fun during the journey. There are a bunch of people who have been involved in one way or another and I want to take the opportunity to extend my greatest thanks to these people.
During the entire journey I have been supervised by Stefan Backa. You have been the “science director” and also have competence in chemometrics and wood technology. You have always been available personally or on telephone or mail, answering any question in the world. Thanks!
I want to thank my friend Eva Thorin who also became a supervisor in house and co-worker in the project. You have other ways to look upon things than I do, and by that you often have a way out of situations where I am lost.
Bo Franzon is a hero within this project. You had the competence in electromagnetic theory that we others did not have. I had a tough time finding such person and I have learned a lot from you. Thanks!
Erik Dahlquist is a person without limitations and who initiated this project. You always listen and want to help. Thanks.
I want to thank Ana Marta da Paz for performing numerous measurements during the last 1 ½ year. You have been precise and structured. It would have been impossible to perform all these measurements without you.
I want to thank Mälarbränsle and the staff at the municipal power plants in Enköping, Eskilstuna and Västerås for the cooperation, hard work and for supporting the project with biofuel. I will never forget the singing Santa
VI
Claus and the heated pub-tent with all the surrounding flashing lights in the cold midwinter!
The staff at the Department of Public technology is wonderful! Thanks for support and many laughter’s, wild parties and the best song quartet in the world; “Isterbandet”.
I also want to take the opportunity to thank my mentor Marja Widell for support during this time.
During the finishing off of the thesis, helping hands were reached out from the directors of studies and from Christer Norström and Dag Nyström. Thanks for your support.
At last I want to thank my wonderful husband Dag Nyström and daughter Liv Nyström for supporting me during this journey, especially during the last months. I apologize for taxing on my family.
Jenny Nyström
VII
L
IST OF APPENDED PAPERS
Publications included in this thesis
This thesis is based on the following papers and reports, referred to in the text with Roman numerals. Parts of this thesis have previously been published in my licentiate thesis, Fuel Characterisation with Radio-Frequency Spectroscopy. Mälardalen University Press. 2003.
Journal papers
I. Nyström J, Dahlquist E. Methods for determination of moisture content in woodchips for power plants – a review. Fuel. 2004. Vol. 83. pp.773-779.
Contributions from Jenny Nyström: Main author.
II. Nyström J, Franzon Bo, Methods for Analysis of Radio-Frequency Measurements of Moisture Content in Biofuel. Submitted for
journal publication.
Contributions from Jenny Nyström: Main author, evaluation of models.
Mainly responsible for the model calculations performed in collaboration with Bo Franzon. Bo Franzon also participated in the development of the data processing.
III. Nyström J, Thorin E. RF-Measurements of Moisture Content of Biofuel using Time Domain signals. Submitted for journal
publication.
Contributions from Jenny Nyström: Main author, evaluation of data, model
VIII
Conference papers
IV. Nyström J, Thorin E, Backa S, Dahlquist E. Moisture Content measurements on Sawdust with Radio Frequency Spectroscopy. In
proceedings of ASME Power, Chicago, Illinois, USA, April 5-7
2005, ISBN 0791841820.
Contributions from Jenny Nyström: Main author. Main evaluation and
modeling of the data. Model identification was performed in collaboration with Stefan Backa.
V. Nyström J, Franzon B, Radio Frequency System for Measuring Characteristics of Biofuels. In proceedings of IEEE Instrumentation
and Measurement Technology Conference, IMTC®/2005, Ottawa,
Canada, 17-19 May 2005, pp. 978-983.
Contributions from Jenny Nyström: Main author. The development of the
technical concept and the evaluation of the system and measurements were performed in collaboration with Bo Franzon.
Publications not included in this thesis
Conference papers
• Nyström J, Thorin E, Backa S, Dahlquist E. Filling level measurement in woodchip bins with radio-frequency spectroscopy.
In proceedings of Nordic Seminar on Thermochemical Conversion of Biofuels. Nov. 12, 2002.
• Nyström J, Thorin E. Moisture Content Measurements with Radio Frequency Spectroscopy. In proceedings of 3rd Nordic Drying
Conference, Karlstad, June 15-17, 2005. Reports
• Dahlquist E, Axrup L, Nyström J, Thorin E, Paz A. Automatic moisture content determination on biomass with NIR and radio frequency spectroscopy. Varmeforsk Project Publication Series. 2005; no. 936. In Swdish.
• Nyström J, Axrup L, Dahlquist E. Long-term evaluation of on-line sensors for determination of moisture in biomass. Varmeforsk
IX
T
ERMINOLOGY
Abbreviations:
b Bark
DH District heating
G, GROT Branches, tops, roots and needles from felling wastes MC Moisture Content, mass fraction [%]
MR Moisture Ratio [%]
PCA Principal Component Analysis PLS Partial Least Square
RF Radio frequency
RMSEP Root mean square of prediction
RT Residual woodchips
SD, s Sawdust
Sdev Standard deviation
SEC Standard Error of Cross validation SEP Standard error of performance
SOL Waveguide standards: short, offset short and load SV Logwood chips, stemwood chips
X
Symbols:
θ Angle [°]
Λ Moisture content, volume fraction [%]. φ Phase shift, [°] or [rad]
Γ Reflection coefficient (S11)
λ Wavelength [m]
ε Dielectric constant
ε′ Real part of dielectric constant ε″ Imaginary part of dielectric constant εa Approximated dielectric constant
δ Loss factor
µ Magnetic permeability [H/m]
A Attenuation [dB]
c Speed of light [m/s]
E Directivity error or Electric field strength [V]
f Frequency [Hz] H Height [m] l Sample thickness [m] m Mass [kg] n Number of samples P Power [W] U Voltage [V]
v Speed of electromagnetic wave in a dielectric [m/s]
ymodel Predicted value by a model
yreference Reference value
XI Subscripts: a Apparent d Dry i Incident m Moisture r Reflection t Transmission v Volume w Wet
XIII
T
ABLE OF CONTENTS
Part I
ABSTRACT... I SVENSK SAMMANFATTNING SUMMARY IN SWEDISH ...III ACKNOWLEDGEMENTS...V LIST OF APPENDED PAPERS...VII
PUBLICATIONS INCLUDED IN THIS THESIS... VII
PUBLICATIONS NOT INCLUDED IN THIS THESIS...VIII
TERMINOLOGY... IX 1 INTRODUCTION ...3 1.1 PROBLEM FORMULATION...5 1.1.1 Scope ...5 1.2 THESIS OUTLINE...6 2 THEORY ...7 2.1 BIOFUEL...7
2.1.1 Chemical properties of biofuel ...8
2.1.2 Water in biofuel and moisture content definitions ...9
2.2 RF...11
2.2.1 RF definitions...11
2.2.2 The influence of RF-waves on wood and water ...16
2.3 MULTIVARIATE ANALYSIS...17
2.3.1 PLS ...18
2.3.2 Validation...18
XIV
3.1 CONCEPT FOR RAPID MEASUREMENTS OF MC OF BIOFUEL...22
3.2 METHODS FOR MEASURING THE MC OF BIOFUEL...22
3.2.1 Contribution...22
3.2.2 Results and discussion ...22
3.3 MEASUREMENT SYSTEM...24
3.3.1 Contribution...24
3.3.2 Related work ...24
3.3.3 Results and discussion ...25
3.4 DATA PROCESSING...28
3.4.1 Contribution...28
3.4.2 Related work ...28
3.4.3 Results and discussion ...29
3.5 PROOF OF CONCEPT...31
3.5.1 Contribution...31
3.5.2 Results and discussion ...31
3.6 THE INTERACTION BETWEEN RF AND BIOFUEL...33
3.6.1 Contribution...33
3.6.2 Related work ...34
3.6.3 Results and discussion ...35
3.7 RECAPITULATION...38 4 CONCLUSIONS...41 5 FUTURE WORK...43 BIBLIOGRAPHY...45
Part II
Paper 1 ... 53
Paper 2 ... 67
Paper 3 ... 87
Paper 4 ... 105
Paper 5 ... 117
Part I
Thesis
3
1 I
NTRODUCTION
An increasing number of power plants in Scandinavia are changing from coal or oil to biofuel. In doing this, they receive an economical stimulus from their governments which have a sustainable and environment-friendly energy system as an objective. Biofuel consists mostly of woodchips and is delivered to power generating plants in containers transported by rail or road. At the site, the woodchips are weighed and samples are taken for the determination of their moisture content, (MC). The fuel is dumped in the fuel silo and transported on conveyor belts to the boiler.
MC and heat value are the most important quality parameters of the biofuel for a power plant, but they are also of interest to other industries, such as the pulp and paper industry. The reasons for measuring the MC and heat value are the following:
• For price determination • For control of the combustion
The price of biofuel today depends on the MC and both power plants and suppliers are interested in a method for determining payment that is both representative and rapid. Today, a few small samples are taken from the top of the container and weighed before and after a drying procedure which takes at least four hours, normally approximately twelve hours. It would be preferable if the whole bulk of biofuel in the container could be measured so that the price per container could be determined immediately. For this purpose, an instant value representing the MC of the whole bulk is required.
A high MC in the woodchips arriving at the furnace increases the fuel demand for the same power output. Energy is required to vaporize the water in the woodchips into steam, so that more energy must be supplied to the drying zone in the boiler. To reclaim this energy, some district heating (DH) plants lead the flue gases through a flue gas condenser. In the
4
condenser, most of the energy is transferred from the steam in the flue gas by heat exchange with DH water.
A sudden change in MC can lead to a sudden change in temperature in the boiler. If the temperature in the area around the over-fire air drops to below 800 °C, an incomplete combustion will occur, resulting in a high concentration of poisonous CO in the flue gas.
Rapid MC measurements are also desirable in the pulp and paper industry. The industry uses chips from stemwood as the basic raw material for its products, and in addition, as biofuel to provide energy. The woodchips are conveyed on a belt into the digester. The MC of the woodchips is of interest at this point for determining the charging of chemicals into the digester and for avoiding process disturbances. The work presented in this thesis, however, is mostly focused on the measurement of the MC of the biofuels supplied to power plants.
In this thesis, a measurement technique has been developed for measuring the MC of large samples of biofuel. The technique could be applied as in the following scenario, following the arrival of the biofuel at a power plant:
A truck arrives at the fuel reception installation at the power plant; the driver manoeuvres his vehicle onto the weighbridge and uncovers the containers. A radio frequency antenna, directed downward, is suspended above the weighbridge at a height of about five meters, clear of the truck. The driver waits briefly for the weight of the truck and its contents and the MC measurement of the biofuel to be registered. There is no danger to the driver from the measurement as the intensity of the radiation from the antenna is lower than that from an ordinary cell phone.
The fuel reception personnel now have the weight of the shipment and its MC. They inspect the shipment visually to determine the nature of the material. (This information also may be provided by the MC measurement equipment). They can then direct the truck driver to an appropriate destination in the fuel yard, or directly to the tipping bunker. Biofuel of inadequate quality for combustion can be mixed in the yard with other biofuel of a higher quality to obtain a more suitable mixture.
To accomplish this vision, a technique capable of measuring the MC of large quantities of biofuel instantly is necessary. Current techniques are insufficient since they are only capable of measuring the MC in small samples, or require the use of impractical, i.e. bulky and expensive, equipment. To meet the requirement of a fast measurement method that would provide an average value of the MC of a larger volume of biofuel,
5
the possibility of using radio frequency waves (RF) was investigated. (See also Paper I).
1.1 Problem formulation
This thesis investigates the possibility of making MC measurements on biofuel, applicable to the most commonly used types of biofuel. Furthermore, it considers which measuring method is best suited for measurements of large samples of biofuel.
As this thesis will show, RF measurements were found to be the most suitable method. Given this finding, a number of research questions related to RF and biofuel emerged, in particular the following:
• Which frequency range is most suitable for the measurement? • How do different biofuel materials affect the radio waves? • How does the MC of the biofuel affect the radio waves? • Which kind of data processing and model is able to compensate
for variations in such fuel properties as fuel bulk density, fuel particle density, MC and other unknownsystematic variations?
1.1.1 Scope
The biofuel materials used in this thesis were stemwood, GROT, bark, sawdust and residual woodchips. Other biofuel materials were not included in the samples.
The MC of samples of varying density has been measured. The density was varied by adjusting the volume of a single sample. The MC of samples of different weights but of the same volume has not been measured.
Any influence of inorganic substances in the biofuel on RF was not investigated.
The thesis focuses on measurements at the laboratory scale. Full scale measurements on containers arriving with fuel at the power plants were performed in the beginning of the project, but have been excluded from this thesis.
6
1.2 Thesis outline
This thesis is an aggregated thesis, the main part consisting of a number of previously published research papers (Part II). In addition to the appended papers, the thesis contains a part consisting of an introduction to the subject and a discussion of the contributions (Part I). Part I is organized as follows:
Chapter 1: Gives an introduction and background to the area of research for the appended papers, and also formulates the problem to be solved.
Chapter 2: This part defines the mathematical expressions and gives the theoretical background to the scientific areas discussed in the thesis.
Chapter 3: The contributions of the thesis are presented and discussed in relation to other results published in scientific literature in this chapter.
Chapter 4: Concludes this thesis.
Chapter 5: This chapter consists of a brief overview of future work which could be performed within this area.
7
2 T
HEORY
2.1 Biofuel
Biofuel is a mixture of woodchips, mostly from wood and wooden products, including bark, sawdust and felling wastes. Residual wood is also used. Bark is a residual from sawmills and the pulp and paper industry. Sawdust is a residual from sawmills. Felling waste is a mixture of branches, small trees, tops and needles. In this thesis, this material is abbreviated to GROT (the Swedish acronym for tops and branches)*. Another common biofuel is cultivated Salix (Willow) of which the stem and branches from different species of Salix, e.g., Viminalis L are used. (As a matter of curiosity, the generic name Salix was already used by Cato, d 149 BC.) Residual wood originates from broken pallets and waste from the demolition of buildings. Plastic and other foreign materials are common in the residual woodchips. Another common material is pure log wood. This material originate either from the wastes separated at sawmills, or as pulp wood, rejected as decayed or otherwise unsuitable as raw material for the pulp and paper industry. The different materials, except sawdust are chopped into chips, normally a few centimeters in length. Different biofuel materials can be seen in Figure 1.
8
Figure 1. Different biofuel materials. From the upper left to the right: Stemwood, sawdust, residual woodchips, GROT (softwood), GROT
(hardwood), bark.
2.1.1 Chemical properties of biofuel
As the greater part of biofuels originate as wood, this section focuses on the chemical properties of wood. The different tree-species and the different parts of trees differ in their chemical composition. The difference within trees caused by the uptake of inorganic chemicals is small compared with the chemical difference between the tree-species. The storage of harvested wood also affects its chemical composition, Jirjis and Theander (1990). Characteristics of the biofuel will influence the dielectric properties of the biofuel. This is further described in Chapter 2.2.2 in this thesis.
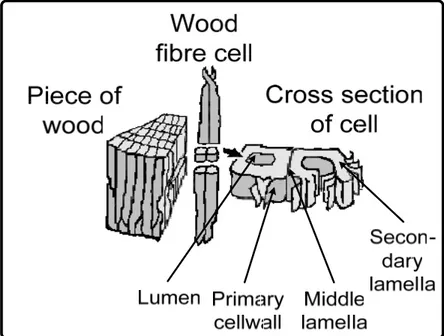
The inorganic content of biofuel remains as ash when the biofuel is burned. The concentration of inorganic substances in biofuel varies considerably with the harvesting time, the locality of the plants and treatment of the wood. Part of the inorganic substances consists of different salts which act as catalysts in the combustion but can also cause corrosion. Celluloses, hemicelluloses and lignins constitute the walls of the wood fiber cells. Cellulose is the main structural constituent of the plant cell walls. Hemicelluloses are closely related to cellulose but have shorter molecular chains than cellulose.
9
Figure 2. A wood cell taken from a piece of softwood is shown with permission from Ljungbom and Isaksson (1995).
The lignin macromolecule consists of aromatic units which harden and strengthen the cell wall. Lignin also occurs in the middle lamella. Extractive and other constituents of wood include hydrocarbons, alcohols, sterols, tannins and terpenes. Figure 2 shows a cross-section of the softwood cell.
It is in the combustion of the cellulose, hemicelluloses and lignin of biofuels that useful heat is generated.
2.1.2 Water in biofuel and moisture content definitions
The moisture in wood can be divided into bound and free water. Bound water can either be monomolecular or polymolecular. Monomolecular water is bound to the hydroxyl groups of the polysaccharides mainly by hydrogen bonding. Polymolecular water adheres to the monomolecular layer. When fibers absorb water, it is first bound in the cell walls themselves. When the cell walls are saturated, additional water absorbed by the wood fills the lumen.
Today, the MC is determined by the standard oven method of the Swedish Standards Institution (1997), in which a sample is weighed, dried
10
in an oven at 105 °C for normally 12 hours and then weighed again. The MC is then calculated as in Equation (1).
The literature gives different definitions of MC and in this thesis, is calculated on the basis of the wet sample according to Equation (1):
100
sample
wet
mass
water
mass
⋅
=
MC
[%] (1) Within wood science, the MC is frequently based on dry samples and isthen called the moisture ratio, (MR) calculated as in Equation (2):
100
sample
dry
mass
water
mass
⋅
=
MR
[%] (2)For measurements in soil, the MC calculated on volume fractions is frequently used and to avoid confusion, this parameter is denoted Λ, in this thesis and calculated as in Equation (3):
100
sample
wet
volume
water
volume
⋅
=
Λ
[%] (3)Both bound and free water are present in the biofuel presented in this thesis. The MC varies between different materials, and also because of the storage circumstances. In newly harvested Salix the MC is mostly around 50%, and in some bark-deliveries the MC can be over 65%. Residual woodchips can have a MC of 30% as they are mostly based on dried wood that has been stored outdoors. For log wood from sawmills, the MC can be below the fiber saturation point. At the fiber saturation point the cell wall holds as much water as is physically possible. This point occurs at a MR around approximately 30%, the equivalent of an MC of 22% (from Espling (1992). At an MC of more than 22%, the fiber lumen is partly or fully filled.
11
2.2 RF
2.2.1 RF definitions
To avoid confusion, expressions used in the following text are defined in this section. Most can be found in textbooks such as Cheng (1989), or Jackson (1998).
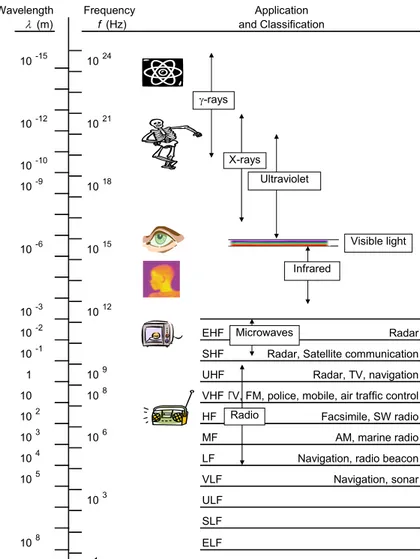
Electric and magnetic fields originate from charged carriers and their motion. The fields move away from their source only when the charged carriers accelerate. They are then designated electromagnetic waves. Electromagnetic waves travel at the speed of light, (c) and have different wavelengths, (λ) and frequencies, (f). Figure 3 show the electromagnetic spectrum divided into frequency and wavelength ranges on logarithmic scales according to application and natural occurrence. The electromagnetic waves of that portion of the electromagnetic wave spectrum generated by alternating current supplied to an antenna are referred to as radio frequency (RF) waves. The frequency of these ranges between 30 kHz and 1 GHz, with corresponding wavelengths between 10000 m and 0.3 m. They travel long distances in air and can traverse different media. Radio waves are reflected by metal surfaces, and are retarded and attenuated differently, depending on the media.
12 Wavelength Frequency 10-15 1024 10-12 1021 10-10 10-9 1018 10-6 1015 10-3 1012 10-2 EHF Radar
10-1 SHF Radar, Satellite communication
1 109 UHF Radar, TV, navigation
10 108 VHF TV, FM, police, mobile, air traffic control
102 HF Facsimile, SW radio
103 106 MF AM, marine radio
104 LF Navigation, radio beacon
105 VLF Navigation, sonar 103 ULF SLF 108 ELF 1 f (Hz) Application and Classification λ (m) γ-rays X-rays Ultraviolet Visible light Infrared Microwaves Radio
13
The dielectric properties of a material are its response when under the influence of an electric field and can be defined as its dielectric constant, (ε) and loss tangent, (tanδ). The relationship between those parameters is described in Equation (4):
)
tan
1
(
δ
ε
ε
ε
ε
=
′
−
j
′′
=
′
−
j
(4) whereε′ = real part of the dielectric constant
ε″ = imaginary part of the dielectric constant, or loss factor tanδ = dielectric loss tangent = ε″/ε′
Similar expressions exist for the magnetic properties of the material. However, the magnetic permeability, µ, is mostly equal to 1 for most materials except for ferromagnetic materials such as iron, cobalt and nickel. Biofuel seldom contains significant quantities of magnetic material and µ is therefore excluded from the expressions in this context.
The dielectric properties of a media are dependent on the density, temperature and the frequency in the media. Water has a high dielectric constant relative to other materials and the MC of a material therefore influences its dielectric properties to an appreciable degree.
When an electromagnetic wave is incident on the surface of a medium with dielectric properties different from those of the medium in which the wave originated, part of the incident energy is reflected and part is transmitted with refraction. The reflection coefficient (Γ) is the ratio between the incident and the sum of all the reflected energy, see Figure 4. When the electromagnetic wave is incident on a metallic surface, the reflection of the wave is total.
14 z x Hi Ei ki y 90 i kr2 kr1 Hr1 Er1 Er2 Hr2 Et1 kt1 Ht1 t1 r1
Figure 4. Plane wave is incident on a plane dielectric boundary. E is the electric field and H is the magnetic field. k is the propagation direction and θ is the angle. The subscripts i, r and t stands for inclining, reflected
and transmitted respectively.
If the dielectric constant of a medium is small, only a small fraction of the electromagnetic wave is reflected at the surface, and the main part of the energy continues to traverse the medium. A total reflection of the remaining wave arises if the wave meets metal. This reflection is stronger than the surface reflection as the main part of the energy has continued to traverse the medium. In this thesis, Γ is measured. In some cases, the attenuation (A) and the phase, (φ) are used instead of Γ. Γ is defined as in Equation (5):
15
=
Γ
∑
)
(
)
(
z
Ei
z
Er
i i (5)Ei is the incident electric field amplitude. The reflected electric field, Er,
is the sum of all signals reflected from different surfaces encountered by the radio wave. z is the direction of the propagation of the wave.
The attenuation of Et increases linearly with increase of the depth.
A and φ are defined as in Equation (6)-(7). A is mostly related to tanδ
and φ to ε′. Considering the propagation of the RF-wave in the time domain, ε′ will be related to the propagation time of the wave through the sample by the relationships in Equation (10) and Equation (11), these equation being a simplification of ε′ assuming that tanδ <<1. As tanδ increases with MC, this can also be expected for A in the experiments in this thesis. In cases in which tanδ << 1, medium 0 is air and the surface reflection is excluded from the signal, the relationships for A2 and φ2 reduce
to Equation (8) and (9).
|
|
log
20
⋅
10Γ
−
=
A
[dB] (6)π
φ
=
−
arg(
Γ
)
+
n
⋅
2
[rad] (7))
tan
'
(
log
20
10 2z
A
=
−
⋅
ε
⋅
δ
⋅
λ
π
[dB] (8)z
⋅
−
=
(
'
1
)
2λ
ε
π
φ
[rad] (9)The arbitrary integer n is often chosen for elimination of the phase jumps which occur when the phase rotates more than one revolution. The attenuation and phase in a material are related to its dielectric properties under the influence of an electromagnetic field.
16
If, instead, the time domain of a signal reflected from a surface is considered, and the tanδ is much smaller than ε′, εa, (the apparent dielectric
constant) can be used instead of ε′. εa is a function of velocity of the RF
signal, v, see Equation (10), and is related to ε′ and tanδ as shown in Equation (11). 2
)
(
v
c
a=
ε
(10))
tan
1
1
(
2
'
2δ
ε
ε
a=
+
+
. (11)From these equations, it can be seen that the A, φ and velocity also describe the dielectric properties of a material. The equations, while taking into account the wave nature of the radiation, only refer to internal transmission. They do not take into account the effects of reflections at boundaries, e.g. cavity walls.
A sample holder which also acts as a circular waveguide is used in this thesis. In a circular waveguide, a field of diverse frequencies is diffused in several directions, but always propagates forward in the direction of the waveguide until it reaches any reflecting surface. The radius of the waveguide determines the largest wavelength that can be propagated in a waveguide. This frequency is designated the cutoff frequency. The cutoff frequency for a rectangular waveguide is the width equal to half the wavelength frequency. For a cylindrical waveguide a rule of thumb is that the cutoff frequency can be approximately the same as that of a square section waveguide with side equal to the diameter of the circular section waveguide.
2.2.2 The influence of RF-waves on wood and water
The dielectric parameters for wood logs and biofuel differ in many respects. Wood is that subject of dielectric research most similar to biofuel and therefore, this part of the thesis will mainly focus on the dielectric properties of wood and water.
In comparison, wood is a much more homogenous material than biofuel. Biofuel consists of woodchips of sizes from fractions of mm to rags of length up to 20 cm (sometimes even longer), oriented in all directions. Its dielectric properties are assumed to be isotropic (independent of field
17
direction) as the direction of the fibers is randomly distributed and the wavelengths used are large in comparison with the rags in the fuel. The structure of biofuel is different from that of wood, but as the biofuel consists mostly of chopped pieces of wood and different wooden products, their chemical compositions are similar.
Under the influence of an alternating electromagnetic field, the dielectric properties of wood are determined by polarization processes resulting from the interaction between the molecules of the wood substance and the external field. As cellulose, hemicelluloses and lignin are polar polymers, both moist and dry wood are considered to be polar dielectrics. The polarization is a change in the arrangement in space of the electrically charged particles of the wood substance under the influence of the electric field, the wood acquiring an electric moment. Ash also affects the RF, but its effects have not been covered in this thesis. There are five types of polarization for wood according to Torgovnicov (1993):
Electronic polarization Ionic (atomic) polarization Dipole (orientation) polarization Interfacial (structural) polarization Electrolytic polarization
Depending on the field frequency, the contribution of the different polarizations varies. In the frequency range of 105 to 1010 Hz, the influence
of electrolytic, ionic and electronic polarization is hardly noticeable. Dipole and interfacial polarization play important roles in the polarization of wood at the frequency range used in this thesis.
2.3 Multivariate analysis
Multivariate data analysis and modeling is commonly used together with, for example, near-infrared spectroscopy. Spectral data such as reflection and absorption are then analyzed and modeled for a frequency range, instead of for a single frequency. The advantage of such a method is that different frequencies can be correlated with different characteristics. A disadvantage is that if some parameters in the measured process are changed, a new calibration must be performed. Non-systematic disturbances are difficult to model.
There are several different multivariate modeling techniques, such as partial least square (PLS), multiple linear regression (MLR), principal
18
component regression (PCR), and neural net (NN), Berthold and Hand (1999). PLS has been used within this thesis.
2.3.1 PLS
PLS is used to associate the information in the predictor set X, consisting of the experimental results, with the information in the response set Y, consisting of the reference data obtained by each measurement, Martens and Naes (1989). The objective is to be able to predict the values of Y for new observations from the predictors of these observations. A PLS model consists of different components that describe the covariance in the data set. The first principal component, PC, of the PLS model is a vector describing the maximum covariance direction in the X and Y data. The second component represents the second- largest source of variation in the data and is orthogonal to the first component in the XY-space. For detailed information about multivariate data analysis, see Esbensen (2000) and Wise and Gallagher (1998).
2.3.2 Validation
The models in this thesis are evaluated by the RMSEP-values (root mean square error of performance), which are measures of the average difference between predicted and measured response values, see Equation (12).
n
y
y
RMSEP
n i∑
=−
=
1 2 reference model)
(
(12)The methods in Paper I and the model in Paper IV are evaluated using the SEP which is a measure of the difference between the predicted and measured response values, excluding the bias, see Equation (13).
1
)
(
1 2 reference model−
−
−
=
∑
=n
bias
y
y
SEP
n i (13)19
Bias is also used in the evaluation of the models. The bias is the systematic difference between predicted and measured values, see Equation (14).
n
y
y
Bias
n i∑
=−
=
1 model reference)
(
(14)ymodel = the predicted value of the MC
yreference = the reference value of the MC
n = number of samples used in the calculation.
Independent test sets of samples have been used for the evaluation of the models except that the model for sawdust in Paper IV was qualitatively evaluated with cross validation. The aim of that paper was to find a correlation between the MC and the RF signals through the samples.
Cross validation evaluates the data by excluding selected samples in the model set and then building a model for the remaining. The model is tested using the samples excluded from the model. New samples are then excluded from the model set and a new model is built. This procedure is repeated until all samples in the model set have been excluded once. The root mean square error of this procedure is denoted RMSEC where C denotes calibration.
The lower the RMSEP (or RMSEC), the more accurate is the test set described by the model. RMSEP cannot be lower than the standard deviation of the reference method and it also contains the bias. RMSEP and bias have the same unit as the values they are calculated from; in this case percent, %.
21
3 D
ISCUSSION OF THESIS
CONTRIBUTIONS
The scientific contributions of this thesis to the subject of moisture content measurement with RF are presented here. The chapter summarizes the contributions. It also discusses the results obtained in relation to other related work within the area and includes a recapitulation. The contributions are:
• A concept for rapid measurement of the MC of a volume of biofuel has been developed. The research leading to this can be divided into four parts:
a. Methods suitable for MC measurements have been pointed out. The methods have been grouped by applications on flow and bulk measurements, (Paper I).
b. A measuring system for rapid measurements of sample quantities, larger than earlier published in scientific literature, has been developed, (Paper V).
c. A method for data processing of the RF signals reflected from a volume of heterogeneous material has been developed, (Paper II).
d. A proof of concept, using simulations and systematic experiments, (Paper III and IV).
• The variation in the reflection coefficient and the signal delay in relation to variations within biofuel material, biofuel bulk density and biofuel MC has been demonstrated, (Paper III and IV).
22
3.1 Concept for rapid measurements of MC of biofuel
In assembling the results and discussions in section 3.2-3.5 below, this thesis presents a new concept for rapid measurement of the MC of a large volume of the heterogeneous material biofuel suitable for use in industrial applications. The concept may also be generalized from measuring the characteristics of biofuel to other materials as well. The method has been designed for samples with a volume of around 0.1 m³, and the multivariate model used together with the equipment compensates for systematic variations within the samples. The measurement concept has been evaluated with systematically performed experiments showing close agreement between reference measurements and measurements with the concept developed.
3.2 Methods for measuring the MC of Biofuel
3.2.1 Contribution
A review of the different possible methods for rapid measurement of the MC of biofuel was initiated to determine that alternative to the standard method which would be most suitable. The review describes and compares the methods, from the user perspective. The methods are grouped as two types; measurements applied to a flow of biofuel and measurements applied to volumes of approximately 40 m³ of biofuel.
Brief descriptions of different methods suitable for fuel characterization are presented below. It was concluded that RF was the most suitable method for the measurements in this thesis. A more detailed discussion and further references to the issue in the literature are included in Paper I.
3.2.2 Results and discussion
The value of biofuel is determined by the MC of the fuel on its arrival in containers at the power plant. The containers contain approximately 40m3
of fuel, this possibly including cavities, metals and other heterogeneities. The MC measurement is required to give an average value for the fuel.
Methods for fuel characterization reported in the literature include dual X-ray, indirect calculations from the MC of the fluegas, near-infrared spectroscopy, radio-frequency spectroscopy, microwave measurements and nuclear magnetic resonance.
The photoelectric absorption of X-ray radiation is affected by the carbon-oxygen content of the sample material. An X-ray rig sends X-rays
23
through the material at frequencies in the X-ray range (see Figure 3). A detector registers the attenuation of the signal. The measurement is relative, and calibration is necessary. The method has been tested on biofuels in Nordell and Vikterlöf (2000), the rig then consisting of hospital instruments. Disadvantages of the method are that the penetration depth of the X-rays into biofuel has not been investigated and the hazards associated with the method require security arrangements.
The MC in biofuel can be indirectly calculated from the MC of the flue-gas. The calculations are based on measurements of moisture at different point in the process, CO content and unburned fractions from fly ash. The disadvantage is that the calculations are made after the fuel has been burned in the furnace.
When a material is illuminated by infrared radiation, (IR), some of the radiation is absorbed and some is reflected. An IR-spectrum for a material can be obtained by measuring the reflection from a surface. The spectrum is determined by, inter alia, the chemical composition, the density, and the MC of the material. Near-infrared radiation, NIR, penetrates further into the sample than IR (a few millimeters) and is therefore more suitable for biofuel. Both IR and NIR are surface measurement methods and can only be used on biofuel conveyed on a belt in a full scale application.
Hydrogen atoms behave like small magnets. They therefore align themselves in relation to an applied magnetic field. To move atoms from one alignment angle to another requires a specific amount of energy which depends on the strength of the magnetic field and on the frequency of field alternation. The movements can be registered by nuclear magnetic
resonance spectroscopy, NMR. The drawbacks with NMR are that the
sample must be free of ferromagnetic materials such as ores and metals because these will seriously damage the magnet shim, coils and probe during the measurement. NMR has been tested for MC control in the timber industry and is able to make measurements in planks, but if volumes of 40 m3 are to be penetrated, this method requires large coils and its use
can be hazardous in use, Rosenberg et al. (2001).
Biofuels are polar dielectrics. This means that, under the influence of an alternating electromagnetic field, the electrically charged particles in the material are rearranged as the field alternates. This fact is utilized in
microwave measurements and in RF. The density, mass and temperature
of the material affect the signals. Microwaves have a penetration depth of approximately 15 cm and are more suitable for small samples or a conveyor belt application. RF has a larger penetration depth than microwaves and is suitable for measurements of large sample volumes. RF is a promising
24
method for the measurement of the MC of bulks of biofuel, due to its ability to measure large samples.
Apart from the work presented in this thesis, there are no references in the relevant literature to measurements of the MC of large samples of biofuel using RF.
On the basis of the above, it was decided to focus this thesis on RF measurements.
3.3 Measurement system
3.3.1 Contribution
An RF-measurement system is described in Paper V. The system is designed for a detection of both the surface and bottom reflection of the signal. Simulations of the reflection characteristics of the empty waveguide and the waveguide containing samples of sawdust are shown and compared with measurements performed using frequencies between 310 and 1300 MHz. The reflection in both the frequency and time domains are evaluated. No commercial waveguide of 0.1 m³ or larger has been found in scientific literature.
3.3.2 Related work
For more information with respect to RF systems for the measurement and data processing methods described in this thesis, it was necessary to extend the literature survey to include RF and microwave measurements on food grains and soil. Grain is similar to biofuel, a granular material containing carbohydrates. The MC is low, usually below 20%, while the MC for biofuel is mostly over 30%. Soil, however, is a mixture of smaller particles than biofuel, containing sand and stones to a much greater extent. The volume fraction of water in soil can be much greater than that in biofuel.
There are several techniques using microwaves for MC measurement in the agricultural and wood science area. The devices used include coaxial capacitors, capacitance bridges, waveguides, resonators, coaxial transmission/reflection, microstrip antennas and horn antennas in free space. Such equipment is frequently used for measurement of the resonant frequency and quality-factor (Q-factor), measurement of the attenuation and phase shift, time domain reflectometry (TDR), or pulsed radar reflectance, Curtis (2001), Torgovnicov (1993), Lawrence et al. (1998), Cho et al.
25
(1999), Okamura and Zhang (2000), Trabelsi et al. (1998), Ben Slima et al. (1999), Topp et al. (1980).
For log wood, the Q-factor method has been used for frequencies above 1 MHz and capacitance probes for more wet specimens, James (1974). Torgovnicov (1993) recommends the use of a capacitance bridge for frequencies below 100 Hz and a capacitance bridge or resonance methods for frequencies above 100 Hz. Above 300 MHz, a resonator or waveguide is recommended. Another method used on wood is described by Anagnostopoulou-Konsta and Pissis (1998) who used thermally stimulated depolarization currents (TSDC). This method is not within the two main groups and is a complicated and time-consuming way to determine ε′.
To find a suitable measuring technique for the measurements in laboratory scale (mimicking a full scale application), the methods above are discussed here in the context of being applicable in full scale measurements (using containers of 40 m³).
As the fuel is relatively compact, devices for inserting a coaxial capacitor or capacitance bridge through two meters of biofuel are impractical (compare with the sampler at Söderenergi, Berg et al. (2005)). The same difficulty is encountered when using commercial TDR equipment. A resonator together with the Q-factor method should be possible to use, having a metallic lid on the top. Using a lid would require the mechanical means for smoothing the biofuel surface. Another disadvantage of the Q-factor and resonator method is that, without changing the dimensions of the cavity, it can only give information about the permittivity parameters at certain discrete frequencies. The containers differ in size, which makes the Q-factor method difficult to apply in full scale measurement operations. It would be preferable to use free space antennas above the container, utilizing the container as a waveguide. Therefore, this technology is also used for the small scale measurements in this thesis.
3.3.3 Results and discussion
The measuring system developed within the work on this thesis was special designed for RF measurements to be performed on large samples with a volume around 0.1 m³ and included lifting equipment. The system as it is today is not intended for an on-line application.
The advantages of the system are that the MC content of a sample of biofuel is obtained within seconds. Large samples can be measured. The system mimics a full scale system suitable for use at a power plant. The main uncertainty with a full scale system application is that the signal is
26
disturbed by reflections from the surrounding walls, and therefore a calibration of the containers is required. A new model with different biofuel materials must be built for the large scale system.
A more detailed description of the measurement system can be found in Paper V.
Electromagnetic waves are scattered when they strike a surface with dimensions of approximately half the wavelength. In our case, most biofuel pieces have dimensions less than 0.15 m. The upper limit of the measuring frequency range is therefore 1 GHz. The lower limit is set by the cutoff frequency of the sample holder (308 MHz). Within these physical limits, different frequency ranges are more or less preferable when measuring water as ice, bound water or free water, (see Chapter 3.6.2).
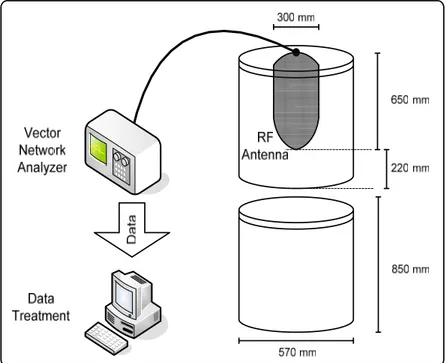
The measurement system is shown in Figure 5. A vector network analyzer, (VNA) Agilent 8712 ET, sweeps frequencies between 310 MHz and 1.3 GHz with 1601 points. The antenna is a logperiodic dipole antenna. It was over-specified for the application being selected during a period in the project work when the design of the measurement rig was not fully developed. Two steel barrels are selected for the measurement set up. The first reason for using metal cylinders is that they shield the measurements from environmental disturbances. The second reason is that when connected, they act as a waveguide giving much more distinct reflections from the sample than if e.g. a plastic holder with metal bottom had been used. (The theory around a wave incident on a surface having dielectric properties other than the medium in which the wave originates can be seen in Figure 4.) The upper barrel is suspended, with its open end downward and the antenna, directed downward, suspended from what is then the roof of the barrel. Microwave absorbers are mounted in the roof of the upper barrel to reduce reflections from the roof. The lower barrel acts as a sample holder, positioned under the antenna and fixed to the upper barrel with clasps. When connected together, the barrels act as a waveguide with a short circuit at the far end. The sample holder has a diameter of 570 mm and a height of 850 mm and the upper barrel has a diameter of 570 mm and a height of 870 mm. The distance between the tip of the antenna and the surface of the sample is approximately 600 mm.
27
Figure 5. The measurement system: The upper barrel shields the antenna and the lower barrel contains the sample. The two barrels are connected
during measurements. The network analyzer is a HP 8712 ET. Measured and simulated signals from the empty waveguide differed as reflections in the waveguide disturbed the measurements. Before the actual measurements were performed, three known wave-guide standards were measured: short, offset short, and load (SOL calibration). After the application of a SOL-calibration to the data, the simulated and measured frequency and time domain signals agreed sufficiently but distortions from higher order modes appeared after 800 MHz in the frequency domain. The surface and bottom reflection of the signal can be detected distinctly in the time domain and it was concluded that a SOL-calibration of the waveguide was necessary to detect the bottom reflection and to avoid disturbances. As higher order modes was excited above 800 MHz the measuring frequency range was set from 310 MHz to 800 MHz in the following work. It was also concluded that this frequency range was adequate for detecting the surface and the bottom reflections in the time domain.
28
3.4 Data processing
3.4.1 Contribution
The processing of data from the measurement procedure is described in Paper II. RF signals applied on heterogeneous materials can be considered by a method where a selected time range of the signal is modeled with PLS. This method gives better results than others commonly referred to in literature.
3.4.2 Related work
The relevant data processing reported can be separated into two main groups. In the first, the signal travel time (TDR) is evaluated and modeled. In the second, the attenuation and phase shift are modeled in the frequency domain.
Measurements on grain have been performed by, i.a. Kraszewski and Stanislaw (1976), Kraszewski et al. (2000), Nelson et al. (2000), Trabelsi et al. (2000) and Trabelsi et al. (1998). In these studies, it is mostly the frequency domain which is considered and the attenuation and the phase shift of the signal are measured. RF is also used for detecting different layers in soil; see e.g. Topp et al. (1980). It has also been studied by e.g. Calla et al. (1999), Curtis (2001), Mojid et al. (1998) and Liou and England (1996). In these studies, the time domain is frequently evaluated. Broadband measurements of certain characteristics of food substances, utilizing principal component analysis (PCA) has been performed successfully by Daschner et al. (2000a) and Daschner et al. (2000b).
The “Topp-function” is widely used within soil science, εa is calculated
from the velocity v using Equation (11) εa is related to the volume fraction
of the moisture content, Λ, through a third degree polynomial fit. This function is described in Equation (15).
3 6 2 4 2 2
10
3
.
4
10
5
.
5
10
92
.
2
10
3
.
5
a a aε
ε
ε
⋅
⋅
+
⋅
⋅
−
⋅
⋅
+
⋅
−
=
Λ
− − − − (15) The coefficients are calculated from a least squares fit of εa for soilsamples. The function was almost independent of structure, salt content and temperature variations between 0 and 30°C, Topp et al. (1980). This relationship has been found to have broad applicability, describing the Λ of
29
e.g. iron-rich volcanic soils, Grantz et al. (1990), the unfrozen water content in frozen soils, Oppenheim and Schafer (1989) Patterson and Smith (1981), Patterson and Smith (1985) and crushed concrete, Van der Aa and Boer (1997). The application of the function depends on ensuring that the equation used is valid for the soil and the application; otherwise a recalibration of the equation is recommended.
A relationship between attenuation and phase shift for measuring the MC of grain was published already in 1976, Kraszewski and Stanislaw (1976). It was shown that it was possible to measure the MC with the function shown in Equation (16),
)
(
)
(
1 2 3 4 2 4a
a
A
a
a
a
Aa
MC
−
−
−
−
=
φ
φ
(16) in which the coefficients a1 – a4 are determined by a least squareapproximation. At that time, the speed and power of computing was much lower than it is today. The continued development in the area is presented by Kent (2000), who concluded that if the computing power and speed commonplace now had been available at that time, it would have been implemented widely.
It is possible that the attenuation and phase shift could be used for the measurements in this thesis. However, as the reflected wave measured is a superposition of the surface and bottom reflections, it is not possible to obtain an average value of the whole sample without excluding the surface reflection by using the time domain.
TDR is another possible method. The travel time through the sample is either directly correlated with the MC in the sample, or used for calculation of ε′. However, the travel time and ε′ are not only dependent on the MC (see section 3.6) and the accuracy of this method is therefore inadequate. This problem applies not only to the TDR method but also to the method based on measurement of the attenuation and phase shift.
3.4.3 Results and discussion
Reflection data from the frequency range 310 to 800 MHz was used. The lower frequency limit was chosen to be just above the cutoff frequency for the fundamental wave-guide mode. The first higher order mode that interacts significantly with the antenna appears at 890 MHz and hence the
30
upper frequency limit was chosen well below that frequency, (see also Paper V).
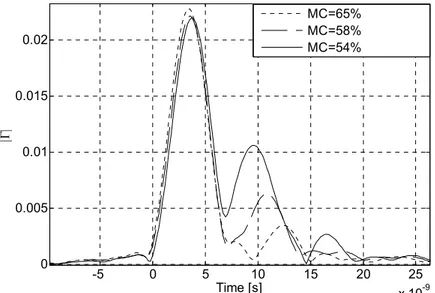
The signal from the VNA was the linear complex reflection coefficient, Γ′. The reflected wave measured is a superposition of the surface and bottom reflections. The data was transformed into the time domain using the inverse Fourier transform, IFFT. A Kaiser window, Oppenheim and Schafer (1989), was applied to the frequency data to minimize the effects of transients at the beginning and end of the data series. Typical values of |Γ| in the time domain for three samples of GROT with different MC’s are plotted in Figure 6.
The time domain signal range beginning at the time for the bottom reflection and ending when only noise remained was modeled to obtain a representative value of the average MC in the samples. The models were built using the PLS method. This signal had passed through the whole sample. If only the first reflection had been used, it would have represented the MC at the surface of the sample. The bottom reflection is the second peak, starting after 0.6⋅10-8 s. |Γ| from the bottom was selected for the time
span from 0.6⋅10-8 to 3.5⋅10-8 s. More information about the detection of the
bottom reflection and limitations in the frequency domain are given in the report by Franzon (2004) and Paper V.
The results show that the PLS-model of the signals in the time domain describes the test set more accurately than any of the other models. The model by Kraszewski and Stanislaw (1976) bears no relation to the data. The primary reason is that too many variations within the biofuel are to be compensated for at only one point in the frequency domain.
It was shown in Paper II that the PLS-model in the frequency domain had poorer correlation with the MC than the PLS-model in the time domain. The last result was surprising as information about the attenuation and shifts in frequency originating from a corresponding shift in time are visible in the frequency domain. Further work will address the issue making multivariate models of both the attenuation and the phase shift in the frequency domain.
It was difficult to make the biofuel absorb more water than to a MC of 70% or a Λ of 37% using the methods described in Paper II. This can be compared with soil having Λ up to 60%, (Topp et al. (1980)) which is very hard to reach for biofuel. As the Λ-range for biofuel had a more narrow range than for soil, this might be the reason why a one degree polynomial was sufficient for the equation of Topp in Paper II.
The performance of the model by Topp et al. (1980) was not as good as that of the PLS-model in the time domain. The reason might be that the travel time was distorted by other variations within the measurements.
31 0 0.5 1 1.5 2 2.5 3 3.5 4 x 10⁻⁸ 0 0.005 0.01 0.015 0.02 Time, [s] |Γ | MC = 37% MC = 51% MC = 61%
Figure 6. |Γ| in the time domain is shown for three GROT samples with the same dry density and temperature but different MC.
3.5 Proof of concept
3.5.1 Contribution
The concept has been evaluated using simulations (see section 3.3.3) and by modeling systematically performed experiments (Paper IV and Paper III). It is shown in Paper III that it is possible not only to model the MC in sawdust and measure the MC in GROT and residual woodchips, but also to measure the MC in five different biofuel materials; bark, sawdust, GROT, residual woodchips and logwood using one single model for all these materials. The materials differ significantly in particle sizes, pre-treatment and the part of the tree used. The model also functions with mixtures of GROT and both residual woodchips and bark. A short description of the results from the modeling is discussed below.
3.5.2 Results and discussion
The models presented in this thesis are multivariate models developed for heterogeneous materials. There is no model reported in literature by
32
means of which the MC in biofuel is determined using RF measurements and statistically or physically modeled. The advantage of using a multivariate model in comparison to others is that it compensates for systematical disturbances.
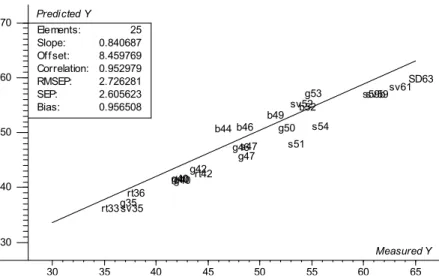
The results in this section can also be found in Paper III. In this section the final result from a model built on samples from sawdust, (SD or s), GROT, (g), bark, (b), stemwood, (SV) and residual wastes (RT) is presented, see Figure 7. For other models developed within this thesis, see Paper II, III and IV. A test set of 25 independent samples was used for the evaluation. In Figure 7, each sample in the test set is marked with the abbreviation for the mixture and the MC. During the measurements for the model calibration set, the sample holder was emptied between the measurements and refilled again with the same sample. This procedure was repeated three to five times to evaluate the deviation within one sample to permit the inclusion of this deviation in the model. The test set consisted of samples on which only one measurement was performed. Average values were not obtained from repeated measurements.
The models were built on centered data, without weights in X and Y. The MC calculated using the PLS model is given on the y-axis and reference values of the MC are given on the x-axis. The model is calibrated for MC’s between 34 and 72% and the regression is plotted in the figure. The regression line shown in the figure has an offset of 8.5. The RMSEP for the model is 2.7 and its bias approaches 1. Three principal components (PC’s) were used in the model. It can be seen in Figure 7 that the model calculated the MC of some fuels more accurately than that of others. For example, the MC of GROT is measured accurately whereas the values for bark and sawdust are biased from the target line. In this case, the GROT in the test set was actually a mixture of residual woodchips and GROT, while only GROT without admixture was used in the model set.
The accuracy of the reference method varies between different materials and also with different storage times as the biological activity in the sample over time makes some parts dry and others wet. The differences between materials can be explained by the different parts of the wood absorbing water to different degrees. This must be considered when preparing reference samples and a thorough mixing is necessary. The standard deviation for the MC reference measurement on sawdust during these experiments was estimated to be 0.22 as compared with the estimated 1.16 for stemwood. The average standard deviation for the MC reference method on biofuel was estimated to be 1.2% and this value is included in the RMSEP for the model.
33 30 40 50 60 70 30 35 40 45 50 55 60 65
one of each tes…, (Y-var, PC): (MC ref (%),3) g35 g40g42 g47 g46 g50 g53 g40 b52 b49 b46 b44 s47 s51 s59b s54 sv35 sv52 sv59 rt33 rt36 rt42 rt40 SD63 sv61 Elements: Slope: Offset: Correlation: RMSEP: SEP: Bias: 25 0.840687 8.459769 0.952979 2.726281 2.605623 0.956508 Measured Y Predicted Y
Figure 7. Evaluation plot of the MC of five different biofuel materials. The predicted values are shown on the y-axis and the reference values on the
x-axis.
Samples of different volumes and at different temperatures were used in the experiments. No improvements were found in a model with constant volume.
3.6 The interaction between RF and biofuel
3.6.1 Contribution
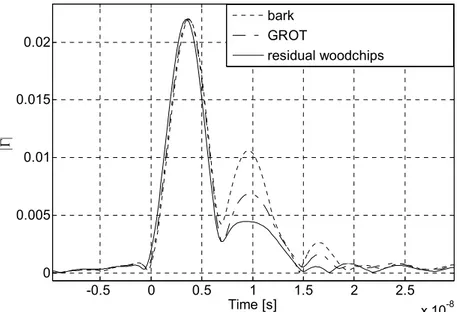
The interaction between RF and biofuel has been demonstrated as part of the work described in this thesis (Paper IV and III). Biofuel, actually used at power plants has been used in the experiments. There are no reports in literature on the interactions between biofuel and RF. The papers investigate how the different biofuel materials affect the reflection coefficient and the delay of the radio waves in the time domain. It is shown that the material density affects the delay of the surface reflection but not that of the bottom reflection in measurements of the whole sample. The material density, however, does attenuate the reflection coefficient of the
34
whole sample but not that of the surface reflection. An increasing MC both attenuates the reflection coefficient and causes a delay.
3.6.2 Related work
When RF-waves pass through wood, they are both attenuated and shifted in phase. The attenuation and phase shift are related to the dielectric constant and loss tangent of the material. The dielectric constant and loss tangent differ in different wood species and therefore also the attenuation and phase shift.
The study of the electrical properties of wood goes back to the early 1900’s when e.g. Clark and Williams (1933) determined the specific resistivity of various samples of wood. The dielectric properties of wood have been studied in more recent years by e.g. Torgovnicov (1993), James (1974) and Anagnostopoulou-Konsta and Pissis (1998) among others.
ε′ and tanδ for Douglas fir, oak and different qualities of hardboard are examined for frequencies between 20 Hz to 50 MHz and temperatures between -20°C and 90°C, James (1974). The variations in ε′ and tanδ for wood are listed with frequencies between 10 kHz and 100 GHz, varying density and MR, and a temperature range between -20°C and 90°C, Torgovnicov (1993), Appendix 3. It can be seen that the dielectric properties differ between woods having different densities. Wood with a density of 400 kg/m³ (e.g. white poplar, Populus alba) has an ε′ of 16 and a tanδ of 0.16, while wood with a density of 700 kg/m³ (e.g. English oak, Quercus robur) has an ε′ of 26 and a tanδ of 0.28. (In the example the MC is 50%, the temperature is 20-25°C and the frequency is 100 MHz.)
ε′ and tanδ are frequency dependent. It can be concluded that ε′ for bound and free water in wood follow the same pattern when plotted versus the frequency (Torgovnicov (1993), pp. 85). The influence from free and bound water on tanδ is quite similar in the frequency range between 1 MHz and 10 GHz (Torgovnicov (1993), pp. 99). Henry et al. (1988) shows the frequency dependence of ε″ on frequency for bound and free water in cellulose. They show that bound water affects electromagnetic waves mostly between 5 kHz and 500 GHz and free water mostly over 5 MHz. The divergence can be explained by the result from Torgovnicov (1993) being from wood and the result from Henry et al. (1988) being from cellulose.