JÖNKÖPING UNIVERSITY
D e t e r m i n a n ts o f S w e d i s h a n d
G e r m a n F D I
The case of Baltic and CEE Countries
Paper within BACHELOR THESIS IN ECONOMICS
Author: THOMAS GUSTAVSSON
SERGIU COCIU
Supervisors: Professor ULF JAKOBSSON PhD candidate DANIEL WIBERG Jönköping FEBRUARY 2007
Bachelor’s thesis in economics
Titel Determinants of Swedish and German FDI– The
case of Baltic and CEE Countries
Authors: Sergiu Cociu, Thomas Gustavsson
Supervisors Professor Ulf Jakobsson
PhD candidate Daniel Wiberg
Date February 2007
Keywords: FDI, the Baltic countries, CEE, Sweden, Economic Freedom, R&D, Trade Balance, Wage level, Neighbor dummy.
Abstract
This thesis tries to determine some of the driving force behind Swedish foreign direct in-vestments into the Baltic counties. The analysis is performed in three steps, first we analyze global FDI into transitional economies, and afterwards we look at Swedish FDI and com-pare it with German FDI. The determinants examined are index of economic freedom, R&D intensity, trade balance, wage level and proximity. The analyzed period is form 1995 to 2005. The analysis use data on the following transition countries Latvia, Lithuania, Esto-nia, Poland, Hungary, Czech Republic, Slovak Republic, SloveEsto-nia, Croatia, Romania and Bulgaria. The results show that the determinants vary across the countries. The motives of Swedish and German investors differ. Thus, for Swedish investors R&D, economical free-dom and trade balance are the influencing factors, but for Germany only trade balance and wage level are important. The conclusion is that different determinants triggers foreign di-rect investment in transitional economies in different ways.
Table of Contents
1 Introduction ... 1 1.1 Purpose ...1 1.2 Method ...2 1.3 Background ...2 1.4 Outline ...3 2 Theoretical background ... 32.1 Previous studies on the determinants of FDI...3
2.2 The OLI paradigm...5
2.3 Determinants of FDI ...6
2.3.1 Market size ...7
2.3.2 Unit labor cost ...7
2.3.3 Economic freedom...7
2.3.4 Transportation costs ...8
2.3.5 Currency valuation...8
2.3.6 Research and Development intensity ...8
2.3.7 Net exports ...9
3 Data and method ... 9
3.1 Data...9
3.2 Method and Variables...10
4 Regression analysis ... 11
4.1 Total FDI into CEE countries ...11
4.2 Swedish FDI into CEE countries...12
4.3 German FDI into CEE countries ...13
4.4 Discussion ...14
5 Conclusions ... 16
5.1 Further studies ...17
Tables
Figure 1.1 Inflow of FDI .……….…..……2
Table 3.1 Definition of each variable and the expected sign …………...10
Table 4.1.1 Summary statistics: Total FDI into CEE ………...12
Table 4.1.2 Regression results: Total FDI into CEE………...12
Table 4.2.1 Summary statistics: Swedish FDI into CEE………..….. ...13
Table 4.2.2 Regression result: Swedish FDI into CEE ………..…. ...13
Table 4.3.1 Summary statistics: German FDI into CEE ……….... ...14
1 Introduction
During the last 10-15 years the flows of foreign direct investments (FDI) have in-creased worldwide. Developed economies attracted the biggest flows of FDI and only about one fifth was hosted by developing economies. Only 2 percent of the global FDI went to (CEE) Central and Eastern European countries (including the Baltic countries). Nevertheless, at the beginning of 1990s former socialist countries had almost no FDI stock and that is why subsequently they have experienced a dy-namic and large increase of inward capital flows (Reiljan, Reiljan & Andersson 2001; Brada, Kutan, Yigit 2006).
According to Ass and Beck (2005) the compatible economic transition can not oc-cur only by using all national resources but there is also a need for foreign invest-ments. In this context the long-run sustained economic growth of an economy is basically assumed to be influenced by large-scale diversified investments. Therefore cross-border capital flows are an important issue in the transition process (Mer-levede, Schoors, 2004).
FDI have a different effect compared to direct lending or portfolio investments as they are less reversible and serve as an access channel to contemporary technologies and management, create national investment market, raise efficiency and expand output, stabilize macroeconomic fundamentals, solve social problems specific to transition period (Ass and Beck, 2005).
Thus, the industrial and economical modernization of post-socialist Eastern Europe and the Baltic countries was possible to a big extent due to the big inflow of FDI. The Baltic countries have one of the highest growth rates in the EU and are among the most fast growing economies globally. Investors prefer Baltic countries for sev-eral reasons like EU membership, financial and political stability, low production costs, highly skilled and cheap labor force, excellent infrastructure, proximity to big markets (geographic position), potential market growth, investment climate (Andersson 2003).
Although there are different trends and patterns of FDI into CEE countries, com-panies concentrated their investments in particular countries. There is an evident re-gional character of investment flows like for example Scandinavian companies ac-count for the biggest share in FDI flows into the Baltic States, the same as German companies concentrated their investments into the Czech Republic, Slovakia, Po-land and Hungary (Lönnborg, Olsson, Rafferty 2003).
1.1 Purpose
Sweden was ranked number ten in outward FDI performance in 2005 by United Nations Conference on Trade and Development (based on country’s share in global FDI outward and GDP) therefore Sweden is among top ten investors worldwide. In Europe Sweden is among the first five biggest foreign investors. The flow of investment can be assumed to follow cultural, historical or just pure economical motivation.
This thesis will examine the determinants of Swedish and German FDI into the Bal-tic and CEE countries from the host country point of view. We are interested in the
host country determinants as Sweden is the biggest investor in Estonia and Latvia and second in Lithuania after Denmark. Moreover, the Baltic countries attracted the highest share of Swedish FDI among all CEE countries during the period studied. We will focus our attention mainly on economic determinants of FDI as they are the most important ones (Sauvant et al, 1998).
1.2 Method
This study will look upon Swedish and German FDI flows to CEE, as well as we will try to prove that proximity to certain countries has a positive impact on FDI as generally neighboring countries have more intense economic, political, cultural and personal relations (Buch, Kleinert, Toubal 2003). The study will use the OLI Paradigm to explain the determinants.
1.3 Background
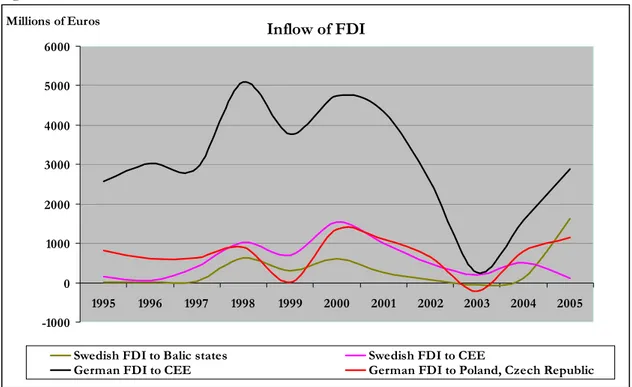
General picture of the dynamics of Swedish and German FDI into CEE: Figure 1.1 Inflow of FDI -1000 0 1000 2000 3000 4000 5000 6000 1995 1996 1997 1998 1999 2000 2001 2002 2003 2004 2005 Millions of Euros
Swedish FDI to Balic states Swedish FDI to CEE
German FDI to CEE German FDI to Poland, Czech Republic Source (UNCTAD)
Figure 1.1 shows the evolution of the German and Swedish FDI during the ana-lyzed period of time. As shown, the FDI flows are volatile. But analyzing the abso-lute values of FDI the following can be concluded: Swedish FDI to the Baltic coun-tries increased from 21,67 to 1618 millions of euros over the analyzed period while the FDI to the other CEE countries decreased from 164,29 to 116,74 millions of euros by the end of 2005 (but at the same time for example in year 2000 FDI amounted an impressive 1534,6 millions euros which represent a more than 900 per cent increase in FDI outflows). German FDI flow to CEE increased with only 12 per cent by the end of 2005, while the FDI outflow to Poland and Czech Republic
increased by an impressive 40 percent. Over time both Swedish and German out-ward FDI increased with a lot of swings.
1.4 Outline
The following section will describe previous studies of determinants of FDI and the OLI paradigm. Special attention will be focused on the determinants of FDI. In section 3 the regression model and the variables are presented. Then in section 4 the results are presented and analyzed, together with a discussion of the results. The final section 5 presents the findings of the study.
2
Theoretical background
In this section we will present some previous theoretical research on international direct investments. Afterwards we will examine the determinants of foreign direct investments us-ing Dunnus-ing’s eclectic (OLI) paradigm. In the end of the section we analyze the economic determinants of FDI namely: market size and structure, wages, index of economic free-dom, distance costs, home currency exchange rate stability, R&D intensity and net exports.
2.1 Previous studies on the determinants of FDI
The main theories explaining international investments started to appear in 1960s. Certain theories can be used for the analysis of the evolution and development of FDI both at macroeconomic and microeconomic level (Marinova and Marionov, 2003).
The industrial organization theory and international trade theory are the corner stones explaining the development of the theory of international production. Hymer initiated in the 1960 the study on companies expanding their production interna-tionally based on an industrial organization approach. Afterwards, in the mid-1970s three attempts were made to illuminate the activity of multinational companies. Thus, based on microeconomic or behavioral explanations appeared the internaliza-tion theory of multinainternaliza-tional companies (MNCs) and the eclectic paradigm. At the same time there was a macroeconomic approach on FDI, but it was explaining only the advantages of locating the production facilities abroad, missing the key reason-ing motivatreason-ing the companies to make international investments (Tøndel 2001). Hymer was the pioneer economist to differentiate between portfolio and direct in-vestments. In his studies Hymer emphasizes both types of investments in terms of management and evolution over time (Tøndel 2001). FDI were considered as activi-ties undertaken by monopolistic companies to achieve control over the foreign mar-ket. Consequently if a firm possesses special advantages (technology or innovation) resulting from market imperfections, which requires its own control it is unreason-able to license or sell its technology. Instead the firm transfers all the economical ac-tivities abroad (Du Pont 2000). In the context of CEE, these theories can be used by host country and firm to assess the investing company’s advantages (Marinova and Marionov, 2003).
In the same decade (1966) a theory on FDI supported by the product-life-cycle was developed by Vernon. Vernon focused on the idea that if a firm is wishing to mini-mize costs it would locate its production plants in a low-cost country (Tøndel 2001). Implicitly, Vernon assumed that developed technological capacities and lower pro-duction costs are the competitive advantages that will lead to geographic realloca-tion of producrealloca-tion to host countries rather than selling or licensing its products to local firms (Marinova and Marionov, 2003).
According to internalization theory, companies engage in international production as a result of market failure which gives rise to ownership advantages (Tøndel 2001). Thus firms will engage in FDI when transaction costs of export of intermediate goods are higher than the costs of company’s internal transactions (Tøndel 2001; Du Pont 2000). As a result the firm is avoiding time lags, bargaining and buyer un-certainty. Externalities in the goods and factor markets are the driving factors be-hind the internalization (Moosa 2002).
The general framework modeling and explaining foreign company’s production un-dertaken by a country’s own enterprise and the home-country production owned by foreign enterprises is included in the eclectic theory developed by Dunning (1977), also called OLI paradigm. Dunning’s eclectic theory is explaining how FDI can arise in the presence of a combination of ownership advantage according to industrial or-ganization approach together with location advantage based on production cycle the-ory, and internalization advantage from internalization theory (Du Pont, 2000).
The comparison of costs and benefits of producing in different locations can be done by macro theory of FDI. Therefore at the macroeconomic level FDI flows are functions of difference between the desired stock at time t and initial stock at time
t-1 in a given foreign location. And the main dependent variable explaining the
sired capital stock is the profitability of the company. The level of technological de-velopment, human capital and business environment development are the depend-ent variables explaining profitability of production in any particular location (Tøndel 2001).
Further, Merlevede and Schoors (2004) made a thorough analysis of the inward FDI in transition economies (CEE countries including the Baltic Countries) analyzing the categories of determinants: the ones according to economic theory, transition spe-cific determinants, and those related to regional integration. Empirical results showed a strong positive impact of the market potential, relative risk, relative GDP per capita (significant only for CEE and Baltic countries), relative unit labor cost (transitional determinant) as well as endowment with natural resources on FDI in-flow.
Ass and Beck (2005) observed FDI inflows for 27 countries, including post-Soviet and Eastern European countries, analyzing the relationship between FDI and coun-try risk. Notably, FDI inflow and GDP per capita indicates negative sign, so that foreign investments diminish once a country achieves a certain welfare level. Based on this argument there is a weak negative relationship between FDI and trade bal-ance (especially for new EU member countries, e.g. Baltic countries). But at the same time there is positive relationship between FDI and export per capita. FDI is
negatively correlated with inflation and economic risk, and positively correlated with unemployment for new EU members.
Finally, Grosse and Trevino (2005) found a support for the positive link between in-stitutional variables that reduce uncertainty and costs of long-term capital invest-ments for FDI in CEE countries. Corruption and political risk are significantly re-ducing the incentives for FDI inflows, whereas the bilateral investment treaties, the degree of enterprise reforms and repatriation rules are significantly positive related to inward FDI. Countries with low currency volatility attracted more FDI inflows, but at the same time inflation is not a significant determinant. They also conclude that FDI are strongly positively correlated with the market size.
2.2 The OLI paradigm
According to Dunning it is sufficient to exist that three groups of determinants to exist simultaneously in order FDI to occur, namely: existence of ownership com-petitive advantages in a multinational company, host country’s location advantages and internalization advantages (Sauvant et al 1998).
A company needs ownership-specific advantages to overcome local competitors and to compensate the costs of establishing production in the host country. The ownership advantages can be divided into two groups: ‘Oa advantages’ which include property rights and intangible assets, and ‘Ot advantages’ which are advantages arising from common governance. Firm-specific technology, patents, management knowledge, manpower, capital and product differentiation or advertising are the most frequently assessed as the main ‘Oa advantages’. Firm’s ability to properly manage its variously dispersed economic activities and to gain from risks diversification represents ‘Ot advantages’ (Ekström 1998).
Swedish transnational companies (TNC’s) have long traditions in FDI and respec-tively they profited from existence of large cluster economies (Andersson 2003). Ownership-specific advantages need to be combined with location-specific advantages of host countries like cost advantages, proximity to the market, market size and growth, factors endowment, the structure of the economy, and legal, social, and po-litical frameworks. Location advantage can stimulate the firm in order to protect its ownership advantages to undertake FDI in a special location and/or the new loca-tion might bring some new ownership advantages as well (Sauvant et al 1998). Location advantages are influencing the expected efficiency of exports and expected production profitability based on country location. When home country or some particular firm finds a certain location favorable for its production facilities assum-ing that is has ownership advantages, it might make a decision to internalize them i.e. take advantage of location factors (Ekström 1998).
The Baltic countries attract Swedish MNEs as they are geographically closely lo-cated, have high skilled labor force and tax laws standardized according to EU stan-dards (Andersson 2003).
The internalization-specific advantages mixed with ownership-specific and location
advan-tages can bring the firm even better results undertaking the FDI, rather than just performing arm’s length transactions. This it based on market imperfections, ex-plaining why the company would prefer to undertake FDI but not exports or licens-ing. The driving force behind internalization is imperfections in assets market (tech-nology, knowledge and management) which creates impediments like transaction costs or time-lags, and at the same time it is the firm’s interest to retain the exclusive rights on assets conferring significant competitive advantage (as licensing will erode the exclusive right to use the know-how) (Sauvant et al, 1998).
High technologies and research and development activities are the two main inter-nalization advantages of Swedish multi-national enterprises (MNEs), and they are not willing to disclose them; therefore FDI is a perfect strategy to entry a foreign market (Andersson 2003).
2.3 Determinants of FDI
Sweden is a big investor worldwide that is why Swedish FDI outflows to the Baltic countries are a small share of the Swedish FDI. But the Baltic States improved their investment potential so as to attract Swedish FDI (as the inflow increased from 200 million SEK in 1995 to 15023 SEK million in 2005).
Ownership and internalization advantages are firm-specific determinants of FDI, while the location advantages have the main influence upon the host country’s in-flow of FDI. Location advantages are the only ones that can be directly influenced by host country policies. And host country determinants can be divided into three groups: policy framework for FDI, economic determinants and business facilitation (Sauvant et al, 1998).
The most important determinants for FDI for our analysis are location specific and mainly economical determinants. The determinants of FDI are easily pinpointed by looking at the motives of MNEs in host country. FDI can be classified according to the motives of MNEs in the following way:
9 Market-seeking FDI - driven by the following host country advantages: market size and growth, market structure, personal income, country-specific consumer preferences access to regional and global market
9 Resource/asset-seeking FDI - driven by availability and quality of natural re-sources, low cost-unskilled labor, skilled labor, technological, innovatory and other created assets, infrastructure
9 Efficiency-seeking FDI - follows the competitive advantages like low cost of inputs listed above, other inputs costs like transport and communication costs, regional agreements leading to establishment of regional networks (Johnsson 2005) and (Sauvant et al 1998).
2.3.1 Market size
The inward inflows of FDI are bigger as the size of the country grows, basically be-cause of the scale of the economy. Nevertheless, investors are reserved to invest in countries with high GDP but limited number of consumers, and vice versa in large countries with low GDP. Expectations may play a role. If estimations for a country shows near future peaks of the cycle this will serve as a sign for future inward FDI (Merlevede & Schoors 2004). The absolute GDP is the measure of market size but, at the same time it should be taken into account the importance of GDP per capita which measures the quality of market demand (welfare level). A high level of GDP per capita implies a shift up of the demand for more advanced types of goods of a higher quality. Hence, larger volumes of FDI should flow to more economically de-veloped countries, as it will be easier to sell products in this market for MNEs (Mer-levede & Schoors, 2004).
Market size should not be a strong driving force behind Swedish FDI into the Baltic countries considering relative small market size but according to Barsos-Torstila (1999) even in the case of such small markets (like Baltic ones) market growth is a significantly important determinant of FDI. Johnson (2005) is also showing that market size has a significant positive effect on the volume of FDI in most of the studies upon host country determinants.
2.3.2 Unit labor cost
Unit labor cost or wages serve as an estimator of the competitiveness between countries. The expectations are that the inward flow of FDI is bigger in countries with lower unit labor costs. But at the same time unit labor cost reflects to some ex-tent the quality of labor supply. So for investments in intensive industries with fast improvements highly skilled employees who will fast and easy adapt to new changes in the production process may be relevant (Merlevede and Schoors 2004).
In the case of Swedish investors, Nandakamur and Wauge (2000) found that avail-ability and quality of human capital is more important than low wages. As a matter of fact a higher wage level is correlated with higher productivity in the economy and quality of human capital. But at the same time Swedish MNEs invest heavily in Es-tonian service sector attracted by the relative high quality of labor force which is similar with the Western countries, regardless of the low wage level. Hence, wage level can have influence in either ways FDI inflow into host economy.
2.3.3 Economic freedom
A country must have an adequate legal system sustaining property rights, fighting corruption and with constant fundamentals in order to attract FDI. The level of economic freedom is very important in explaining the inflows of Swedish FDI into CEE countries and this is the main reason for including the index of economic freedom as an explanatory variable in our regression (Pejovich 2002).
The index of economic freedom includes a range of institutional factors determining economic freedom like, corruption, trade barriers, the fiscal burden of the
govern-ment, the rule of law and the ability to enforce contracts, regulatory burdens on business, restrictions on banks regarding financial services, labor market regulations and black market activities and existence of property rights (Heritage Foundation). Among CEE countries, the Baltic countries have relatively the highest levels of eco-nomic freedom.
2.3.4 Transportation costs
The geographical closeness between markets serves as a proxy for transportation (and informational) costs based on the gravity model of international trade (Anders-son 2003). A different point of view on the influence of distance on investments is given by Merlevede & Schoors (2004) – the estimated volume of trade is negatively related with the distance, resulting in a bigger motivation to perform FDI (by estab-lishing production facilities in the host country).
Andersson (2003) argues that due to proximity to Sweden the Baltic countries and Poland attracted the highest volume of Swedish FDI among CEE countries.
2.3.5 Currency valuation
Absence of a stable and well-accepted currency has a very strong negative impact on FDI. The risk associated with FDI increases once there is an unanticipated deprecia-tion in the host country exchange rate. Economical and political disturbances cause the currency rate to be more volatile and eventually to depreciate, obliging investors to sustain costs to avoid transactions and related losses. Thus, countries with a sta-ble exchange rate preserving the value of foreign investor’s earnings are expected to receive investments (Grosse and Trevino 2005). At the same time Bloningen (2005) agrees that the effect of exchange rate on FDI is symmetric and proportional to the size of exchange rate movements. Therefore volatility of the exchange rate across models has an ambiguous sign, mainly depending on firm characteristics.
Swedish MNEs are eager to undertake FDI projects in countries with low exchange rate variability (Ekström 1998).
2.3.6 Research and Development intensity
R&D activities stand more for ownership advantages in determining FDI. Accord-ing to DunnAccord-ing companies perform R&D abroad to produce new core products and processes or to acquire knowledge necessary to advance own R&D. The theory sug-gests existence of a direct relationship between a MNEs research and development expenses and the propensity to undertake FDI (Ekström & Höglund 1998), the rea-son is that as the company does R&D expenditure it gets ownership advantages in the form of technological advantages. If ownership advantages grow further, inter-nalization advantages arise thus leading to undertaking FDI (Ekström 1998).
2.3.7 Net exports
A major motive to undertake a FDI project is to substitute for exports. Exports ex-ercise low fixed costs, but costs associated with transportation and trade barriers. Entering the market using FDI can cut considerably variable costs except higher fixed costs (Bloningen 2005). FDI will most probably be undertaken only in the second stage after a certain market was reached and fulfilled with export products. At the same time a very important determinant is trade openness, because it has a direct impact on the FDI performed by MNEs. Higher trade openness lower in-vestments inflow and vice versa. The reason is simple, higher tariff barriers makes trade more difficult hence, FDI become more profitable (Ekström 1998).
FDI and net exports are two variables with reciprocal influence. Ass and Beck (2005) find empirical results according to which trade balance has weak negative in-fluence on FDI in CEE countries based on the assumption that once new EU members achieve a certain level of welfare FDI tend to decrease. This is consistent with the gravity model for trade and OLI approach consequently trade has a nega-tive influence on FDI.
3
Data and method
In section 3.1 a presentation of the statistical data used in the regressions is made. In sec-tion 3.2 we present the method and variables used in regression.
3.1 Data
The time period analyzed is between 1995 and 2005, as previously there were no re-liable data. Furthermore, by 1995 the inward FDI into Baltic countries became im-portant enough for their economies. Data for the following countries where col-lected Latvia, Lithuania, Estonia, Poland, Hungary, Czech Republic, Slovak Repub-lic, Slovenia, Croatia, Romania and Bulgaria.
For a proper estimation of explanatory variables we used data from the following sources. The dependent variable - FDI was taken from the data basis compiled by United Nation Conference of Trade and Development (UNCTAD). Swedish FDI data was collected from the Central Bank of Sweden, and for German FDI data from Federal Statistic Office of Germany.
The data on the index of economic freedom was available on the site of the Heri-tage Foundation1.
1 “The highest form of economic freedom provides an absolute right of property ownership, fully realized
freedoms of movement for labor, capital, and goods, and an absolute absence of coercion or constraint of economic liberty beyond the extent necessary for citizens to protect and maintain liberty itself. In other words, individuals are free to work, produce, consume, and invest in any way they please, and that freedom is both protected by the state and unconstrained by the state.”
The data on wage level and R&D intensity are available on Eurostat. R&D intensity is expressed as expenditures on R&D as percentage of GDP. Finally, trade balance data were collected from Ecowin. The neighbor dummy was used to show the prox-imity with Estonia, Latvia and Lithuania as a strong driving force behind investment in the case of Swedish FDI, and German FDI to show the geographical proximity to Poland and Czech Republic as an important determinant.
3.2 Method and Variables
The data is statistically examined using regressions. The data is grouped so as to be able to run a cross-section analysis. All countries are regarded as one group, in the sense that data from different countries were summarized as one variable. The re-gression technique used is OLS rere-gression.
The regression model based on the theoretical background is as follows:
FDI = α + β1 Economic freedom + β2 R&D + β3 Trade balance + β4 Wage level + β5 Neighbor Dummy + ε
This model is used in all three regressions. Note that in case of global (total) FDI into CEE countries we exclude the dummy, because global FDI cannot be ex-plained by proximity. We expect the variables to take the sign that is in line with the theoretical background. Furthermore it is interesting to see how the variables are de-fined, which table 3.1 shows.
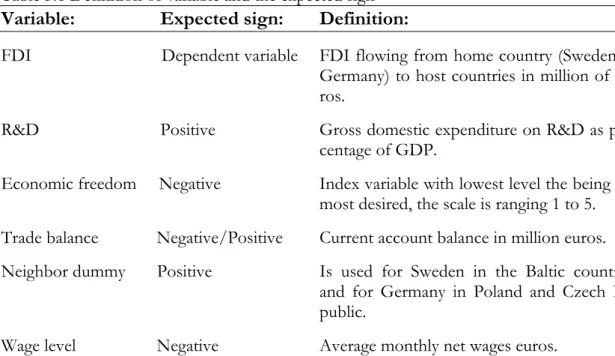
Table 3.1 Definition of variable and the expected sign
Variable: Expected sign: Definition:
FDI Dependent variable FDI flowing from home country (Sweden or Germany) to host countries in million of eu-ros.
R&D Positive Gross domestic expenditure on R&D as per-centage of GDP.
Economic freedom Negative Index variable with lowest level the being the most desired, the scale is ranging 1 to 5. Trade balance Negative/Positive Current account balance in million euros. Neighbor dummy Positive Is used for Sweden in the Baltic countries
and for Germany in Poland and Czech Re-public.
Wage level Negative Average monthly net wages euros.
There is a need to discuss in detail the motives behind the expected signs of ex-planatory variables and the aim of using them in regression.
According to our hypothesis R&D is expected to have a positive sign. For example, Latvia had the highest percentage of total foreign financed expenditures on R&D in Europe with 35.6 per cent, Estonia with 14.4 per cent and Lithuania with only 7.1
per cent (Frank 2005). At the same time the Baltic countries have higher spending rate on human resources, compared to average EU level, which also gives incentives for R&D development and hence might attract more FDI inflow. It is assumed that R&D activities attract FDI into the Baltic countries as they have technologically more advanced and more efficient companies (due to R&D expenses) which attract efficiency-seeking Swedish investments.
The more economic freedom a country encounters the higher the expected invest-ment inflows. The index of economic freedom ranges from 1 to 5, where 1 stands for most economically free country, and 5 for the most repressed. In the regression a positive relation between economic freedom and FDI is expected to show a nega-tive sign because of structure of the index.
There are debates in many research papers on whether trade balance affects FDI or vice versa. Not less than 20 research papers supporting the idea that indeed trade balance is inducing FDI, not vice versa. But trade balance can have a positive or negative effect on FDI. If the investments are export oriented then the impact of trade balance should be positive, but if the investments are performed to produce good for supplying host country’s market the sign is supposed to be negative.
Neighbor dummy is expected to have a positive sign. As we have previously men-tioned it is expected more intense economical, political, cultural and personal rela-tions in neighboring countries. This would show whether or not Swedish companies invest in Latvia, Lithuania or Estonia, due to geographic proximity. Unfortunately, our dummy cannot explain all the other factors influencing the investment decision of Swedish companies. Something which might be considered as an explanation for dummy influence is the traditions, languages and institutions linked to Scandinavia. Wage level has a double effect on FDI. First, a relative low wage level is the most important factor for manufacturing companies with relatively simple production. But on the other hand, a higher wage level stands for a more efficient and skilled la-bor force, that would attract companies with more advanced technological produc-tion or services providing companies. Our assumpproduc-tion is that Swedish investors seek low-cost high skilled work force advantages in the Baltic countries. Thus we assume that there is a negative influence of wage level on FDI flow.
4 Regression
analysis
The outline of this analysis is done in three sections. First we analyze total flow of FDI to all CEE countries. Then we analyze Swedish and German FDI flows to the CEE countries. Note once again that for Sweden and Germany a dummy is used in an attempt to explain some of the FDI flow by geographical closeness. Our analysis is based on the results from cross-sectional OLS regressions.
4.1 Total FDI into CEE countries
In the first regression, we examine general pattern of FDI flows for all countries in the set. We did not include the dummy in this regression. The dependent variable is
all the FDI flowing to certain transition economies (CEE countries). Table 4.1.1 presents what data are used in this regression. And table 4.1.2 present the results of the regression.
Table 4.1.1 Summary statistics: Total FDI into CEE
Variables N Mean Standard Error Min Max
FDI 100 2297,999 2602,0301 72,6 12873
Average monthly net wage,
euros 92 390,7624 251,9223 1203,337 87,73968
Economic freedom 96 3,0108 0,4653 2,100 4,200
Trade balance, million euros 95 -1747,1278 6874,8669 -18975,59 19512,30
R&D, % of GDP 80 0,7884 0,3562 0,36 1,57
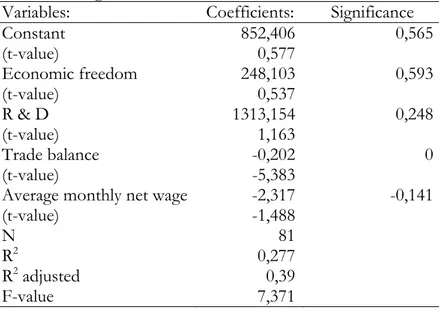
Table 4.1.2 Regression results: Total FDI into CEE
Variables: Coefficients: Significance
Constant 852,406 0,565 (t-value) 0,577 Economic freedom 248,103 0,593 (t-value) 0,537 R & D 1313,154 0,248 (t-value) 1,163 Trade balance -0,202 0 (t-value) -5,383 Average monthly net wage -2,317 -0,141
(t-value) -1,488
N 81
R2 0,277
R2 adjusted 0,39
F-value 7,371
The value of R2 is 0.277 implying that the model explains 27.7 per cent of the changes in the FDI flow. The only variable with an acceptable significance level is trade balance. The critical t-values for 5% and 1% significance level are 1.67 and 2.66. Therefore, the only variable that fits the model is once again trade balance (5.38>2.66>1.67).
To summarize, the only variable in the model with an acceptable significance level and t-value is trade balance. The critical F value is 4.0 on the significance level 1% and in our model 7.371, thus our model is adequate. The variables that follow the expected signs are trade balance, R&D and wage level.
4.2 Swedish FDI into CEE countries
In this model we include the neighbor dummy. As mentioned previously, the dummy is set for Latvia, Lithuania and Estonia. The dependent variable is Swedish FDI flow to the chosen countries (CEE). Table 4.2.1 presents the data used in this regression. In table 4.2.2 the characteristics of the regression are presented.
Table 4.2.1 Summary statistics: Sweden FDI into CEE
Variables N Mean Standard Error Min Max
FDI 93 6499,985 16337,18 12,537 144212,4
Average monthly net wage,
euros 92 390,7624 251,9223 87,7398 1203,337
Economic freedom 96 3,01083 0,465339 2,100 4,200 Trade balance, million euros 95 -1727,96 6221,018 -18975,6 19512,3
R&D, % of GDP 80 0,788 0,35618 0,36 1,57
Table 4.2.2 Regression result: Swedish FDI into CEE
Variables Coefficients Significance
Constant 28041,727 0,005 (t-value) 2,923 Economic freedom -5446,961 -0,04 (t-value) -2,09 Neighbor Dummy -4001,925 -0,22 (t-value) -1,237 R&D -13626,207 -0,021 (t-value) -2,359 Trade balance -0,681 0 (t-value) -4,132 Average monthly net wage 10,711 0,143
(t-value) 1,48
N 77
R2 0,297
R2 adjusted 0,343
F-value 7,516
The value of R2 is 0.297 hence the model explains 29.7 percent of the variation of the flow of Swedish FDI. The variables with acceptable significance level are trade balance, R&D and index of economic freedom, which indicates a strong impact on the dependent variable. Wage level and the dummy have low significance implying no strong relationship between them and Swedish FDI flow. The F value is 7.516 which indicate that the model is adequate, since the critical value of F is 4 for the 1% significance level. The variables that follow the expected signs are trade balance and index of economic freedom.
Comparing both regressions we come to the conclusion that the model for Swedish FDI has better significance and t values, thus it provides a better understanding of driving forces of inward FDI.
4.3 German FDI into CEE countries
To have a better insight about the determinants of FDI, we compare its results with the results from the Swedish FDI model. In this model we use a neighbor dummy
variable which is set for the Czech Republic and Poland. Table 4.3.1 presents how the date used in the regression. The results are presented in Table 4.3.2.
Table 4.3.1 Summary statistics: Germany FDI into CEE
Variables N Mean
Standard
Error Min Max
FDI 96 459,78 577,802 3 2368
Average monthly net wage,
euros 92 390,7624 251,9223 87,7396 1203,33
Economic freedom 96 3,01083 0,465339 2,100 4,2
Trade balance, million euros 95 -1747,12 6874,86 -18975,6 19512,3
R&D, % of GDP 80 0,7884 0,35618 0,36 1,57
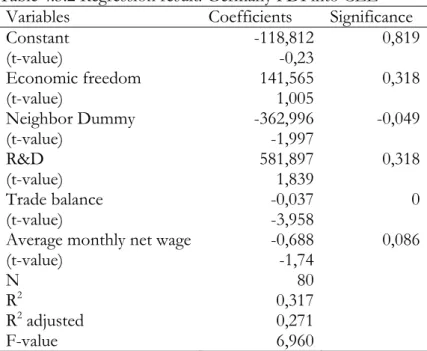
Table 4.3.2 Regression result: Germany FDI into CEE
Variables Coefficients Significance
Constant -118,812 0,819 (t-value) -0,23 Economic freedom 141,565 0,318 (t-value) 1,005 Neighbor Dummy -362,996 -0,049 (t-value) -1,997 R&D 581,897 0,318 (t-value) 1,839 Trade balance -0,037 0 (t-value) -3,958 Average monthly net wage -0,688 0,086
(t-value) -1,74
N 80
R2 0,317
R2 adjusted 0,271
F-value 6,960
The value of R2 is 0.317 thus the model explains 31.7 per cent of the changes in the German FDI flow. The only variables with acceptable significance level are trade balance and the neighbor dummy. Average monthly wage level has a significance level of 0.086%, which is raising doubts about its credibility. Unlike the model for Swedish FDI the index of economic freedom and R&D have low significance level and the t-values for both variables are just confirming the fact. The F-value indicates that the model is adequate on the 1% significance level. The variables that follow the expected signs are R&D and trade balance.
4.4 Discussion
The result from the model of global FDI into the CEE countries is ambiguous. The model fits well, but all the variables, except trade balance, are statistically insignifi-cant. Thus we cannot see any pattern or trend analyzing the statistical data. The only
conclusion confirming the theory is that trade balance has a negative influence on FDI inflows as they are substitutes. A very interesting result is the fact that FDI are not attracted by low wage level characteristic to these countries.
In the second regression which deals with Swedish FDI, trade balance, R&D and index of economic freedom have an influence on Swedish FDI. As it is mentioned in many research papers like Grosse & Trevino (2005), Brenton (1999), Merlevede & Schoors (2004), a country attracts FDI by offering legislation that upholds private property rights, combat corruption and have stable economical fundamentals, the Baltic counties have almost the highest levels of economic freedom amongst new-EU members. That is why the index of economic freedom has a strong influence on investors’ decisions. But this is a rather general statement as it is important for any investor investing in any country. Respectively, the same should hold for German FDI, but it is not the case. R&D was expected to influence FDI because the ana-lyzed countries have rather high skilled labor force, which would imply relatively high R&D developments. But the results of our analysis show that the decision of Swedish investors to invest in Baltic countries is significantly negatively influenced by that factor, which contradicts the theory. On the other hand, Sweden has a very advanced R&D sector that is why Swedish investments in the Baltic States are less technology oriented, mostly in manufacturing and services (transport, telecommuni-cations, and financial intermediation).
Trade balance, wage level and the neighbor dummy can explain the motivation of German FDI, to a certain extent. Neighbor dummy was expected to show a positive effect; instead it has an unexpected strong negative effect, which is in contradiction with the theory. Since according to the gravity models of international trade and Andersson (2003) geographical proximity positively influences market-seeking and efficiency-seeking FDI as transportation cost are minimized. But at the same time, Merlevede & Schoors (2004) argued that the greater the distance, the bigger the mo-tivation to perform the FDI by establishing production facilities in the host country. But it is possible that the dummy has a cultural or historical meaning, instead of the geographical meaning. Sweden’s geographical location close to the Baltic countries, and also its historical relationship, was considered to be important factor determin-ing FDI inflow, but the empirical results did not confirm this.
Wage level is regarded as an estimator of the cost competitiveness between coun-tries. The expectations are that inward flow of the FDI is bigger in countries with lower unit labor costs. But at the same time wage level reflects the quality of labor supply. Thus, for investments in intensive industries with fast improvements, highly skilled employees who will be able to adapt to new changes in the production proc-ess easier then others might be required (Merlevede and Schoors, 2004). In the case of global and German FDI there is a negative influence of wage level on FDI in-flow. Thus, global and German FDI in the analyzed transition economies seek for cost savings but not for the quality of labor force or efficiency. But as the signifi-cance levels are low, this is not a conclusion that can be drawn based on statistical results. Also in the case of the Swedish FDI, wages have a low level of significance, but as found by Andersson (2003), we tend to believe that the wage level is very
im-portant for Swedish investors in Baltic countries. The significance level for the wage level is too low in all our regressions in order to draw any reliable conclusions. In all three models trade balance has an excellent significant level. Ass and Beck (2005) found in their study that trade balance has a weak negative influence on FDI, which is in line with the assumption that FDI in new-EU countries decreases with an increase in welfare level. Bloningen (2005) considers that the correlation between trade balance and FDI is negative if the trade flows consist of finished products which are substitutes to the ones produced by MNEs, and positive when the trade flows consist of intermediate inputs used by MNEs. Our explanation for the nega-tive sign of trade balance in our models is that all analyzed countries (except Bul-garia) have a negative trade balance i.e. they are net importers. This fact put more pressure on the competing companies in the host country, weakening the incentives for FDI; nevertheless the influence is vaguely negative.
5 Conclusions
The goal of this thesis was to find out the driving forces behind Swedish FDI into the Baltic Countries and at the same time to compare it with the results of German FDI so as to observe some trends or differences. We were interested in investments into the Baltic Countries as they have one of the highest flows of FDI per capita among CEE countries, and most active investor in these countries is Sweden.
First, we analyzed global FDI into CEE and looked for particular patterns, and then we analyzed Swedish FDI and compared it with German FDI. Analyzing the global FDI model the only conclusion to be drawn is the weak negative effect of trade bal-ance on FDI flow and the wage level has statistically insignificant level. Which can be confirmed by empirical evidence of Andersson (2003); Reijan, Reijan and Andersson (2001); Merlevede and Schoors (2004) according to which low wage level is important for investors in the first transitional years of the CEE countries then it is high-skilled labor force availability what is important. Consequently, the first re-gression did not give any valuable results.
Furthermore, analyzing the model for Swedish FDI flow we found out that index of economic freedom is a driving force of Swedish FDI flow. Hence, the Baltic coun-tries have the highest degree of economic freedom among CEE councoun-tries combat-ing corruption, protectcombat-ing property rights and enforccombat-ing a safe economic environ-ment for business, which is a strong motive for Sweden to invest more in Latvia, Lithuania and Estonia. At the same time the neighbor dummy used for the Baltic countries to distinguish them among CEE countries has no significance, which indi-cates that Swedish investments into the Baltic countries are not motivated by geo-graphical proximity. This fact is in contradiction with the empirical evidence of Andersson (2003) who found that distance is actually positively influencing the deci-sion of Swedish investors to invest in the Baltic Countries. One important explana-tion to be taken into account is that Swedish investors are psychologically close to the Baltic States which greatly reduce the cost of undertaking investments (Bevan and Estrin 2000). The other explanation would be the fact that Andersson (2003)
analyzes a short time period 1998-2002 and we analyze a longer time period during which the Baltic economies passed fast and large changes.
At the same time German FDI flow exhibit different patterns compared to Swedish flow. Thus, for German investors’ trade balance and neighbor dummy are important determinants. Therefore, Swedish and German investors have different motives in their investment decisions.
The strongest insight in the investment decision process backed up by empirical evidence which goes along with previous researches like Andersson (2003), Pejovich (2003) is the major importance of economic freedom in attracting Swedish FDI into CEE. Surprisingly R&D intensity is insignificant and for Sweden the country with MNEs with intense R&D are not attracted by R&D in CEE countries, which in our opinion is due to the fact that Swedish investors prefer to perform R&D activities home and only the manufacturing processes is transferred to new locations.
5.1 Further studies
Our first suggestion for making the results of the analysis more valuable is to ana-lyze a longer period of time all CEE countries used in regressions, and to run re-gression for all countries apart as the FDI flow. This would show us the specific de-terminants in each CEE country. Also we would suggest usage of such dede-terminants like firm size and industry concentration, endowment with natural resources, pro-duction costs and bilateral trade flows. Also we should mention that most of the time FDI determinants are indirectly affected by FDI. But a further study with a lar-ger time span, different econometric methods and a larlar-ger set of countries would gain precession.
References
Andersson M. (2003), Swedish foreign direct investments, An analysis of the determinants of Swedish FDI in Eastern and Central Europe, Master thesis in economics, Jönköping International Business School.
Johnsson A. (2005), Host country effects on Foreign Direct Investments: The case of developing and transition countries, JIBS Dissertation Series No. 031.
Pejovich S. (2003), Understanding the transaction costs of transition: It’s the culture stupid, Review of Austrian economy.
Ass N. and Beck M. (2005), Foreign investment in post-Soviet and Eastern Europe transition econo-mies, The Business review, Cambridge
Brada J.C., Kutan A.M. and Yigit T.M. (2006), The effects of transition and political instability on foreign direct investment inflows – Central Europe and the Balkans, The European Banks for Reconstruc-tion and Development, Journal of Economics of TransiReconstruc-tion, Volume 14 (4) 2006.
Bevan A. and Estrin S. (2000), The determinants of Foreign Direct Investments in Transition Econo-mies, William Davidson Institute, Working Paper 342.
Bloningen R. (2005), A review of the empirical literature on FDI determinants, Atlantic Economic Journal.
Carstensen K. and Toubal F. (2003), Foreign direct investment in Central and Eastern European countries: a dynamic panel analysis, Journal of comparative economics.
Du Pont M. (2000), Foreign Direct Investments in Transitional Economies: a case study of China and Poland, Macmillan Press.
Ekström, J. (1998), Foreign Direct Investment by Large Swedish Firms- The role of Economic Integra-tion and Exchanges Rates, Lund University Press.
Ekström M. and Höglund B. (1998), The determinants of foreign direct investment, Bachelor thesis in economics, Jönköping International Business School
Frank S. (2005), Statistics in focus, Science and technology, R & D and internationalization, Eurostat. Groose R. and Trevino L.J. (2005), New institutional economics and FDI location in Central and eastern Europe, Management International Reviews, (p. 123-145) .
Moosa I. (2002), Foreign Direct Investments: Theory, Evidence and Practice, Palgrave.
Klays E. Meyer (1995), Direct Foreign investment in Eastern Europe, The role of labor cost, compara-tive economics studies, (p. 37).
Kivikasie U. and Anatola E. (2004), Baltic Sea Region- A dynamic Third of Europe, General con-ference of the union of Baltic countries
Lönnborg M., Olsson M. and Rafferty M. (2003), The race for inward FDI in the Baltic States and Central and Eastern Europe, Paper for SNEE European-Integration conference 2003. Merlevede B. and Schoors K. (2004), Determinants of foreign direct investment in transition econo-mies, Ghent University.
Marinova S. and Marinov M. (2003), Foreign direct investment in Central and Eastern Europe, Al-dershot.
Nanadakumar P. and Wague C. (2000), The determinants of Swedish and total foreign direct invest-ments in the Baltic, Journal of Emerging Markets, 5.
Reiljan J., Reiljan E. and Andersson K. (2001), Attractiveness of Central and Eastern European countries for foreign direct investment in the context of European integration: The case of Estonia, 41st ERSA Congress.
Sauvant et al. (1998), World Investment Report 1998 – Trends and Determinants, UNCTAD pub-lication.
Tøndel L. (2001), Foreign direct investment during transition. Determinants and patterns in Central and Eastern Europe and the former Soviet Union, Chr. Michelsen Institute, Development Studies and Human Rights.
Buch C., Kleinert J. and Toubal F. (2003), Determinants of German FDI: New evidence from mi-cro-data, Economic Research Centre of the Deutsche Bundesbank..
Brenton P., Di Mauro F. and Lucke M. (1999), Economic Integration and FDI: An Empirical
Analysis of Foreign Investment in the EU and in Central and Eastern Europe, Empirica.
Statistiska centralbyrån (www.SCB.se) 2006-11-14 Untied Nation Conference of Trade and Development (UNCTAD)
http://www.unctad.org/Templates/StartPage.asp?intItemID=2527&lang=1 2006-11-01 Central Bank of Sweden
www.riksbanken.se 2006-11-01
Federal Statistic Office of Germany
http://www.destatis.de/themen/e/thm_volksw.htm 2006-11-01
Heritage foundation
http://www.heritage.org/research/features/index/ 2006-11-01
Official Eurostat statistical publications 2006-11-01
http://epp.eurostat.ec.europa.eu/portal