Construction and Evaluation of an Algorithmic and
Distributed Prioritization Method
Annabella Loconsole1,3, Hannes Gruber2, Adrian Nae2, Björn Regnell3,
1 Department of Computer Science, Malmö University, Sweden 2 Flygprestanda AB, Malmö Sweden
3 Department of Computer Science, Lund University, Sweden
Annabella.Loconsole@mah.se
{ic05hg7, c03an}@student.lth.se, {Björn.Regnell, Annabella.Loconsole}@cs.lth.se
Abstract. Prioritization of requirements and tasks is an important activity of the development process; it can however be a very complex and time-consuming activity. In this paper we present MAAD (Method for Agile, Automated and Distributed prioritization) an algorithmic prioritization method. The method was developed at Flygprestanda AB, which needed a systematic and automated way of prioritizing requirements and work tasks. The method is constructed based on existing prioritization methods, focusing on minimizing the end-user time-consumption. Factors considered in the priority calculation are Urgency, Benefit, Cost, and Type. Furthermore, in order for the method to suit different companies and projects the importance of the different factors is adjustable. An evaluation was performed, which showed that MAAD prioritization was easier-to-use, less time-consuming, more accurate, more scalable and the prioritization method most suitable for Flygprestanda compared to Wiegers method and the prioritization method used at the company.
Keywords: prioritization, factor, weight, algorithm, urgency, benefit, cost and type
1 Introduction
Which is the most important task at hand? This is the central question that a prioritization method aims at answering. Prioritization must be a part of every decision-making process. In the context of requirements engineering, prioritization usually means deciding the order in which requirements shall be implemented. Widening the perspective, the same principles hold for any form of work, every kind of work task must be evaluated and planned accordingly. Exactly how the prioritization is done varies between different persons and companies. Usually it is done through subjective judgments of the factors that affects, and are affected by, the decision at hand.
Prioritization can however be very time consuming, especially when dealing with large amounts of information. During the prioritization process both short-term and long-term effects of information items such as requirements, tasks and requests must be evaluated. This is particularly complicated if the items affect each other.
Another issue when performing the prioritization is that the knowledge required to prioritize usually is distributed among several persons, for instance employees and customers.
These challenges lead to the following research questions: 1. Is it possible to reduce the individual workload by introducing an automated and distributed prioritization method for requirements, tasks and change requests? 2. Can an automated and distributed prioritization method increase the quality of a company’s software and services?
In order to answer these questions, we constructed a Method for Algorithmic, Automated and Distributed prioritization (MAAD) at Flygprestanda AB. The method is based on existing prioritization methods, with the focus on minimizing the end-user time-consumption. Factors considered in the priority calculation are Urgency, Benefit, Cost and Type and in order for the method to suit different companies and projects, the importance of the different factors is adjustable. An evaluation was performed with the purpose of comparing MAAD to Wiegers method [3] and the prioritization method used at Flygprestanda. The evaluation showed that MAAD prioritization, was easier-to-use, less time-consuming, more accurate, more scalable and the prioritization method most suitable for Flygprestanda.
The paper is structured as follows: in the next Section we briefly describe different requirements prioritization methods, in Section 3 it is described the context of this study. In Section 4 we present our prioritization method. An evaluation is described in Section 5. Finally discussion and conclusions are presented in Section 6.
2 Requirements Prioritization Methods
In this section we describe several techniques that are available in the literature used to prioritize requirements. An overview of prioritization factors can be found in [1].
The Analytic Hierarchy Process (AHP) was first introduced by Saaty [16]. The basic idea of this method is to determine a ratio scale1 list of items by comparing all possible pairs (pair-wise comparison). The comparison complexity of ! ! − 1 2 which results in 45 comparisons for 10 requirements, is the major disadvantage of the AHP method, but can be lowered by exploiting machine learning techniques [6], [7], [8].
Case-Based Ranking (CBRank) is a method similar to AHP that was designed specifically to use machine learning techniques to overcome the scalability problems in AHP. Another difference with CBRank is that the user has to specify a strict preference, i.e. decide which of the compared items is the most important [7], [8], [9]. Other methods that use pair-wise comparisons are Bubblesort that has the same comparison complexity as AHP and Binary Search Tree (BST) data structure [10].
In the Cumulative voting technique, each stakeholder gets an amount of imaginary money or points that can be spent on the different requirements, tasks or requests that are subject to prioritization. This technique is used in the Hundred-dollar-test where all stakeholders are given 100 imaginary dollars to distribute among requirements
[11]. Variations have been tested with larger amounts of money to better suit prioritization of larger sets of requirements [12]. When performing prioritization using cumulative voting, an issue could be that stakeholders can use different voting strategies and tactics.
Table 1.Comparison of prioritization methods.
Method Technique(s) Factors considered Result type Reference
AHP Pair-wise comparisons Priority Ratio [16] Binary Search Tree Pair-wise comparisons Priority Ordinal [14] Bubblesort Pair-wise comparisons Priority2 Ordinal [14] CBRank Pair-wise comparisons Cost, benefit3 Ratio [7] Hundred-dollar-test Cumulative voting Priority Ratio [11] MoSCoW Numerical assignment Priority Nominal [15] Planning game Numerical assignment,
ranking
Effort, priority Ordinal [4, 13] Top-ten Ranking Priority Nominal [2] Wiegers method Numerical assignment Benefit, penalty, cost, risk Ratio [3] MAAD Numerical assignment Urgency, Benefit, Cost,
Type
Ratio [1]
Numerical assignment is a common technique where items are put into different priority groups. Often three or four different groups are used, such as Low, Medium, High or as in the MoSCoW method: Must have, Should have, Could have, Won’t have. Numerical assignment is used in eXtreme Programming as part of the Planning game when the contents of the next release are planned by the developers and customer [13]. The items, called stories, are placed in different piles according to priority and risk and can thereafter be more easily ranked within the groups [4]. The Top-ten method consists in ranking only the 10 most important items at the time are identified, the rest are left until the next time the prioritization is performed [2]. Wiegers method also uses numerical assignment for estimation of benefit, penalty, cost and risk [3]. The different factors are estimated for every item and are assigned a value ranging from 1 to 9. The priority score is calculated according to the following formula:
!"#$"#%& = !"#"$%&% ∗ !"#"$%& !"#$ℎ! + !"#$%&'% ∗ !"#$%&' !"#$ℎ! !"#$% ∗ !"#$ !"#$ℎ! + !"#$% ∗ !"#$ !"#$ℎ!
Table 1 summarizes the described methods. It also includes our MAAD prioritization, which is presented in section 4. Among these, only the Wiegers method can be applied in the company Flygprestanda since it considers several factors. Therefore it will be compared with MAAD during the evaluation.
2 The method supports any factor but only one at a time. 3 The method can combine up to two factors at a time.
3 Context
The method described in this paper has been developed for the company Flygprestanda AB, which is specialized in airport analyses and performance calculations within the aviation industry. The company has currently about 60 employees whereof half of these are software developers. The typical customer is a small to medium sized airline company, which relies on the services provided by Flygprestanda for their daily operations.
Currently about 7000 to 10000 requirements and change requests are handled each year, distributed over a few hundred software and service projects, but these numbers will increase as the company grows. The work process at Flygprestanda is agile in the sense of iterative work, relatively short release cycles and a clear focus on producing code rather than extensive documentation [1]. Differently from the waterfall development, iterative
The current prioritization method at Flygprestanda is ad hoc. The customer prioritize themselves their requests and error reporting. The problem is that almost every request and report is assigned the highest priority by the customer. This causes distrust in the set priorities and it makes it hard to recognize which request that should be handled first. This is a widespread and well known problem in requirements prioritization resulting in disbelief and in limited usefulness of the set priorities [2], [3].
Our prioritization method MAAD, described in the next section, will be integrated in Scope which is a new software system recently introduced in the company. Scope is developed as an in-house project whose main objective is to help manage and plan company projects. The system also handles the information flow within the company as well as between the company and its customers. The system is built to handle
nodes, a data structure which serves as a container for different kind of information.
The information could for instance specify requirements, tasks, and change requests. A project is defined as a set of nodes, which can change over time. Every project has its own set of nodes.
4 The Prioritization Method MAAD
According to the company’s needs, the prioritization method shall be implemented as an algorithm in Scope and be able to handle several factors. It shall also allow for adjustments since the importance of different factors to different company departments or projects might vary.
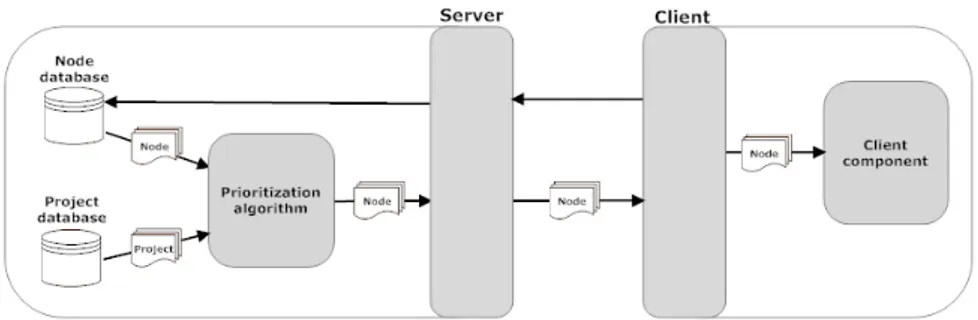
The method that we have created has been integrated in Scope, which is a web based client-server application. The priority calculation is performed on the server-side by the algorithm before a node is sent to the client. The graph in Figure 1 visualizes the priority-related data flow in Scope. The data flow paths are explained in the following list.
Fig. 1. Priority-related data flow in Scope when a client requests nodes from the server. 1. The client sends a request to get a set of nodes from the server.
2. The nodes are extracted from the node database and every node is, in turn, handed to the prioritization algorithm.
3. The algorithm retrieves parameters from the node (please refer to [1], chapter 3 for a definition of parameters).
4. The algorithm requests the data structure of the project which the node belongs to using the node parameter QM number (the quality management number that identifies the node project).
5. The node project is extracted from cache or from the project database. 6. The algorithm collects parameters from the project.
7. The algorithm calculates and sets the priorities parameters in the node data structures.
8. The set of nodes is thereafter sent to the client.
The stages 3-7 in the above list are repeated once for every extracted node. No significant negative performance impact due to integration of the prioritization algorithm has been experienced at the time of writing.
Table 2.Factors and weights.
Factors and weights Based on parameter(s)
Urgency factor Effort, Deadline date or Target date, Current date Benefit factor Severity or Value
Cost factor Effort
Type factor Type, Enhancement weight, Defect weight, NCR4 weight, Task weight Urgency weight Urgency weight, CB weight
Benefit weight Benefit weight, Cost weight Cost weight Benefit weight, Cost weight CB weight Urgency weight, CB weight
4 NCR means Non-Conformity Report. A report used to describe a serious fault and the immediate and preventive actions taken to correct it.
Our algorithm calculates node priority based on four main factors; Urgency, Cost, Benefit and Type. The algorithm is made highly adjustable by the use of different weights. The factors and weights used by the prioritization algorithm are presented in Table 2 as well as the node and project parameters that they are based on. To distinguish factors, weights, parameters, constants and variables the following notation will be used:
• Factors are named Fx, where x is the name of the factor.
• Weights are named Wx, where x is the name of the factor that the weight corresponds to.
• Parameters are named Px, where x is the name of the parameter. • Constants are named with unique lowercase letters.
• Variables are named with unique capital letters.
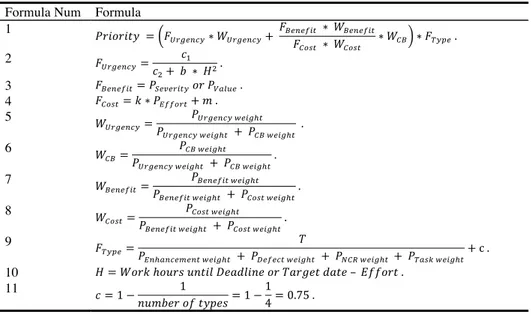
The following formulas are used to calculate the priority of a node. These formulas are based on the design decisions and on the literature study both described in [1], where the details of the algorithmic prioritization method can also be found; for limited space reasons a brief overview is given here:
Table 3.Formulas used to calculate the prioritization. Formula Num Formula
1 !"#$"#%& = ! !"#$%&'∗ !!"#$%&'+ !!"#"$%& ∗ !!"#"$%& !!"#$ ∗ !!"#$ ∗ !!" ∗ !!"#$ . 2 !!"#$%&'= !! !!+ ! ∗ !! . 3 !!"#"$%&= !!"#"$%&! !" !!"#$% . 4 !!"#$= ! ∗ !!""#$%+ ! . 5 ! !"#$%&'= !!"#$%&' !"#$!! !!"#$%&' !"#$!! + !!" !"#$!! . 6 ! !"= !!" !"#$!! !!"#$%&' !"#$!! + !!" !"#$!! . 7 ! !"#"$%&= !!"#"$%& !"#$!! !!"#"$%& !"#$!! + !!"#$ !"#$!! . 8 ! !"#$= !!"#$ !"#$!! !!"#"$%& !"#$!! + !!"#$ !"#$!! . 9 ! !"#$= ! !!"!!"#$%$"& !"#$!! + !!"#"$% !"#$!! + !!"# !"#$!! + !!"#$ !"#$!!+ c . 10 ! = !"#$ ℎ!"#$ !"#$% !"#$%&'" !" !"#$%& !"!" – !""#$% . 11 ! = 1 − 1 !"#$%& !" !"#$%= 1 − 1 4= 0.75 .
Urgency factor. The Urgency factor in formula 2 is based on the multi-user specified
node parameter Effort, the user specified Deadline or Target date and the Current date. Every Effort choice has a corresponding numerical value, which is the matching number of work hours. The choices are presented below, with their numerical values in parenthesis. The default value, which is used in the calculation if no user has estimated Effort, is presented in bold.
1 day (8), 2 days (16), 3 days (24), 1 week (40), 2 weeks (80), 3 weeks (120)
The variable H, defined as the remaining time (in work hours) to when work has to begin, is calculated according to the principle shown in formula 10 in Table 3.
The Deadline date is used to calculate ! if it is before the Target date. The Target date is used to calculate H if it is before the Deadline date. When one or more users have estimated Effort, the average of all estimations is used in the calculation in formula 10. The calculation of course has to be adjusted to consider the number of work hours per workday, the number of workdays per work week and so on. A lower limit of 0 is enforced on the H value to ensure that the Urgency factor in formula 2 stays at its maximum value when Deadline or Target date is passed. The priority difference between items that have passed their deadline or target dates will therefore entirely depend on their benefit, cost and type factor values.
The ratio !! !! specifies the maximum resulting value of formula 2 and this ratio, in combination with !, decides how fast the value will increase when ! approaches 0. The actual values of !!, !! and ! used in the prioritization algorithm are presented below.
!!= 10000, !!= 1000, ! = 0.5 .
These values were chosen to limit the maximum value to 10 and to achieve a priority increase curve. This results in a period of approximately two weeks, where priority increases. Two weeks, which is a short term planning, correspond length of the iterative development an employee to change focus and switch work task.
Benefit factor. The Benefit factor in formula 3 in Table 3 is based on the user
specified node parameter Severity or Value depending on the node parameter Type. The Severity and Value choices have corresponding numerical values, which are used in the priority calculation in formula 1. The choices are presented below, with their numerical values in parenthesis and the default choice presented in bold. Severity choices for flight-specific projects and node types Defect and NCR are the following:
• None (1), • No Op impact (2), • Minor Op impact (3),
• Major Op impact (5), • Ac on ground (7), • Fleet on ground (10)
Severity choices for non-flight-specific projects and node types Defect and NCR are the following:
• Minor frustration (1), •Major frustration (3), •Minor functionality loss (5), • Major functionality loss (7), • Complete functionality loss (10)
Value choices for all projects and node types Enhancement and Task are the following:
• Trivial improvement (1) • Minor improvement (3), • Normal improvement (5), • Major improvement (7), • Essential improvement (10)
The values we have chosen for the different Severity and Value levels represent the exponential increase of criticality or value that is the “general opinion” of the Severity and Value levels at Flygprestanda.
Cost factor. The Cost factor in formula 4 in Table 3 is based on the multi-user
specified node parameter Effort. The Effort choices and their corresponding numerical values are described above (see the description of Urgency factor) and once again it is the average of the estimations that is used in the calculation unless no estimations have been made. In that case the default value is used. The Cost factor is calculated using a linear equation where k decides how fast the score increases and m decides the starting value. The actual values of k and m used in the prioritization algorithm are presented below.
• ! = 0.003 • ! = 1
These values were chosen to limit the maximum value of the Cost factor to approximately 2.5. This is the case when the Effort average is at its maximum (480 hours). This limit was introduced in Scope to prevent high effort times to decrease the combined Cost-benefit priority to such a low level that items are neglected.
Urgency and CB weights. The Urgency weight in formula 5 and the CB weight
(Cost Benefit weight) in formula 6 are based on the user specified project parameters Urgency weight and CB weight. The weights are used in the priority calculation in formula 1 to achieve a suitable balance between main factor Urgency and the combined main factors Benefit and Cost.
The parameter choices have corresponding numerical values that are used when calculating the weights. The choices are presented below, with their numerical values in parenthesis and the default choice (for both Urgency weight and CB weight) presented in bold.
• Very low (0.2), • Low (0.35), • Medium (0.5), • High (0.65), • Very high (0.8) The maximum values of formula 5 and formula 6 are thus 0.8 and the minimum 0.2. This means that it is not possible to totally disregard a main factor. The range of 0.2-0.8 is specific for the implementation in Scope.
Benefit and cost weights. The Benefit weight in formula 7 and the Cost weight in
formula 8 are based on the user specified project parameters Benefit weight and Cost weight. The weights are used in the priority calculation in formula 1 to achieve a suitable balance between the main factors Cost and Benefit. The default and available parameter choices and their numerical values are the same as Urgency and CB weights for both Benefit weight and Cost weight. The maximum and minimum values of the weights are therefore also the same (0.8 and 0.2 respectively). The combined effect of the Benefit weight and Cost weight on the Cost-Benefit part of the priority calculation thus ranges from 0.25 to 4.
Type factor. The Type factor in formula 9 in Table 3 is based on the user specified
node parameter Type and the user specified project parameters Enhancement weight, Defect weight, NCR weight and Task weight. The Type factor includes the weighting between different node types, and behaves similar to a weight for the whole priority calculation, as seen in formulas 1 and 9. Therefore no additional weight for the Type
factor was added. The node parameter Type determines which of the project parameters to use as the value T in formula 9.
! ∈ !!"!!"#$%$"& !"#$!!, !!"#!"# !"#$!!, !!"# !"#$!!, !!"#$ !"#$!! .
The available choices and their numerical values for the project parameters are the same as those presented for Urgency and CB weights. However the parameters do not have the same default choices. The default choice for each project parameter is presented below.
• Enhancement weight: Medium (0.5), • Defect weight: High (0.65), • NCR weight: High (0.65), • Task weight: Medium (0.5)
This means that, by default, defects and NCR’s will get slightly higher priorities than enhancements and tasks.
The constant ! in the Type factor calculation in formula 9 ensures that the resulting value is close to 1. This is important because it is used to slightly adjust the Priority value. The value of c was determined using the formula 11 in Table 3. From the formula can be deducted that the lowest possible Type factor value is 0.827 while the highest possible value is 1.321.
5 Evaluation
We performed an evaluation of our method. Aspects that were evaluated are Time consumption, Ease-of-use, Expected accuracy, Perceived accuracy, Scalability, Suitability Overall best method. The evaluation consisted in asking six employees at Flygprestanda to prioritize a set of items chosen from a real software project. We choose items for which we expected high medium and low values of prioritization to be represented.
The prioritization was made with 3 different methods in order to compare MAAD prioritization with the method currently used at Flygprestanda (which is ad-hoc, as described in section 3) and with the Wiegers method. We have chosen to compare MAAD with the Wiegers method since we believe it would be Flygprestanda’s only alternative to MAAD. The other methods shown in Table 1 are not suitable since they do not consider several factors.
The participants were chosen in order to have different project roles represented: two customers, one manager and three developers. Two of the authors performed a pilot test of the study.
The instruments used in the study were three paper forms used to prioritize the set of project items, one form for each prioritization method. The forms contained item name, description, deadline, and prioritization factors for each item in the set. Two questionnaires were used to evaluate the aspects mentioned above. Except for the time consumption that was estimated in minutes, the other factors were estimated on a 5-point Likert scale, where 1 corresponds to the text “I strongly disagree” and 5 corresponds to the text “I strongly agree”. We also interviewed the participants in order to get subjective opinion and experience on using the different prioritization methods, focusing on the use of different factors, scales, and expected impact on
Flygprestanda. The answers were annotated using pen and paper. All the forms, questionnaires and questions used during the semi-structured interviews can be found in [1].
The participants were not told which method was developed by the authors and the methods were referred to as methods 1, 2 and 3. After the prioritization was performed, the participants were asked to fill in the questionnaires. The interviews were performed later once the results of the prioritization had been calculated.
Table 4. Aspects measured during the evaluation with questionnaires.
Aspects measured MAAD Wiegers method Traditional Time consumption 5 min 25 sec 7 min 35 sec 7 min 45 sec
Ease-of-use 4.33 2.50 3.00
Expected accuracy 4.00 3.50 3.00
Perceived accuracy 3.83 3.00 3.67
Scalability 4.33 3.83 1.33
Suitability 4.00 3.33 2.00
Overall best 5 particip. 0 particip. 1 particip.
Table 4 shows the values of time consumption in minutes for the three methods. The values of the other aspects evaluated are mean values of a normalized Likert scale. The evaluation showed that MAAD prioritization had the lowest time consumption, was the easiest to use, and produced the most accurate results. The evaluation also showed that MAAD prioritization was the most scalable of the methods evaluated. Most of the participants in the evaluation considered MAAD prioritization to be the overall best, and the prioritization method most suitable for Flygprestanda. The results of the questionnaires were also confirmed during the interviews.
6 Conclusions and Future Works
In this paper we have presented the MAAD prioritization method that was developed to support agile, automated and distributed prioritization of requirements, change requests and work tasks at Flygprestanda AB. The method has been implemented as an algorithm in the Scope system and the algorithm calculates priorities automatically. Several factors (Urgency, Benefit, Cost and Type) influence the priority calculation and their relative importance is adjustable. The algorithm can receive input by several stakeholders, both customers and employees at Flygprestanda. An example of the use of MAAD is presented in [1]. An evaluation was also performed showing that MAAD was the best method among those evaluated.
The positive results obtained suggest that the limited number of factors improved both ease-of-use and time consumption of the method as can be seen in table 4 (time consumption). The automated urgency calculation minimizes the risk of missing deadlines, something that several participants to the interview study recognized as highly important to increase product and service quality.
Another strength of the MAAD method is that prioritization does not have to be performed on a set of items, which is the case in methods such as AHP, CBRank, the Hundred-dollar-test and Wiegers method. MAAD makes it possible to calculate the priority of a single item at any time. It also makes possible to compare the calculated priorities of any items. Furthermore, new requirements can easily be prioritized individually, without the need to compare (as in AHP) each newly requirements with all others which are already
However, there are several issues regarding the MAAD prioritization method that could be further investigated. For instance there could be dependencies among items that can affect priorities. Tasks Risk is also a factor that currently is not considered in MAAD prioritization. Including a risk factor would negatively affect both time consumption and ease-of-use but possibly increase the quality of the results. Further investigation could be done on whether a risk factor would increase quality.
Uncertainty is a factor that is not included in the priority calculation in MAAD. An indication of uncertainty regarding effort estimations is however available in Scope since all estimations are visible. Uncertainty should probably not directly affect the priority of an item, but it could be further visualized in Scope by automatically triggering a warning if the variance of effort estimations is high. This would not have any significant negative effects on time consumption or ease-of-use but could possibly lead to increased quality.
Items that do not have specified deadline or target dates are usually wanted as soon as possible, i.e. the sooner they are completed the better. This could call for automatically increasing the priority of “old” items in order to prevent these from being “forgotten”. This is achievable without any negative effects on time consumption and ease-of-use. It is however risky since it could possibly result in old, originally low-priority, items to be prioritized over new items that actually are more important. A thorough investigation should be performed before anything like this is implemented in order to assure that it does not cause quality to decrease instead of increase.
A way to specify and visualize the progress of an item is another open issue. This could possibly have a positive effect on urgency calculation and the quality of the results. It could also improve the possibility to track progress of projects. On the other hand it would increase time consumption and decrease ease-of-use as it would require users to frequently update node parameters.
Two factors, Urgency and Cost, are currently based on the mean value of the effort estimations. This could be extended by including a weight for estimators, in order to take into account their estimation accuracy. The estimation accuracy of employees is however hard to determine and it is questionable if this way of combining effort estimations would increase the quality of the priority result.
The impact of the MAAD prioritization method on product and service quality is something that can be evaluated further at Flygprestanda as the use of the Scope system within the company increases. At the time of writing, only few employees at the company use Scope (and therefore MAAD).
Our method has been constructed for the company Flygprestanda and therefore has local validity. Besides investigating further the factors mention above, we plan to test this method in other companies of different size and domain. This will further enhance the validity of our method.
Acknowledgments. We would like to thank the interviewees at Flygprestanda for
their dedicated participation in this study, and reviewers of the paper for their valuable comments.
References
1. Gruber, H., and Nae, A., MAAD prioritization A method for agile, automated and distributed prioritization of requirements and work tasks, Master Thesis, Lund University, ISSN 1650-2884, http://sam.cs.lth.se/ExjobGetFile?id=293 (June 2010)
2. Berander, P., Evolving Prioritization for Software Product Management. Doctoral Dissertation Series No. 2007:07, Blekinge Institute of Technology, (2007)
3. Wiegers, K., First Things First: Prioritizing Requirements, Software Development, vol. 7, no. 9 (1999)
4. Karlsson, L., Thelin, T., Regnell, B., Berander, P. and Wohlin, C., Pair-wise comparisons versus planning game partitioning—experiments on requirements prioritisation techniques, in Proc. 8th Int’l Conf. on Empirical Assessment in Software Eng., Edinburgh, pp. 145--154 (2007)
5. Fenton, N.E. and Pfleeger, S.L., Software Metrics: A Rigorous and Practical Approach, 2nd ed. Boston, USA: PWS Publishing Co. (1998)
6. Karlsson, J., and Ryan, K., A cost-value approach for prioritizing requirements, IEEE Software, vol. 14, no. 5, pp. 67--74 (1997)
7. Perini, A., Ricca, F., and Susi, A., Tool-supported requirements prioritization: Comparing the AHP and CBRank methods, Information and Software Technology, vol. 51, no. 6, pp. 1021--1032 (2009)
8. Avesani, P., Bazzanella, C., Perini, A., and Susi, A. Facing scalability issues in requirements prioritization with machine learning techniques, in 13th IEEE International Conference on Requirements Engineering, pp. 297--305 (2005)
9. Avesani, P., Bazzanella, C., Perini, A., and Susi, Supporting the requirements prioritization process - A machine learning approach, in Proceedings of 16th International Conference on Software Engineering and Knowledge Engineering, Banff, Alberta, Canada, pp. 306--311 (2004)
10. Karlsson, J., Wohlin, C., and Regnell, B., An evaluation of methods for prioritizing software requirements, Information & Software Technology, vol. 39, pp. 939--948 (1998)
11. Leffingwell, D., and Widrig, D., Managing Software requirements: A Use Case Approach, 2nd ed. Boston, Addison-Wesley (2003)
12. Regnell, B., Host, M., Natt och Dag, J., Beremark, P., and Hjelm, T., An Industrial Case Study on Distributed Prioritisation in Market-Driven Requirements Engineering for Packaged Software, Requirements Engineering, vol. 6, no. 1, pp. 51--62 (2001)
13. Beck, K., Extreme Programming explained, 2nd ed. USA: Addison-Wesley (2004)
14.Aho, A.V., Hopcroft, J.E., Ullman, J.D., Data Structures and Algorithms. Addison-Wesley, Reading, MA (1983)
15.Clegg, D., and Barker, R., Case Method Fast-Track: A Rad Approach. Addison-Wesley Longman Publishing Co., Inc., Boston, MA, USA (1994)
16.Saaty, T.L., The Analytical Hierarchy Process: Planning, Priority Setting, Resource Allocation (New York: McGraw-Hill), (1980)