Oral B’s Nordic Report on Oral Health
Caries prevalence among children, adolescents and adults,
and periodontal conditions among adults
Foreword
This report was commissioned and financed by Oral B. Oral B specified the limitations of national clinical data and conditions of interest, as stated in the introduction, but has not in any way participated in or influenced the production of the report.
We would like to thank the representatives from Denmark, Finland and Norway that assisted us with references and material: Assistant professor Ulla Krustrup, University of Copenhagen, Denmark; Dr. Liisa Suominen-Taipale, the National Public Health Institute (KTL), Finland; and Professor Dorthe Holst, University of Oslo, Norway.
A special thanks to Arja Söderfeldt, who helped with translations of the Finnish material. Malmö, November 2007
Malmö University Faculty of Odontology
Department of Oral Public Health
Veronica Johansson, Doctoral Student, BSocSci, BA Björn Söderfeldt, Professor, PhD, DrMedSci
Summary
The aim of this report was to compare the oral health in the Nordic countries of Denmark, Finland, Norway and Sweden, from existing national clinical data. The conditions of interest were caries prevalence and periodontal conditions. The groups of interest were children and adolescents up to the age of 19, and adults up to 60 years old. Further, socio-economic and ethnic differences, as well as differences in relation to living area were also of interest.
There are indications of similar trends in caries prevalence among children and adolescents in the Nordic countries, with a continuing decrease in caries prevalence during the past 20-30 years, and tendencies of a levelling out at the turn of the century. The WHO goal of a mean DMFT for 12-year-olds at 1.5 or below before the year 2020 (Petersen 2003), is already fulfilled in all four countries. However, it seems there is still work to do to attain the goal of at least 80% caries free 6-year-olds in 2020. The available data do not distinguish differences between urban and rural areas, nor ethnic and socio-economic differences.
The most important finding regarding both caries prevalence and periodontal conditions in adults is that there is a lack of national data from Norway and Sweden.
Although interpretations should be cautious, there are indications of slightly higher caries prevalence in Finland, compared to Denmark, among adult men. Data on educational level indicate similar patterns of associations between higher levels of education and lower figures of caries prevalence. There is a lack of data on ethnic differences in caries prevalence in adults. There is also a lack of data regarding differences between urban and rural living areas, which only were available for Denmark.
The results regarding periodontal conditions indicate that bleeding is widespread in both Denmark and Finland, while both shallow and deep pockets seem to be more common in Finland. Data on educational level indicate similar patterns of associations between higher levels of education and lower prevalence of shallow and deep pockets. There is a lack of data on ethnic differences in periodontal conditions in adults. There is also a lack of data regarding differences between urban and rural living areas, which only were available for Denmark.
From the available data, no interpretations regarding aggressive periodontitis, i.e. rapid deterioration of bone loss and periodontal ligaments, nor probability of developing it, can be made.
A recommendation for the future is to conduct more national clinical assessments of oral health in adults. National clinical research is needed in order to estimate what actions need to be taken to improve oral health. Without national assessments, political reforms cannot be evaluated and conclusions regarding their effectiveness cannot be drawn.
Foreword p. 2
Summary p. 3
Index p. 4
Introduction p. 5
Background p. 5
Material and method p. 5
Results
Children and adolescents
Caries prevalence p. 6
Discussion p. 10
Adults
Caries prevalence p. 11
Socio-economic differences in relation to caries prevalence p. 12 Caries prevalence and differences between living areas p. 14 Discussion, caries prevalence p. 14
Periodontal conditions p. 15
Socio-economic differences in relation to periodontal conditions p. 18 Periodontal conditions and differences in living areas p. 19 Discussion, periodontal conditions p. 20
General Discussion and Conclusions p. 21
References p. 23
List of tables p. 26
List of terms p. 28
Introduction
The task from Oral B was to, in two months, produce a maximum of 20 pages report on the oral health in the Nordic countries of Denmark, Finland, Norway and Sweden, from existing national clinical data. The focus of the report was stated as:
• Caries prevalence for children, adolescents and adults, based on compilations of existing data and key numbers, with discussions of reported tendencies and differences between the countries
• Prevalence of gingivitis in the adult population, 30-60-years old, based on compilations of existing data and key numbers, with discussions of reported tendencies and differences between the countries
• Prevalence of periodontitis and aggressive periodontitis in the adult population, 30-60-years old, based on compilations of existing data and key numbers. Consequences of the disease based on the probability of developing aggressive periodontitis or loosing teeth, and discussions of reported tendencies and differences between the countries • Differences in caries, gingivitis and periodontitis between inhabitants living in urban
and rural areas, with discussions of reported tendencies and differences between the countries
• Differences in caries, gingivitis and periodontitis between native inhabitants and ethnic minorities, with discussions of reported tendencies and differences between the countries
Gingivitis and periodontitis were collapsed under the heading “periodontal conditions”. It was decided to also report on socio-economic indicators, such as education and occupation.
The overarching aim of this report was therefore to compare the oral health in the Nordic countries of Denmark, Finland, Norway and Sweden from existing national clinical data. The conditions of interest were caries prevalence and periodontal conditions. The groups of interest were children and adolescents up to the age of 19, and adults up to 60 years old.
Background - The dental care systems in the Nordic Countries
The Nordic countries of Denmark, Finland, Norway and Sweden share similar characteristics in oral health care provision, and can be referred to as operating under a “ Nordic model”. It is characterised by taxation financed public dental health service, governmental supervision and a national chief dental officer (CDO) (Widström & Eaton 2004). There are, however, differences in the provision of dental care. Short descriptions of the countries’ systems are appended in the back of the report.
Material and method
Material was collected in several ways. Searches for articles published between 2000 and 2007 were conducted in the database PubMed, specifying national studies, country, and caries, gingivitis and periodontitis, respectively. The searches yielded 12 articles published between 2000 and 2007. Repeating the searches without the national studies specification yielded 368 articles published 2000 to 2007. The WHO database, available at Malmö University, was also scrutinized. Contacts were established with representatives from the different Nordic countries, who provided references and material. The provided information led to searches in the four countries’ statistical central databases, and of the homepages of the countries’ departments of health and welfare and national public health institutes. In total, 28 reports were found, as well as statistics on children and adolescents’ oral health from Denmark and Norway. The archives of the Danish and Norwegian Dental Journals were also
searched, which yielded 15 articles. Additional material was also found in references of provided material.
Children and adolescents
Caries prevalence
In this section, data concerning caries prevalence and experience in children and adolescents will be presented for all four Nordic countries. Data on oral health in children and adolescents are annually collected and reported in Denmark, Norway and Sweden, while data are collected and reported every third year in Finland.
Denmark
Poulsen and Malling Pedersen (2002) used cross-sectional national data on caries in children and adolescents from the Danish National Board of Health database, to study changes from 1988 to 2001. The age groups of interest were 5-, 7-, 12-, and 15-year olds. In table 1, mean number of decayed, missing and filled surfaces and teeth are presented for temporary (dmfs/dmft) and permanent teeth (DMFS/DMFT) for some of the years, as well as data from 2006, from Sundhedsstyrelsens Centrale Odontologiske Register (SCOR).
Table 1. Mean dmft/DMFT and mean dmfs/DMFS in 5-, 7-, 12-, and 15-year-olds in Denmark 1988 – 2006.
Data from all years not presented. The scores are rounded to one decimal. Data from 1988 – 2001 from Poulsen & Malling Pedersen 2002. Data from 2006 from SCOR.
1988 1990 1994 1997 2000 2001 2006 5-year-olds Nr. of children 32,760 34,798 52,995 60,584 63,061 60,709 48,069 dmft 1.5 1.4 1.3 1.0 1.0 1.0 0.8 1 dmfs 2.5 2.2 2.1 1.6 1.6 1.6 1.3 1 7-year-olds Nr. of children 52,630 43,145 50,853 58,908 62,197 64,568 50,227 DMFT 0.3 0.2 0.1 0.1 0.1 0.1 0.1 DMFS 0.4 0.2 0.2 0.1 0.1 0.2 0.1 12-year-olds Nr. of children 65,172 58,710 47,653 49,989 54,935 57,503 53,553 DMFT 2.2 1.4 1.3 1.1 1.0 0.9 0.8 DMFS 3.0 1.9 1.9 1.6 1.4 1.2 1.1 15-year-olds Nr. of children 66,655 66,141 51,884 47,667 49,242 50,478 47,895 DMFT 4.6 3.3 2.8 2.6 2.3 2.2 1.7 DMFS 6.7 4.6 4.1 3.9 3.3 3.2 2.5
1 Here, defs/deft was reported for 5-year-olds (decayed, extracted, filled temporary surfaces or teeth).
The main result was a decline in caries prevalence from 1988 to 2001, in all four age groups. However, during later years the decrease tended to level out (Poulsen & Malling Pedersen 2002). The results from 2006 showed a new decrease in 5-, 12- and 15-year-olds, with 7-year-olds mean results remaining stable since 2001.
From SCOR, data were also available on percentages of caries free: children and adolescents with zero numbers of decayed, missing and filled surfaces (defs/DMFS). Of the 5-year-olds, 76% were caries free, while they were 94% among the 7-year-olds. In 12-5-year-olds, 65% were caries free, and 45% of the 15-year-olds (SCOR).
Data on distributions regarding different DMFS scores in 2006 were also available. Here, only data for 12-year-olds are presented. The distribution shows there still are children in high need of oral health care. In 2006, 65% of the 12-year-olds had no caries at all, while 21% had DMFS scores between 1 and 2. DMFS scores of 3-4 were found in 8%, and the remaining 7% had DMFS scores of 5 or more (SCOR).
Finland
In Finland, Nordblad et al (2004a) reported on oral health in children and adolescents, from the late 1970’s until 2000. Results regarding percentages of caries free and the mean number of decayed, missing and filled teeth are presented in table 2, as well as means of filled teeth (FT) from 1985.
Table 2. Caries prevalence in Finland, from 1975 to 2000. Mean ft/FT from 1985 to 2000. Data from Nordblad
et al 2004a. 1975 1976 1979 1982 1985 1988 19911 1994 1997 2000 3-year-olds Caries free (%) 64 75 75 77 79 87 86 86 84 dmft 1.5 0.7 0.6 0.4 0.3 0.3 0.2 0.3 ft 0.2 0.1 0.1 0.1 0.1 5-year-olds Caries free (%) 20 42 47 48 54 60 65 66 65 dmft 5 2.1 2.1 1.6 1.4 1.1 0.8 0.9 ft 0.9 0.8 0.6 0.4 0.5 6-year-olds Caries free (%) 10 30 38 40 45 52 58 56 58 DMFT 1.2 0.4 0.4 0.3 0.3 0.2 0.2 0.2 FT 1.1 0.9 0.7 0.5 0.6 9-year-olds Caries free (%) 2 5 16 20 24 31 36 37 40 DMFT 3.4 1.6 1.2 0.8 0.4 0.5 0.4 0.5 FT 1.2 1.1 0.9 0.7 0.7 12-year-olds Caries free (%) 1 2 7 15 21 30 35 35 38 DMFT 6.9 4 2.8 2 1.2 1.2 1.1 1.2 FT 0.9 0.6 0.6 0.5 0.5 15-year-olds Caries free (%) 1 1 2 6 13 23 26 26 24 DMFT 12.4 7.8 6.2 4.3 3.1 2.8 2.5 2.6 FT 1.4 0.9 0.9 0.7 0.8 18-year-olds Caries free (%) - 0 1 2 5 11 14 15 16 DMFT - 11.4 9.4 7.3 5.3 4.7 4.1 4 FT 1.3 1.1 1.1 1.0 1.0
1 Estimation based on subsamples
The percentage of children and adolescents without caries activity had increased, in all ages. The average number of fillings had decreased in all ages, from 1985 to 2000 (Nordblad et al 2004a).
In 2003, 47% of children and adolescents under 18 had some caries (Widström & Suominen-Taipale 2006). The same year, the mean DMFT for 12-year-olds was 1.2 (STAKES, personal communication).
Norway
Using aggregated national dental health data for 5- and 12-year old children in Norway, Haugejorden and Birkeland (2002) studied caries trends among children between 1997 and 2000. During this period, 82% to 89% of 60,526 to 61,086 5-year-olds were examined/treated in the public dental health service. The percentages among 12-year-olds were 80% to 88% of 52,747 to 60,708 subjects. Results regarding dmft, dt and ft for 5-year-olds are presented in table 3. The main result was that mean dmft had increased from 1997/98 to 2000. Decay was the main cause of the increase. There was also an increase in caries experience from 1997 to 2000, from 30% to 39%. Increased caries experience was found in 88% of the dental care
districts. There were variations among the counties regarding dmft, and mean number of decayed and filled teeth (Haugejorden and Birkeland 2002).
Table 3. Caries experience in 5-year-olds in Norway, in 1997 – 2000. Data from Haugejorden & Birkeland
2002. 1997 1998 1999 2000 Nr. of children 33,481 34,622 34,669 34,020 Nr. of counties 12 13 14 14 dmft 1.1 1.1 1.2 1.5 Range of county dmft 0.7-1.8 0.8-1.6 0.9-1.9 1.1-2.3 dt 0.7 0.8 0.9 1.0 Range of county dt 0.4-1.6 0.5-1.2 0.6-1.5 0.7-1.9 ft 0.3 0.3 0.3 0.4 Range of county ft 0.2-0.4 0.2-0.4 0.2-0.4 0.3-0.6
Among the 12-year-olds, the caries prevalence decreased from 55% in 1997, to 52% in 2000. DMFT decreased from 3.4 in 1985, to 1.7 in 1997, and 1.5 in 1999/2000. During these three years, the D-component (decay) remained stable at 0.7. The missing teeth component was 0.1 or smaller (Haugejorden & Birkeland 2002).
Haugejorden and Birkeland later repeated the study of caries trends among 5-year-olds (2005). The percentages treated from 1997-2003 at national level were 77% to 89% of 59,667 to 62,202 children. The results regarding distribution of decay in dentine (d3) are presented in
table 4. The main result was an increase in caries prevalence, from 1997/98 to 2001, which then had decreased in 2003. There were variations in the pattern and the variation was greater in district than county level. The mean d3mft per child increased from 1.1 in 1997 to 1.6 in
2001, and decreased to 1.4 in 2003 (Haugejorden & Birkeland 2005).
Table 4. National, aggregated, data regarding distribution (%) of caries prevalence (d3) in 5-year-olds in
Norway, in 1997 – 2003. Data from Haugejorden & Birkeland 2005.
1997 1998 1999 2000 2001 2002 2003 d3 31 31 34 39 40 40 36
At Statistics Norway (2007), dental health status for 5-, 12-, and 18-year-olds is available from 1985 to 2006. In table 5, data from 1985, 1990, 1995, 2000 and 2006 are presented.
Table 5. Caries prevalence in 5-, 12-, and 18-year-olds in Norway, in 1985, 1990, 1995, 2000, and 2006. Data
from Statistics Norway 2007.
1985 1990 1995 2000 2006
5-year-olds
Percent examined of the age group 85 89 85 79 74
Caries free (%) 50 61 65 61 73
Mean number of teeth with caries experience 0.0 0.0 0.0 0.0 1.0
12-year-olds
Percent examined of the age group 89 93 87 78 74
Caries free (%) 19 32 40 48 44
Mean number of teeth with caries experience 3.4 2.4 1.9 1.5 1.6
18-year-olds
Percent examined of the age group 72 80 78 70 73
Caries free (%) 1 7 11 16 16
Mean number of teeth with caries experience 10.3 7.4 6.5 5.1 4.9
The data show that the percentages of caries free individuals had increased, and that the mean numbers of teeth with caries experience had decreased since 1985. It also pointed to a levelling out in the mean number of teeth with caries experience. There are discrepancies in
the mean number of teeth with caries experience reported for 5-year-olds 1985-2000, compared to the reports of dmft from Haugejorden and Birkeland (2002, 2005). When looking on Statistics Norway’s reports from the different counties, all counties report zero for all three variables for 5-year-olds in 1985-2000. This indicates that the mean caries experiences of zero are due to a lack of report in the database these years.
Sweden
Since 1985, the Swedish National Board of Health and Welfare annually reports on oral health for children and adolescents (Socialstyrelsen 2006), using different indicators for different age groups. Results on caries trends for 3-, 6-, 12- and 19-year-olds, from 1985 to 2005 in 5-year-intervals are presented in table 6.
Table 6. Caries prevalence in 3-, 6-, 12-, and 19-year-olds in Sweden, in 1985, 1990, 1995, 2000, and 2005.
Data from Socialstyrelsen 2006.
1985 1990 1995 2000 2005 3-year-olds Caries free (%) 83 91 93 94 95 6-year-olds Caries free (%) 45 60 65 70 73 12-year-olds DFT 1 3.1 2.0 1.4 1.0 1.0 Caries free (%) 2 22 40 50 61 58 19-year-olds DFT 3 8.5 6.3 5.1 3.6 3.1
Caries free, approximally (%) 4 36 50 56 58 59
DFS-a 5 3.3 2.0 1.6 1.4 1.3
DFS-a (caries free approximally excluded)5 5.3 3.9 3.2 3.4 3.2 1 Nr of county councils that reported data: 1985: 15, 1990: 21, 1995: 22, 2000: 19, and 2005: 16
2 Nr of county councils that reported data: 1985: 15, 1990: 22, 1995: 22, 2000: 19, and 2005: 16 3 Nr of county councils that reported data: 1985: 23, 1990: 25, 1995: 25, 2000: 20, and 2005: 16 4 Nr of county councils that reported data: 1985: 23, 1990: 25, 1995: 23, 2000: 20, and 2005: 16 5 Nr of county councils that reported data: 1985: 23, 1990: 25, 1995: 26, 2000: 20, and 2005: 16
Since 2000, the increase in percent units in percentage of children free from caries was one for 3-year-olds, and three for 6-year-olds. The 2005 data encompassed 57% of all 3-year-olds in the country, and 58% of all 6-year-olds. There were only minor variations between the counties regarding percentage of caries free 3-year-olds (93-98%). The variations between counties regarding 6-year-olds were slightly larger (64-79%) (Socialstyrelsen 2006).
For 12-year-olds, there has been a three percent unit decrease in the percentage of caries free since 2000, when the percentage of caries free was 61%. There was no change in mean decayed and filled teeth (DFT) from 2000 to 2005. In 2005, there were slight variations in percentage of caries free (50-69%) and in mean DFT (0.6-1.3) between the counties. The study population was 59% of all 12-year-olds in the country (Socialstyrelsen 2006).
For 19-year-olds, 25% of the subjects were free from caries in 2005. The variation between counties was 18-33%. The decrease in mean DFT between 2000 and 2005 was 0.5, and the variation between counties in 2005 was 2.4 – 3.6. Turning to mean number of decayed and filled approximal surfaces (DFS-a) - surfaces that are next to another tooth - the increase was 0.7 percent units since 2000, and the variation between counties in 2005 was 54-68%. The decrease in the mean DFS-a from 2000 to 2005 was 0.1, and the variation between counties in 2005 was 0.8-1.7. The mean DFS-a excluding subjects without approximal caries had a decrease of 0.2 from 2000 to 2005. The study population was 64% of all 19-year-olds in the country (Socialstyrelsen 2006).
The Swedish National Board also reported on the distribution of 12-year-olds regarding different DFT scores. The distribution showed that though there had been a decline over the years, there were still children in high need of oral health care. In 2005, 58% of the 12-year-olds had no caries at all, while 28% had DFT scores between 1 and 2. DFT scores of 3-4 were found in 10%, and the remaining 4% had DFT scores of 5 or more (Socialstyrelsen 2006).
A similar pattern was found regarding approximal caries in 19-year-olds. In 2005, 59% were caries free, while 29% had DFS-a scores of 1-3. DFS-a scores of 4-6 were found in 7%, and the remaining 5% had DFS-a scores of 7 or more (Socialstyrelsen 2006).
Discussion
Although interpretations should be cautious, there are indications of similar trends in caries prevalence in the Nordic countries. There has been a continuing decrease in caries prevalence during the past 20-30 years, with tendencies of a levelling out at the turn of the century. At the same time, the percentages of caries free children and adolescents in Finland and Sweden had increased. In Norway, an increase in caries prevalence was seen among 5-year-olds at the turn of the century, but the data from 2003 indicated a turn to decrease, which had continued 2006.
The WHO goal of a mean DMFT for 12-year-olds at 1.5 or below before the year 2020 (Petersen 2003), is already fulfilled in all four Nordic countries. However, from the data it seems there is still work to do to attain the goal of at least 80% caries free 6-year-olds in 2020.
The data from Denmark displayed differences in mean dmft/dmfs for 5-year-olds and DMFT/DMFS for 7-year-olds. Poulsen and Malling Pedersen noted: “caries in the primary dentition of 5 year old children seems to be under less control than caries in the permanent dentition of older children.” (2002, p. 198). A similar pattern was displayed in the data from Finland: 5-year-olds had higher dmft-scores than 6-year-olds.
The available national data on children and adolescents only portray average tendencies, but information regarding distribution of different scores from Denmark (DMFS) and Sweden (DMFT) also depict that there still are children and adolescents in high need of dental care. So, even if the mean scores of the entire age groups are encouraging, there is still more work to be done for the individuals that need it most. In Sweden, the National Board of Health and Welfare monitors the high-risk groups with the Significant Caries Index (SiC) (Socialstyrelsen 2006). “SiC Index is calculated by taking the mean DMFT of the one-third of the individuals having the highest of DMFT values in a given population.” (Nishi et al 2002, p. 296). In 2005, the SiC for 12-year-olds was 2.87, which means that the WHO goal of SiC below 3.0 DFT for this age group in the year 2015 (Socialstyrelsen 2006) was fulfilled.
The available data do not distinguish socio-economic patterns such as differences between urban and rural areas. There is some information on variations between counties, but without knowledge of, for example, number of inhabitants in the county or accessibility to dental care, the information does not provide indications on socio-economic patterns.
Regarding ethnic and socio-economic differences, Haugejorden & Birkeland addressed the issues (2002, 2005). However, the background data were not collected for the children of the study as they are based on aggregated data, which makes the analyses and findings questionable.
Adults
Caries prevalence
In this section, data concerning caries prevalence and experience in adults will be presented for Denmark and Finland. As to our knowledge, there are no recent national data from Norway or Sweden.
Denmark
In Denmark, a study on oral health studied a national sample of 762 adults 35-44-years of age (Krustrup & Petersen 2006, Krustrup 2004). Results regarding DMFS and DMFT are presented in table 7. Significant differences were found for missing surfaces/teeth: women had more missing surfaces and teeth than men did (Krustrup 2004).
Table 7. Average caries experience according to gender. P-values for gender differences. Data from Krustrup
2004. DS MS FS DMFS DT MT FT DMFT 35-44-year-olds Men (n=343) 1.2 17.5 27.0 45.7 0.6 3.5 12.6 16.7 Women (n=419) 0.8 20.7*** 25.8 47.3 0.4 4.1** 12.1 16.6 Total (n=762) 0.9 19.3 26.4 46.6 0.5 3.9 12.3 16.7 ** p<0.01; *** p<0.001 Finland
The Finnish Health 2000 Health Examination Survey reports on average number of sound, filled, decayed and chipped teeth in relation to gender and age group, from a national sample of 3,027 subjects (Vehkalahti, Varsio & Hausen 2004). The results are presented in table 8.
Table 8. Average number of sound, filled, decayed and chipped teeth in relation to gender and age group. Total
n=3,027, but results for adults 65 years or over are not presented. Data from Vehkalahti, Varsio & Hausen 2004. Sound Filled, no decay Decay Chipped, no Nr. of teeth, total
30-34-year-olds Men 16.9 10.5 1.0 0.2 28.6 Women 16.9 10.8 0.3 0.1 28.1 45-54-year-olds Men 8.9 12.0 1.2 0.3 22.4 Women 7.5 14.6 0.5 0.3 22.9
In a baseline report from The Health 2000 Health Examination Survey, caries prevalence was examined in age groups (Nordblad et al 2004b). Here, caries prevalence distribution is only presented for 30-34 and 45-54-year olds. Among 30-34-year old men, 29% had caries activity. Among women the same age, caries activity was found in 17.3%. In the male 45-54-year-olds, 31% had caries, and 20% of the women. Collapsing all the age groups (30-64-years old) to study gender differences, a significant difference was found among men and women. Among men 30-64-years old, 30% had caries prevalence, compared to 20% of the women (p<0.001) (Nordblad et al 2004b). “Results were tabulated as means or prevalences using SUDAAN procedures that take into account the sampling design.” (Aromaa et al 2004, p. 21).
Norway
As to our knowledge, there are no recent national clinical data on caries among adults in Norway. There are regional studies (e.g. Skudutyte-Rysstad & Eriksen 2007, Holst et al 2004), but since they are geographically limited, the results should not be generalized to depict the oral health of adults in the entire country. The lack of national clinical data on
adults has been pointed out in national reports about dental care in Norway (Sosial- og helsedirektoratet 2007, NOU 2005:11).
Sweden
As to our knowledge, there are no recent national clinical data on caries among adults in Sweden. There are regional studies (e.g. Hugosson et al 2005, Wänman et al 2004, Uhrbom & Bjerner 2003), but since they are geographically limited, the results should not be generalized to depict the oral health of adults in the entire country. The lack of national clinical data has been pointed out in a recent national report about dental care in Sweden (SOU 2007:19). Socio-economic differences in relation to caries prevalence
Annual income
Denmark
Caries experience was studied in relation to annual income (in Danish crowns; DKK), see table 9. Mean DMFS/DMFT, as well as decayed and missing surfaces and teeth, for adults with a personal annual income of less than 200,000 DKK was higher than for the other income groups (Krustrup 2004). In the other income groups, the variations were small and insignificant, according to analyses of variance (ANOVA).
Table 9. Average caries experience according to annual income. P-values for differences between annual income
levels. Data from Krustrup 2004.
DS MS FS DMFS DT MT FT DMFT 35-44-year-olds < 200,000 (n=190) 1.9*** 22.5*** 26.2 50.6** 1.0*** 4.6*** 11.9 17.5* 200-299,999 (n=337) 0.7 18.9 26.4 46.0 0.4 3.8 12.6 16.9 300-399,999 (n=120) 0.6 18.2 26.2 45.0 0.3 3.7 12.0 16.0 ≥ 400,000 (n=86) 0.4 15.6 25.1 41.1 0.4 3.1 12.0 15.5 Total (n=733) 1.0 19.3 26.2 46.5 0.5 3.9 12.3 16.7 * p<0.05; ** p<0.01; *** p<0.001 Education Denmark
The different levels of education were defined as: low - 10 years or less, medium - 11-12 years, high - 13-14 years and very high education was 15 years or higher. The results regarding caries experience in relation to educational level and age group are presented in table 10.
Table 10. Average caries experience according to educational level. P-values for differences between education
level. Data from Krustrup 2004.
DS MS FS DMFS DT MT FT DMFT 35-44-year-olds Low (n=62) 2.2*** 27.2*** 28.2*** 57.5*** 1.1*** 5.6*** 13.2** 19.9*** Medium (n=158) 1.5 20.6 27.3 49.4 0.8 4.2 12.3 17.3 High (n=299) 0.9 19.2 28.2*** 48.3 0.5 3.9 12.9 17.3 Very high (n=193) 0.4 16.5 22.6 39.5 0.2 3.3 11.3 14.8 Total (n=712) 1.0 19.5 26.5 47.0 0.5 3.9 12.4 16.8 ** p<0.01; *** p<0.001
There were differences in mean DMFS and DMFT in relation to educational level. Individuals with low education had a significantly higher mean DMFS/DMFT. They also had significantly higher means of decayed, missing and filled surfaces and teeth (Krustrup 2004). However, those with high education had the same mean of filled surfaces as the low educated, which also was significantly different from the other educational levels.
Finland
In Finland, the educational levels were defined as follows: “Persons who had no vocational training beyond a vocational course or on the job training and who had not taken the matriculation examination, were classified as having a basic education. Completion of vocational school was defined as secondary education regardless of basic education. Also those who had passed the matriculation examination but who had no vocational training beyond a vocational course or on the job training were also classified into this intermediate group. Higher education comprised degrees from higher vocational institutions, polytechnics and universities.” (Martelin et al 2004, p.27). Caries prevalence in Finland, in relation to education age group and gender are presented in table 11. No tests of significance were conducted, but high-educated subjects had less caries than secondary or basic educated subjects. The result was consistent for both men and women, and for all age groups (Vehkalahti, Varsio & Hausen 2004).
Table 11. Average number of sound, filled and decayed teeth in relation to education, gender and age group.
Total n=3,027, but results for adults 65 years or over are not presented. Data from Vehkalahti, Varsio & Hausen 2004.
Sound teeth Filled teeth Decayed teeth Education Education Education
Basic Secondary High Basic Secondary High Basic Seconda High
30-34-year-Men 16.0 16.6 17.7 10.6 10.7 10.1 1.2 1.2 0.6 Women 15.0 16.5 17.4 11.5 11.0 10.6 1.2 0.4 0.2 45-54-year-Men 8.0 9.1 9.6 9.4 12.3 15.0 1.6 1.3 0.7 Women 6.7 7.3 8.4 12.4 14.3 16.7 0.6 0.6 0.5 Occupation Denmark
Results regarding average caries experience according to occupational level are presented in table 12. There was a difference in mean DMFS/DMFT according to occupation: unskilled workers had a significantly higher mean DMFS/DMFT than the other occupational groups. Looking at decayed, missing and filled surfaces and teeth, there were also differences. Skilled workers had a higher means of filled surfaces/teeth and pensioners had higher means of decayed and missing surfaces/teeth (Krustrup 2004).
Table 12. Average caries experience according to occupation. P-values for differences between occupation
levels. Data from Krustrup 2004.
DS MS FS DMFS DT MT FT DMFT 35-44-year-olds Self-employed (n=61) 0.7 17.8 28.9 47.4 0.6 3.6 12.9 17.1 Staff members (n=457) 0.5 17.7 25.4 43.6 0.3 3.6 12.1 15.9 Skilled workers (n=57) 1.2 18.3 30.6* 50.1 0.7 3.7 14.1* 18.4 Unskilled workers (n=100) 1.5 24.3 28.4 54.2*** 0.8 4.9 13.0 18.7*** Unemployed (n=21) 1.9 22.7 24.7 49.3 1.1 4.6 12.1 17.8 Pensioners (n=29) 3.8*** 24.6*** 25.0 53.4 1.7*** 5.0*** 11.5 18.2 Total (n=725) 0.9 19.1 26.5 46.5 0.5 3.9 12.4 16.8 * p<0.05; *** p<0.001
Caries prevalence and differences between living areas
Denmark
Living areas were defined as: rural - less than 10 000 inhabitants, periurban - 10 000 to 30 000 inhabitants, and urban areas - more than 30 000 inhabitants (Krustrup 2004). Caries experience in relation to age groups and living area is presented in table 13.
Table 13. Average caries experience according to living area. P-values for differences between living areas.
Data from Krustrup 2004.
DS MS FS DMFS DT MT FT DMFT 35-44-year-olds Rural (n=245) 1.1 20.1 27.5 48.7 0.6 4.1 12.8* 17.5** Periurban (n=179) 0.8 19.5 26.1 46.4 0.5 4.0 12.5 16.9 Urban (n=338) 0.9 18.6 25.7 45.2 0.5 3.8 11.9 16.1 Totalt (n=762) 0.9 19.3 26.4 46.6 0.5 3.9 12.3 16.7 * p<0.05; ** p<0.01
There were differences in mean DMFT in relation to living area: rural areas had a higher mean DMFT than urban and periurban areas. Rural areas also had a higher mean of filled teeth (Krustrup 2004).
Discussion, caries prevalence
The data from Denmark showed that women had significantly more missing surfaces and teeth than men (Krustrup 2004). There were no significant differences in mean DMFS or DMFT. In Finland, caries was more prevalent among men than women (Nordblad et al 2004b).
Although comparisons and interpretations should be cautious, there seemed to be a different pattern in decayed teeth in Denmark, compared to Finland. While 35-44-year-old Danish men and women had similar mean DT: 0.6 for men and 0.4 for women, Finnish men had higher means of decayed teeth compared to the women in the same age groups. Among the Finnish 30-34-year-olds, men had a mean DT of 1.0, while women had a mean of 0.3, while men had a mean DT of 1.2, and women one of 0.5, among the 45-54-year-olds. Thus, the Finnish men had more than the double caries experience than Finnish women. The finding is interesting, but cannot be explained from the available clinical data. Overall, it seems that decay was similar among Danish and Finnish women, while there were differences between Danish and Finnish men.
Regarding filled teeth, there seemed to be similar patterns between men and women in Denmark, and between 30-34-year-old men and women in Finland. However, among the Finnish 45-54-year-olds, women had on average more than two more filled teeth than men.
Comparing the countries, the Danish 35-44-year-old men had higher means of filled teeth than the Finnish 30-34- and 45-54-year-old men. The Danish 35-44-year-old women, on the other hand, had a higher mean of FT than 30-34-year-old Finnish women, but a lower mean than the Finnish 45-54-year-old women. The differences between the Danish 35-44-year-olds and the Finnish 45-54-year-olds is interesting, but cannot be explained by the available clinical data. Further, interpretations about the differences between the countries regarding filled teeth should be cautious. Different age groups were studied in Denmark and Finland, and differences may reflect that prevalence in filled teeth is cumulative with age. The differences may also be an indication of different care utilization frequencies in the countries.
Regarding socio-economic differences, the only key indicator allowing for comparison was education. In Denmark, educational level was found to be significantly associated with caries experience: “relatively high caries index components as well as high means of DMF-S and DMF-T were found in participants with low education” (Krustrup 2004, p. 65). In
Finland, “untreated caries was more common in people with a lower level of education.” (Nordblad et al 2004b, p. 65). Although comparisons should be cautious, similar patterns were found in both countries. High-educated participants had lower means of decayed teeth than middle/secondary and low/basic educated. In Danish 35-44-year-olds and Finnish 30-34-year-olds, high-educated also had lower means of filled teeth. However, high-educated Finnish 45-54-year-olds had higher means of filled teeth than middle/secondary and low/basic educated. One should bear in mind that filled teeth rather mirrors history of care utilization than the actual caries situation. The findings are concordant with the general notion that there is a positive association between level of education and oral health.
Regarding the socio-economic indicators of annual income and occupational level, data were only available for Denmark. The findings regarding income were that “untreated decayed and missing surfaces/teeth as well as the total scores of DMF-S and DMF-T were high in the low income group.” (Krustrup 2004, p.65). Regarding occupation, “staff members had lower D-S/D-T and M-S/M-T-values whereas pensioners had significantly higher scores of D-S/D-T and M-S/M-T. Unskilled workers, unemployed persons and pensioners had high M-S and M-T components compared to the other occupation groups whereas the mean number of filled surfaces/teeth was significantly high among the skilled workers. The total DMF-S and total DMF-T were relatively low for staff members and significantly high in the unskilled workers group.” (Krustrup 2004, p.65)
There were no data on ethnic differences in caries prevalence in the material.
There was only material on differences between urban and rural living areas from Denmark, where participants from rural areas had significantly higher means of filled teeth and DMFT, than those from urban and periurban areas (Krustrup 2004).
A recommendation for the future is to conduct more national studies of caries prevalence in adults. Further, national clinical studies should also focus on socio-economic and ethnic differences, as well as differences in relation to living areas.
Periodontal conditions
In this section, data concerning periodontal conditions in adults will be presented for Denmark and Finland. As to our knowledge, there are no recent national data from Norway or Sweden.
Denmark
From Denmark, there are several reports from the same study of adults’ oral health. Here, results will be presented from an article (Krustrup & Petersen 2006) and a thesis (Krustrup 2004). The Community Periodontal Index was used to assess periodontal conditions (gingival bleeding, calculus and gingival pockets) for all teeth present (Krustrup & Petersen 2006, Krustrup 2004). Krustrup and Petersen (2006) found that a higher percentage of women had healthy conditions (10.7 vs. 4.1, p<0.001) and a higher percentage of men had bleeding (91% vs. 81%, p<0.001). There were no gender differences regarding pockets. Pockets 4-5 mm were found in 36% of both the men and the women, and in both genders 6% had pockets 6 mm or deeper (Krustrup & Petersen 2006).
A gender difference was found for mean percentage of teeth with bleeding: men had a higher mean percentage of teeth with bleeding (30%) than women did (22%), p<0.001. No significant gender differences were found in pockets, a mean of 6% of teeth with pockets 4-5 mm was found in the total group, and 1% with pockets ≥ 6 mm. Men had a mean of 7% teeth with shallow pockets (4-5 mm), and 1% with pockets 6 mm or deeper. Women had a mean of 5% teeth with shallow pockets and 1% teeth with deep pockets (Krustrup & Petersen 2006).
Krustrup (2004) also examined mean nr of sextants with certain CPI scores. In total, a mean of 2.4 sextants had healthy conditions, 3.6 had bleeding or higher, 1.6 had calculus or higher, 0.9 had shallow pockets or higher, and deep pockets were found in a mean of 0.1 sextants. Significantly more healthy sextants were found in women (2.7 vs. 2.0, p<0.001), while more sextants with bleeding or higher (4.0 vs. 3.3, p<0.001), as well as calculus or higher (1.7 vs. 1.4, p<0.01), were found in men (Krustrup 2004).
Loss of attachment (LA), loss of bone and periodontal ligaments around the tooth’s root was also studied (Krustrup & Petersen 2006, Krustrup 2004). No gender differences were found. A LA of 0-3 mm was found in 80% of the total group, 19% had LA 4-5mm, and 1% had a LA of 6-8 mm (Krustrup & Petersen 2006).
Finland
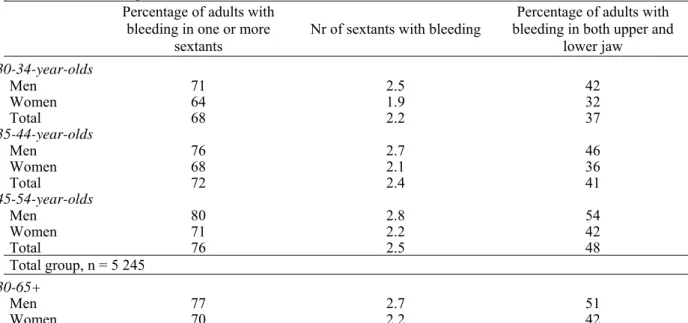
In the Health 2000 Health Examination Survey, periodontal conditions were examined by measuring inflammation (bleeding on probing) in sextants and depth of gingival pockets. The results regarding prevalence of gingival bleeding according to age group and gender are presented in table 14.
Table 14. Prevalence of gingival bleeding in dentate adults. Total n=5,245, but results for adults 55-64, and 65
years or older are not presented. Data from Knuuttila 2004. Percentage of adults with
bleeding in one or more sextants
Nr of sextants with bleeding bleeding in both upper and Percentage of adults with lower jaw 30-34-year-olds Men 71 2.5 42 Women 64 1.9 32 Total 68 2.2 37 35-44-year-olds Men 76 2.7 46 Women 68 2.1 36 Total 72 2.4 41 45-54-year-olds Men 80 2.8 54 Women 71 2.2 42 Total 76 2.5 48 Total group, n = 5 245 30-65+ Men 77 2.7 51 Women 70 2.2 42
Of the total sample, 74% had one or more sextants with bleeding on probing, and bleeding in both upper and lower jaw was found in 46% of the subjects. The mean number of sextants with bleeding was 2.4. A lower percentage of women had one or more sextants with bleeding, as well as bleeding in both upper and lower jaw. Women also had a lower average number of sextants with bleeding (Knuuttila 2004).
Turning to depth of pockets, results regarding age group and gender are presented in table 15. Of the total sample, 64% of the adults had pockets ≥ 4 mm and 21% had pockets ≥ 6 mm. There was a consistent pattern between men and women in the age groups. A higher percentage of men had pockets ≥ 4 mm, as well as pockets ≥ 6 mm (Knuuttila 2004).
Turning to mean number of teeth with shallow and deep pockets, also presented in table 15, the average number of teeth with pockets ≥ 4 mm in the total sample was 4.2, and for pockets ≥ 6 mm it was 0.7. Men had a higher average number of teeth with pockets ≥ 4 mm than women did. However, women had a higher average number of teeth with pockets ≥ 6 mm (Knuuttila 2004).
Table 15. Percentage of adults, and average number of number of teeth with periodontal pockets 4 or 6 mm or
deeper. Total n=5,255, but results for adults 55-64, and 65 years or older not presented. Data from Knuuttila 2004.
Percentage of adults with periodontal
pockets Average number of teeth with periodontal pockets Pockets ≥ 4 mm Pockets ≥ 6 mm Pockets ≥ 4 mm Pockets ≥ 6 mm
30-34-year-olds Men 56 8 3.4 0.1 Women 40 4 2.0 0.2 Total 48 6 2.7 0.2 35-44-year-olds Men 69 19 4.9 0.2 Women 52 10 2.8 0.6 Total 61 14 3.9 0.4 45-54-year-olds Men 76 30 6.2 0.5 Women 62 17 3.6 1.1 Total 69 24 4.9 0.8 Total group, n= 5 255 30-65+ Men 72 26 5.3 0.4 Women 57 16 3.2 0.9
Turning to the distribution in Finnish men and women regarding number of teeth with periodontal pockets ≥ 4 mm, no teeth with periodontal pockets were found in 28% of the men and 43% of the women. Nineteen percent of the men had 1-2 teeth with pockets, and 20% of the women. Three to seven teeth with pockets were found in 25% of the men and 22% of the women, while eight or more teeth with pockets were found in 28% of the men and 15% of the women (Knuuttila 2004).
In the previous report from The Health 2000 Health Examination Survey, pockets ≥ 4 mm were examined in age groups (Nordblad et al 2004b). Here, distribution is only presented for 30-34, and 45-54-year olds. Among 30-34-year old men, 65% had pockets ≥ 4 mm. Among women the same age, pockets were found in 48%. In the 45-54-year olds, 76% pockets ≥ 4 mm, and 62% of the women. Collapsing all age groups to study gender differences, a significant difference was found among men and women. Among men 30-64-years old, 71% had pockets ≥ 4 mm, against 56% of the women (p<0.001). (Nordblad et al 2004b).
Norway
As to our knowledge, there are no recent national clinical data on periodontal conditions among adults in Norway. There are regional studies (e.g. Holst et al 2004), but since they are geographically limited, the results should not be generalized to depict the oral health of adults in the entire country. The lack of national clinical data on adults has been pointed out in national reports about dental care in Norway (Sosial- og helsedirektoratet 2007, NOU 2005:11).
Sweden
As to our knowledge, there are no recent clinical data on periodontal conditions among adults in Sweden. There are regional studies (e.g. Hugosson et al 2005, Wänman et al 2004, Uhrbom & Bjerner 2003), but since they are geographically limited, the results should not be generalized to depict the oral health of adults in the entire country. The lack of national clinical data has been pointed out in a recent national report about dental care in Sweden (SOU 2007:19).
Socio-economic differences in relation to periodontal conditions Annual income
Denmark
There were no differences in mean percentage of teeth with periodontal conditions, according to income levels (Krustrup & Petersen 2006), see table 16.
Table 16. Mean percentage of teeth with periodontal conditions in relation to annual income. Data from
Krustrup & Petersen 2006
Bleeding Pockets 4 – 5 mm Pockets ≥ 6 mm
35-44-year-olds
< 200,000 (n=190) 27.8 6.9 1.8 200-299,999 (n=337) 24.9 5.6 1.0 300-399,999 (n=120) 25.4 5.6 0.9 ≥ 400,000 (n=86) 21.5 3.6 3.1
There were neither any differences in percentage of adults with loss of attachment, according to income levels (Krustrup & Petersen 2006), see table 17.
Table 17. Percentage of adults with loss of attachment in relation to annual income. Data from Krustrup &
Petersen 2006 LA 0-3 mm LA 4-5 mm LA 6-8 mm LA 9-11 mm 35-44-year-olds < 200,000 (n=190) 78.4 21.1 0.5 0.0 200-299,999 (n=337) 80.7 18.4 0.9 0.0 300-399,999 (n=120) 82.5 16.7 0.8 0.0 ≥ 400,000 (n=86) 79.1 20.9 0.0 0.0 Education Denmark
There were differences in mean percentage of teeth with periodontal conditions according to educational level, see table 18. Low educated adults had higher mean percentages of teeth with bleeding, pockets 4-5 mm and pockets 6 mm or deeper (Krustrup & Petersen 2006).
Table 18. Mean percentage of teeth with periodontal conditions in relation to education. P-values for differences
between education levels. Data from Krustrup & Petersen 2006
Bleeding Pockets 4 – 5 mm Pockets ≥ 6 mm
35-44-year-olds Low (n=62) 35.5* 10.7** 4.5*** Medium (n=158) 29.9 9.9 2.0 High (n=299) 23.6 4.4 0.6 Very high (n=193) 21.2 3.6 0.3 * p<0.05; ** p<0.01; *** p<0.001
There were no differences in percentage of adults with loss of attachment, according to education (Krustrup & Petersen 2006), see table 19.
Table 19. Percentage of adults with loss of attachment in relation to education. Data from Krustrup & Petersen
2006 LA 0-3 mm LA 4-5 mm LA 6-8 mm LA 9-11 mm 35-44-year-olds Low (n=62) 71.0 25.8 3.2 0.0 Medium (n=158) 82.3 17.7 0.0 0.0 High (n=299) 79.6 19.7 0.7 0.0 Very high (n=193) 81.3 18.1 0.5 0.0
Finland
As to education, there were socio-economic differences in Finland regarding pockets ≥ 4 mm and ≥ 6 mm. Results for age groups 30-34, 35-44, and 45-54-year-olds, and for total group 30-65-years or older, are presented in tables 20 and 21. In all age groups, high-educated men and women had lower means of teeth with pockets ≥ 4 mm. The same pattern was found for pockets ≥ 6 mm, except for high-educated women 30-34-years old. They had a slightly higher mean of teeth with deep pockets (Knuuttila 2004).
Table 20. Percentage of men and women with periodontal pockets 4 or 6 mm or deeper, according to education,
gender and age group. Total n=5,255, but results for adults 55-64, and 65 years or older not presented. Data from Knuuttila 2004.
Pockets ≥ 4 mm Pockets ≥ 6 mm
Education Education
Total Basic Secondary High Total Basic Secondary High
30-34-year-olds Men 56 - 59 48 8 - 11 3 Women 40 - 47 36 4 - 6 3 35-44-year-olds Men 69 72 72 61 19 29 22 8 Women 52 54 55 50 10 12 14 5 45-54-year-olds Men 76 75 78 75 30 37 32 20 Women 62 62 57 65 17 19 21 12 Total group, n = 5 255 30-65+ Men 71 73 73 68 26 33 26 19 Women 57 59 57 56 16 19 17 11
Table 21. Mean number of teeth with periodontal pockets 4 or 6 mm or deeper, according to education, gender
and age group. Total n=5,255, but results for adults 55-64, and 65 years or older not presented. Data from Knuuttila 2004.
Pockets ≥ 4 mm Pockets ≥ 6 mm
Education Education
Total Basic Secondary High Total Basic Secondary High
30-34-year-olds Men 3.4 - 3.9 2.2 0.2 - 0.2 0.1 Women 2.0 - 2.4 1.7 0.1 - 0.1 0.2 35-44-year-olds Men 4.9 6.6 5.4 3.0 0.6 1.0 0.8 0.2 Women 2.8 3.1 3.9 2.3 0.2 0.3 0.3 0.1 45-54-year-olds Men 6.2 6.9 6.0 5.5 1.1 1.2 1.2 0.7 Women 3.6 3.8 3.6 3.3 0.5 0.6 0.7 0.3 Total group, n = 5 255 30-65+ Men 5.3 5.7 5.5 4.4 0.9 1.1 0.9 0.7 Women 3.2 3.4 3.4 4.4 0.4 0.6 0.5 0.3
Periodontal conditions and differences in living areas
Denmark
There were no differences in mean percentage of teeth with periodontal conditions, according to living area (Krustrup & Petersen 2006), see table 22.
There were neither any differences in percentage of adults with loss of attachment, according to living area (Krustrup & Petersen 2006), see table 23.
Table 22. Mean percentage of teeth with periodontal conditions in relation to living area. Data from Krustrup &
Petersen 2006
Bleeding Pockets 4 – 5 mm Pockets ≥ 6 mm
35-44-year-olds
Rural (n=245) 28.3 6.4 1.6
Periurban (n=179) 25.0 6.0 0.7
Urban (n=338) 23.7 5.3 0.1
Table 23. Percentage of adults with loss of attachment in relation to living area. Data from Krustrup & Petersen
2006 LA 0-3 mm LA 4-5 mm LA 6-8 mm LA 9-11 mm 35-44-year-olds Rural (n=245) 81.6 17.6 0.8 0.0 Periurban (n=179) 79.3 20.7 0.0 0.0 Urban (n=338) 79.3 19.8 0.9 0.0
Discussion, periodontal conditions
In Denmark, bleeding was found in about one fourth of the teeth. One third of the 35-44-year-olds had at least one shallow pocket as the most severe sign of periodontal disease, while deep pockets were found in about 6% (Krustrup & Petersen 2006). In Finland, at least one pocket 4 mm or deeper were found in one out of two women, and two out of three men 30-44-years old (Nordblad et al 2004b).
The ways of presenting the results regarding bleeding were somewhat different in Denmark and Finland, which complicates comparisons between the countries. However, the results from the individual countries indicate similar patterns. The results from Denmark showed that bleeding was widespread in the population of 35-44-year-olds, and that it was significantly more common among men (91%) than women (81%). The results from Finland pointed to the same direction. Bleeding in one or more sextants was found in 76% of the male 35-44-year-olds, and in 68% of the women. It should be noted that bleeding, as an indicator of inflammation (gingivitis) is much debated as to whether it is a disease entity in itself, as well as having a role in the development of periodontitis (Sheiham & Netuveli 2002). It might instead represent a healthy defensive reaction against prevalence of bacteria.
Regarding pockets, there also seems to be similar patterns in Denmark and Finland, with deep pockets being less common than shallow ones. In Denmark, shallow pockets (4-5 mm) were found in 36% of the 35-44-year-old population, while pockets 6 mm or deeper were found in 6%. The distributions among men and women were similar. In Finland, pockets 4 mm or lower were found in 61% of the 35-44-year-olds. Deep pockets, 6 mm or deeper, were found in 14% of the 35-44-year-olds. The descriptive figures showed that both shallow and deep pockets were more common among men than women. Although interpretations should be cautious, it seems as both shallow and deep pockets are more common in Finland than in Denmark.
There was only material from Denmark on loss of attachment. Loss of attachment 3 mm or less was found in 80% of the 35-44-year-olds. There were no gender differences (Krustrup & Petersen 2006).
Due to different ways of measuring and presenting the results regarding periodontal conditions in relation to education, comparisons between the countries are complicated. However, there seems to be similar trends in both countries. In Denmark, “the mean percentages of teeth with gingival bleeding, shallow or deep pockets were high among participants in the low education group.“ (Krustrup & Petersen 2006, p. 68). Further, the lowest mean percentages of teeth with bleeding, shallow and deep pockets were found among the high and very high educated. In Finland, lower percentages of high-educated men and
women had shallow and deep pockets. The mean numbers of teeth with pocket were generally also lower among the high educated than in those with lower educational levels.
There was only material on loss of attachment from Denmark. “High LA scores were indicated for lower educational groups among the younger adults, but this pattern was not statistically significant” (Krustrup & Petersen 2006).
Regarding the socio-economic indicators of annual income, data were only available for Denmark. No significant differences were found neither between different income levels and periodontal conditions, nor loss of attachment.
There was no data on ethnic differences in periodontal conditions in the material.
There was only material on differences between urban and rural living areas from Denmark. There were no significant differences, but higher mean percentages of teeth with bleeding, shallow and deep pockets were found among rural inhabitants. Regarding loss of attachment, similar distributions of 35-44-year-olds with loss of attachment 0-3, and 4-5 mm were found in all living areas. However, loss of attachment of 6-8 mm was not found at all in periurban areas, whilst rural and urban areas had similar distributions.
The findings are concordant with what Sheiham and Netuveli (2002) reported: “In Europe, whilst loss of bony support and loss of probing attachment is relatively common, low levels of advanced periodontal disease are reported in most of the representative populations studied” (2002, p. 107).
A recommendation for the future is clearly to conduct more national studies of periodontal conditions in adults. Further, national clinical studies should also focus on socio-economic and ethnic differences, as well as differences in relation to living areas.
General discussion and conclusions
There are indications of similar trends among the four Nordic countries regarding caries prevalence in children and adolescents. There has been a decrease in prevalence during the past 20 years, but the decrease seems to be levelling out. There is a lack of data on socio-economic and ethnic differences in caries prevalence in children and adolescents.
The main finding regarding both caries prevalence and periodontal conditions in adults is that there is a lack of national data from Norway and Sweden.
Although interpretations should be cautious, there are indications of slightly higher prevalence of caries in Finland, compared to Denmark, among the men. Data on educational level indicates similar patterns of associations between higher levels of education and lower figures of caries prevalence. There is a lack of data on ethnic differences in caries prevalence in adults. There is also a lack of data regarding differences between urban and rural living areas, which only were available for Denmark.
The results regarding periodontal conditions indicate that bleeding is common in both countries, and that both shallow and deep pockets seem to be more common in Finland than in Denmark. Data on educational level indicate similar patterns of associations between higher levels of education and lower prevalence of pockets. There is a lack of data on ethnic differences in periodontal conditions in adults. There is also a lack of data regarding differences between urban and rural living areas, which only were available for Denmark.
From the available data, no interpretations regarding aggressive periodontitis, i.e. rapid deterioration of bone loss and periodontal ligaments, or probability of developing it can be made.
The most important finding from this report is that there is a need for more national epidemiological summative assessments on the oral health of adults. National clinical research is needed in order to estimate what actions need to be taken to improve oral health. Without national assessments, political reforms cannot be evaluated and conclusions regarding their effectiveness cannot be drawn.
The task from Oral B was to answer a series of questions about the oral health in the Nordic countries of Denmark, Finland, Norway and Sweden, from existing national clinical data. The conclusions from this report are:
• Caries prevalence for children, adolescents and adults:
There has been a decrease in caries prevalence in children and adolescents that seems to be levelling out. Caries prevalence for adults need more research attention. There were only national data from Denmark and Finland. Although interpretations should be cautious, there are indications of slightly higher caries prevalence in Finland, compared to Denmark.
• Prevalence of gingivitis in the adult population:
This needs more research attention. There were only national data from Denmark and Finland. Differences in measuring and presenting results complicate intercountry comparison. However, there seems to be a similar trend with a high prevalence of bleeding in both countries.
• Prevalence of periodontitis and aggressive periodontitis in the adult population:
This needs more research attention, especially for people at risk. There were only data on shallow and deep pockets from Denmark and Finland, and only from Denmark on loss of attachment. Differences in measuring and presenting results complicate intercountry comparison. However, there seems to be a similar trend with shallow pockets being rather common, while deep pockets seem to be rather uncommon in the populations. In Denmark, a loss of attachment 4 mm or deeper was found in one fifth of the population 35-44-years old. There were no national data on aggressive periodontitis.
• Differences in caries, gingivitis and periodontitis between inhabitants living in urban and rural areas:
There were no national data on differences in caries prevalence between children and adolescents living in urban and rural areas. For adults, there were only national data from Denmark regarding caries prevalence and periodontal conditions. Differences in living areas were only found for caries prevalence: participants from rural areas had significantly higher means of DMFT and FT, than participants from periurban and urban living areas.
• Differences in caries, gingivitis and periodontitis between native inhabitants and ethnic minorities:
There were no national data on differences in caries prevalence in neither children, adolescents nor adults, in relation to ethnicity.
References:
1. Aromaa, A., Koskinen, S. & the project group, the working group for sampling, survey execution, data processing and analysis, the working group for the field health examination and other key persons in the respective organisations. (2004). Population and methods. In Arpo Aromaa & Seppo Koskinen (Eds). Health and Functional Capacity in
Finland. Baseline Results of the Health 2000 Health Examination Survey. Helsinki:
Publications of the National Public Health Institute (KTL), B12/2004
2. Fpa. [The Social Insurance Institution of Finland]. Tandvårdskostnader. Retrieved October, 2007, from www.fpa.fi In Swedish
3. Haugejorden, O. & Birkeland, J.M. Evidence for reversal of the caries decline among Norwegian children. International Journal of Paediatric Dentistry. 2002; 12: 306-315 4. Haugejorden, O. & Birkeland, J.M. Analysis of the ups and downs of caries experience
among Norwegian children aged five years between 1997 and 2003. Acta Odontologica
Scandinavica. 2005; 63: 115-122
5. Helse- og omsorgsdepartementet. [The Ministry of Health and Care Services, Norway]. Tannhelsetjenesten. Retrieved October, 2007, from www.regjeringen.no In Norwegian 6. Holst, D. Schuller, A.A. & Gimmestad, A. Changing dental health. From risk of disease to
oral health potential. Nor Tannlegeforen Tid. 2004; 114: 866-871. In Norwegian, with English summary
7. Hugoson, A., Koch, G., Göthberg, C., Nydell Helkimo, A., Lundin, S-Å., Norderyd, O., Sjödin, B. & Sondell, Katarina. Oral health of individuals aged 3-80 years in Jönköping, Sweden during 30 years (1973-2003). II. Review of clinical and radiographic findings.
Swedish Dental Journal. 2005; 29: 139-155
8. Knuuttila, M. (2004). Hampaiden kiinnityskudossairaudet. In Liisa Suominen-Taipale, Anne Nordblad, Miira Vehkalahti & Arpo Aromaa (Eds.). Suomalaisten Aikuisten
Suunterveys. Terveys 2000 – tutkimus. [Health 2000]. Helsinki: Publications of the
National Public Health Institute B16/2004. In Finnish, with English summary
9. Kravits, A.S., & Treasure, E.T. (2004). Manual of Dental Practice 2004. The Liaison Committee of the Dental Associations of the European Union
10. Krustrup, U. (2004). Clinical-epidemiological study of oral health among adults in
Denmark 2000/2001. Ph.D. Thesis. University of Copenhagen
11. Krustrup, U. & Petersen, P.E. Periodontal conditions in 35-44 and 65-74-year-old adults in Denmark. Acta Odontologica Scandinavica. 2006; 64: 65-73
12. Martelin, T., Nieminen, T. & the working group for living conditions. (2004). Sociodemographic factors and living conditions. In Arpo Aromaa & Seppo Koskinen (Eds). Health and Functional Capacity in Finland. Baseline Results of the Health 2000
Health Examination Survey. Helsinki: Publications of the National Public Health Institute
13. Nishi, M., Stjernswärd, J., Carlsson, P., & Bratthall, D. Caries experience of some countries and areas expressed by the Significant Caries Index. Community Dentistry and
Oral Epidemiology. 2002; 30: 296-301
14. Nordblad, A., Suominen-Taipale, L., Rasilainen, J. & Karhunen, T. (2004a). Suun terveydenhuoltoa terveyskeskuksissa 1970-luvulta vouteen 2000 [Oral Health Care at Health Centres from the 1970s to the year 2000]. Helsinki: National Research and Development Centre for Welfare and Health (STAKES), Reports 278. In Finnish, with English summary
15. Nordblad, A., Vehkalahti, M. & the working group for oral health. (2004b). Oral health. In Arpo Aromaa & Seppo Koskinen (Eds). Health and Functional Capacity in Finland.
Baseline Results of the Health 2000 Health Examination Survey. Helsinki: Publications of
the National Public Health Institute (KTL), B12/2004
16. NOU 2005:11. (2005). Det offentlige engasjement på tannhelsefeltet. Et godt tilbud til de
som trenger det mest. Norges offentlige utredninger. Statens forvaltningstjeneste
Informasjonsforvaltning. Oslo. In Norwegian
17. Petersen, P.E. Changing oral health profiles of children in Central and Eastern Europe – Challenges for the 21st century. IC Digest 2003; 2: 12-13. Available at www.who.int 18. Poulsen, S. & Malling Pedersen, M. Dental caries in Danish children: 1988-2001.
European Journal of Paediatric Dentistry. 2002; 3: 195-198
19. SCOR. Statistik 2006 børne- of ungdomstandpleieområdet – supertotal. Retrieved September, 2007, from www.sst.dk In Danish
20. Sheiham, A. & Netuveli, G.S. Periodontal diseases in Europe. Periodontology 2000. 2002; 29: 104-121
21. Skudutyte-Rysstad, R. & Eriksen, H.M. Changes in caries experience among 35-year-old Oslo citizens, 1973-2003. Acta Odontologica Scandinavica. 2007; 65: 72-77
22. Social- och Hälsovårdsministeriet. [The Ministry of Social Affairs and Health, Finland]. Tandvård. Retrieved October, 2007, from www.stm.fi In Swedish
23. Socialstyrelsen. (2006). Tandhälsan hos barn och ungdomar 1985-2005. Skrivelse. Socialstyrelsen: Stockholm. In Swedish
24. Sosial- og helsedirektoratet. (2007). Utviklingstrekk i helse- og sosialsektoren 2007. Oslo 2007. In Norwegian
25. SOU 2007:19. (2007). Friskare tänder - till rimliga kostnader. Slutbetänkande av Utredningen om ett nytt tandvårdsstöd för vuxna. Statens offentliga utredningar. Stockholm. In Swedish
26. Statistics Norway. Tabell 04163: Tannstatus, etter alder. Retrieved November, 2007, from
27. Sundhedsstyrelsen. [The National Board of Health, Denmark]. Børne- og ungdomstandpleje. Retrieved October, 2007, from www.sst.dk In Danish
28. Sundhedsstyrelsen. (2004). Tandplejens struktur og organisation. Rapport. København. 29. Uhrbom, E. & Bjerner, B. (2003). EpiWux03. Vuxnas mun- och tandhälsa i Dalarna,
utveckling och framtid. En undersökning avseende 35-, 50-, 65- och 75-åringar i Dalarna 2003. Skriftserie nr 75. Falun: Centrum för Oral Rehabilitering. In Swedish
30. Vehkalahti, M., Varsio, S. & Hausen, H. (2004). Hampaiden kunto. In Liisa Suominen-Taipale, Anne Nordblad, Miira Vehkalahti & Arpo Aromaa (Eds.). Suomalaisten
Aikuisten Suunterveys. Terveys 2000 – tutkimus. [Health 2000]. Helsinki: Publications of
the National Public Health Institute B16/2004. In Finnish, with English summary
31. Widström,E. & Eaton, K.A. Oral Healthcare Systems in the Extended European Union.
Oral Health & Preventive Dentistry. 2004; 2: 155-194
32. Widström, E., Ekman, A., Aandahl, L.S., Malling Pedersen, M., Agustsdottir, H. & Eaton, K.A. Developments in Oral Health Policy in the Nordic Countries Since 1990. Oral
Health & Preventive Dentistry. 2005; 3: 225-235
33. Widström, E. & Suominen-Taipale, L. (2006). Oral Diseases. In Seppo Koskinen, Arpo Aromaa, Jussi Huttunen & Juha Teperi (Eds.). Health in Finland. Helsinki: The National Health Institute (KTL), National Research and Development Centre for Welfare and Health (STAKES), Ministry of Social Affairs And Health
34. Wänman, A., Forsberg, H., Sjödin, L., Lundgren, P. & Höglund Åberg, C. (2004).
Tillståndet i mun och käkar bland Västerbottens vuxna befolkning år 2002. En rapport baserad på en epidemiologisk undersökning bland 35-, 50-, 65- och 75-åringar. Umeå:
List of tables
Table 1. Mean dmft/DMFT and mean dmfs/DMFS in 5-, 7-, 12-, and 15-year-olds in Denmark 1988 to 2006.
Table 2. Caries prevalence and mean ft/FT in 3-, 5-, 6-, 9-, 12-, 15-, and 18-year olds in Finland, from 1975 to 2000.
Table 3. Caries experience in 5-year-olds in Norway, in 1997 to 2000.
Table 4. Distribution (%) of caries prevalence (d3) in 5-year-olds in Norway, in 1997 to 2003.
Table 5. Caries prevalence in 5-, 12-, and 18-year-olds in Norway, in 1985 to 2006. Table 6. Caries prevalence in 3-, 6-, 12-, and 19-year-olds in Sweden, in 1985 to 2005. Table 7. Average caries experience in Denmark according to gender.
Table 8. Average number of sound, filled, decayed and chipped teeth in Finland, in relation to gender and age group.
Table 9. Average caries experience in Denmark according to annual income. Table 10. Average caries experience in Denmark according to educational level. Table 11. Average number of sound, filled and decayed teeth in Finland, in relation to education.
Table 12. Average caries experience in Denmark according to occupation. Table 13. Average caries experience in Denmark according to living area. Table 14. Prevalence of gingival bleeding in dentate adults in Finland.
Table 15. Percentage of adults in Finland, and average number of number of teeth, with periodontal pockets 4 or 6 mm or deeper.
Table 16. Mean percentage of teeth with periodontal conditions in Denmark, in relation to annual income.
Table 17. Percentage of adults in Denmark with loss of attachment in relation to annual income.
Table 18. Mean percentage of teeth with periodontal conditions in Denmark, in relation to education.
Table 19. Percentage of adults in Denmark with loss of attachment in relation to education. Table 20. Percentage of men and women in Finland with periodontal pockets 4 or 6 mm or deeper, according to level of education.
Table 21. Mean number of teeth with periodontal pockets 4 or 6 mm or deeper in Finland, according to level of education.
Table 22. Mean percentage of teeth with periodontal conditions in relation to living area in Denmark.
Table 23. Percentage of adults in Denmark with loss of attachment in relation to living area.
List of terms
Aggressive periodontitis: rapid deterioration of bone loss and periodontal ligaments Analysis of variance (ANOVA): statistical method of estimating if three or more different
groups values differ due to actual differences, or chance
Approximal caries: caries in the tooth’s surface that are next to another tooth
Bleeding: bleeding when probing the gingival tissue around the tooth is an indication of inflammation. An indicator of periodontal status.
Calculus: hardened bacterial cover on the tooth. An indicator of periodontal status.
Caries prevalence: the total number of accumulated caries lesions, expressed as the mean for a population (DMFS or DMFT)
Community Periodontal Index (CPI): The WHO’s recommended index for assessing periodontal conditions. Assessment of gingival bleeding, calculus and periodontal pockets d3: decay in dentine
defs: decayed, extracted, filled surfaces (temporary teeth) deft: decayed, extracted, filled teeth (temporary teeth) Dentine: the bone of the tooth
DFS-a: decayed, filled approximal surfaces DFT: decayed, filled teeth
dmfs/DMFS: decayed, missing, filled surfaces. Small letters used for temporary teeth (in children), capital letters used for permanent teeth
dmft/DMFT: decayed, missing, filled teeth. Small letters used for temporary teeth (in children), capital letters used for permanent teeth
Chipped teeth: teeth with a small piece missing Gingivitis: inflammation in the gums
Loss of attachment: loss of bone around the root of the tooth
p: probability, tells us the statistical probability that a value differing from another is due to an actual difference, and not chance. For example: p≤0.05 means that there was a 5% or less probability that the found difference was due to chance.
Periodontitis: inflammation in the attachment apparatus of the tooth, usually a destructive change leading to loss of bone and periodontal ligaments
Pockets: loss of periodontal ligament attached to the root of the tooth. Periodontal pockets are an indicator of periodontal status.
Significance: the statistical probability that a value differing from another is due to an actual difference, and not chance. Often reported as a probability, with a p-value, see above Sextant: grouping of teeth in three segments in each jaw