Masters Thesis
O
O
p
p
e
e
r
r
a
a
t
t
i
i
o
o
n
n
C
C
l
l
a
a
s
s
s
s
i
i
f
f
i
i
c
c
a
a
t
t
i
i
o
o
n
n
o
o
f
f
H
H
e
e
a
a
v
v
y
y
V
V
e
e
h
h
i
i
c
c
l
l
e
e
s
s
Lund Institute of Technology
Department of Industrial management and logistics
Fredrik Johansson 781102-4111
Abstract
Within Scania there is a need to classify vehicles depending on the prevailing operation conditions. Different vehicles are exposed to various loads and this will influence the need for R&M greatly. The systems that are presently used for classification purposes are subjective and the owner’s negotiation skills can affect the outcome. Simultaneously there is a lack of knowledge concerning the influence specific factors have on vehicle wear.
The goal with the project was to develop a method which could be used for classification, based on information that is possible to measure. Information which can be extracted from the engine control unit, which all vehicles are equipped with, served as a starting point. This type of data is commonly called operation data. Since a new classification, in order to be meaningful, must be based on factors which influence the need for R&M activity it became an important part of the project to identify such factors.
In order to investigate the connection between operation data and wear several different types of information were evaluated and used. In the initial analysis operation data was compared with warranty information but no link could be discovered. The conclusion was that warranty information is unsuitable for the evaluation of operation data. Warranty information mainly reflects problems which arise due to quality problems and not due to wear.
Problems caused by wear can be expected to develop over time. Hence, it is important to have access to R&M statistics which cover a rather longer period of time. The only source of information available within Scania which contain comprehensive R&M information is RAMAS, used by the market organisation to evaluate R&M contracts. Unfortunately it is in most cases not possible to access operation data from contract vehicles. A collection of such data has been initiated but an evaluation of the material was not possible to fit within the timeframe of the project. However, an analysis of the available material showed that there most likely is a connection between wear on certain parts of the drive train and fuel consumption.
The collection of operation information requires a coordinated strategy. Investigating why damage is initiated and how it propagates is important to identify crucial operation factors. A thorough analysis of operation data needs to be done and the connection between wear and fuel consumption must be verified. A classification system based on the influence of operation conditions will not be static but develop over time.
Sammanfattning
Inom Scania finns det ett behov av att klassificera fordon efter rådande driftförhållanden. Olika fordon utsätts för väldigt skilda belastningar och detta påverkar behovet av reparationer och service. De system som i nuläget används för klassificering är subjektiva och grunder sig mycket på uppgifter från fordonets ägare. Samtidigt finns det förhållandevis lite kunskap om hur specifika faktorer inverkar på slitaget.
Målet med projektet var att ta fram en metod för klassificering som grundar sig på mätbara data. Som utgångspunkt användes information som kan läsas ut ur den motorstyrenhet som samtliga fordon är utrustad med, så kallad driftdata. Eftersom en klassificering, för att vara meningsfull, måste grunda sig på faktorer som har inverkan på behovet av reparationer och service blev en betydande del av uppgiften att försöka identifiera sådana.
För att undersöka kopplingen mellan driftdata och slitage utvärderades och användes flera olika typer av information. I den inledande analysen jämfördes driftdata med garantiuppgifter men någon tydlig koppling gick därvid inte att finna. Slutsatsen blev att garantidata inte är lämpligt att använda för utvärdering av driftdata. Garantidata speglar främst problem som uppkommit beroende på bristande kvalitet och inte på grund av slitage.
Fel som uppstår som ett resultat av de driftförhållanden som fordonet verkar under utvecklas över tiden och därför är det viktigt att ha tillgång till reparationsstatistik som täcker en längre period. Den enda informationskälla inom Scania som innehåller heltäckande information om service och reparationer är en datorbas RAMAS där uppgifter om bilar med servicekontrakt lagras. Tyvärr finns det inte några driftdata att tillgå för det stora flertalet av de här bilarna. En insamling av driftdata från bilar med servicekontrakt har påbörjats men en fullständig utvärdering av materialet rymdes inte inom tidsramen för projektet. En genomgång av det material som trots allt fanns att tillgå visade på ett troligt samband mellan slitage på drivlinan och bränsleförbrukning.
Insamlingen av driftdata kräver en övergripande strategi. Förståelse för hur skador uppkommer och hur de sedan utvecklas med tiden är viktigt för att kunna identifiera intressanta driftfaktorer. En grundlig analys av driftdata behöver göras och kopplingen mellan bränsleförbrukning och slitage måste verifieras. Ett klassificeringssystem som bygger på hur driftfaktorer påverkar fordonet kommer att behöva förändras över tid.
Table of contents
FOREWORD...7 ABBREVIATIONS ...8 1 INTRODUCTION ...9 1.1SCANIA -THE HISTORY...9 1.2SCANIA -TODAY...10 1.3BACKGROUND...11 1.4FORMULATION OF PROBLEM...13 1.5GOAL...13 1.6TARGET GROUP...14 1.7DELIMITATIONS...14 1.8SOURCE LIMITATIONS...141.9OUTLINE OF THE REPORT...15
2 METHOD...16
2.1THE AUTHOR’S INFLUENCE...16
2.2RESEARCH METHODS ...17
2.3METHODS FOR DATA COLLECTION ...18
2.4QUANTITATIVE AND QUALITATIVE RESEARCH ...19
2.5RELIABILITY AND VALIDITY ...19
2.6WORKING METHOD...20
2.6.1 Literature studies ...20
2.6.2 Data mining ...20
2.6.3 Analysis, conclusions and recommendations ...20
2.7RELEVANCE OF THE REPORT...21
3 THEORY...22
3.1NEURAL NETWORKS ...22
3.2MACHINERY FAILURE...23
3.3UNINTENDED SERVICE CONDITIONS...24
3.4IMPROPER OPERATION...24
3.5MAINTENANCE...25
3.5.1 Introduction to maintenance ...25
3.5.2 Development within maintenance ...25
3.5.3 Maintenance concepts ...26
3.5.4 Total Productive Maintenance (TPM) ...28
3.5.5 Maintenance costs ...28
3.5.6 Maintenance aims and performance measures ...30
3.6MAINTENANCE OF VEHICLES...30
3.6.1 Introduction ...30
3.6.2 The Scania maintenance program ...31
3.6.3 Condition-Based Maintenance for vehicles ...32
3.6.4 Repair and maintenance contracts...33
3.6.5 Development of repair and maintenance ...34
3.7PRODUCT LIFECYCLE MANAGEMENT (PLM) ...34
4 VEHICLE INFORMATION...36
4.1INTRODUCTION...36
4.3OPERATION DATA...36
4.3.1 Introduction ...36
4.3.2 Description of operation data...37
4.3.3 Current use of operation data ...39
4.3.4 Improvement of operation data ...40
4.4SCANIA ASSISTANCE...41
4.5WARRANTY DATA...43
4.6REPAIR AND MAINTENANCE DATA...43
4.7FRAGMENTS OF DATA...45
4.8WHICH DATA TO ANALYSE...45
5 ANALYSIS - WARRANTY...46
5.1INTRODUCTION...46
5.2SAMPLE - WARRANTY...46
5.3INFORMATION RETRIEVED CONCERNING THE SAMPLE - WARRANTY...47
5.4PREPARING DATA FOR ANALYSIS – WARRANTY...47
5.5SCATTER PLOTS - WARRANTY...49
5.5.1 Operation time matrix...49
5.5.2 Fuel consumption matrix ...52
5.6RESULT - WARRANTY...53
5.7DISCUSSION – WARRANTY...53
6 ANALYSIS – R&M...54
6.1INTRODUCTION –R&M ...54
6.2SAMPLE –R&M ...55
6.3PREPARING THE ANALYSIS...56
6.3.1 The RAMAS database ...56
6.3.2 Information retrieved from RAMAS...56
6.3.3 Comparison between the sample and the larger collective...59
6.4SCATTER PLOTS -R&M...61
6.4.1 Stated fuel consumption ...61
6.5RESULT...64
6.6DISCUSSION...64
7 CONCLUSIONS AND RECOMMENDATIONS...66
7.1CONCLUSIONS...66
7.2RECOMMENDATIONS FOR FURTHER WORK...67
REFERENCES ...69
PRINTED MATERIAL...69
ELECTRONIC RESOURCES...71
APPENDIX 1 ...72
List of figures
FIGURE 1.LIFE CYCLE COST FOR TRUCK...11
FIGURE 2.DATA WAREHOUSE WITH CUSTOMER AND OPERATION DATA...13
FIGURE 3THE INTERDEPENDENCY OF THE RESEARCHER'S PERCEPTIONS AND HOW RESEARCH IS CARRIED OUT16 FIGURE 4.ONLY IF THE INPUT TABLE 1.EXAMPLE OF OPERATION TYPE CLASSIFICATION...12
TABLE 2PARTS INCLUDED IN THE POWER TRAIN AND DRIVE TRAIN...13
TABLE 3.EXAMPLE OF WARRANTY INFORMATION RETRIEVED...48
TABLE 4.INFORMATION RETRIEVED DURING THE INTERVIEWS...55
IS LARGE ENOUGH WILL AN OUTPUT BE GENERATED...22
FIGURE 5.SCHEMATIC REPRESENTATION OF A NEURAL NETWORK...23
FIGURE 6.DIRECT COSTS ARE THE TIP OF THE ICE-BERG...29
FIGURE 7.DESIGN OF A CONDITION MONITORING SYSTEM...33
FIGURE 8.LOAD AND ENGINE SPEED MATRIX...38
FIGURE 9.AGGREGATED DISTANCE AS A FUNCTION OF OPERATION TIME...39
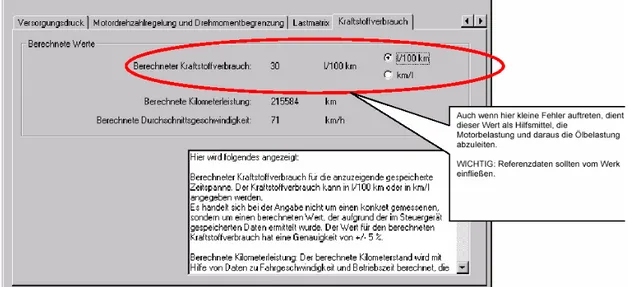
FIGURE 10.CALCULATED FUEL CONSUMPTION...40
FIGURE 11.SCANIA ASSISTANCE FLOW CHART...42
FIGURE 12.EXAMPLE OF DATA AVAILABLE FROM RAMAS SHOWING THE AGGREGATED COST (SEK) PER KILOMETRE...44
FIGURE 13.COOLING WATER TEMPERATURE EXTRACTED FROM OPERATION DATA...47
FIGURE 14.EXAMPLE OF HOW THE MATRIX WAS DIVIDED INTO LARGER AREAS...49
FIGURE 15.ERROR FREQUENCY AS A FUNCTION OF OPERATION TIME...50
FIGURE 16.MEAN VALUES OF ERROR FREQUENCY AS A FUNCTION OF OPERATION TIME...51
FIGURE 17.MEAN VALUES OF ERROR FREQUENCY AS A FUNCTION OF OPERATION TIME...51
FIGURE 18.FUEL CONSUMPTION INDEX AS A FUNCTION OF ERROR FREQUENCY...53
FIGURE 19.ERROR FREQUENCY AS A FUNCTION OF OPERATION TIME...54
FIGURE 20.NUMBER OF JOBS PER 100.000 KILOMETRES AND OPERATION YEAR CARRIED OUT ON SUBGROUP ENGINE...57
FIGURE 21.AVERAGE JOBS PER 100.000KM EACH OPERATION YEAR DIVIDED INTO SUBGROUPS OF THE POWER TRAIN AND DRIVE TRAIN FOR ALL VEHICLES IN THE RAMAS DATABASE...58
FIGURE 22.AVERAGE NUMBER OF JOBS PER VEHICLE EACH OPERATION YEAR DIVIDED INTO SUBGROUPS OF THE POWER TRAIN AND DRIVE TRAIN FOR ALL VEHICLES IN THE RAMAS DATABASE...58
FIGURE 23.AGGREGATED NUMBER OF JOBS DURING MILEAGE PER VEHICLE FOR ALL R&M CONTRACT VEHICLES MANUFACTURED 1999,2000 AND 2001 ...59
FIGURE 24.AGGREGATED NUMBER OF JOBS DURING MILEAGE PER VEHICLE FOR VEHICLES IN SAMPLE MANUFACTURED 1999 AND 2000 ...60
FIGURE 25.AGGREGATED NUMBER OF JOBS DURING MILEAGE ON ENGINE COMPONENTS PER VEHICLE FOR ALL R&M CONTRACT VEHICLES MANUFACTURED 1999,2000 AND 2001 ...60
FIGURE 26.AGGREGATED NUMBER OF JOBS ON ENGINE COMPONENTS PER VEHICLE FOR VEHICLES IN SAMPLE MANUFACTURED 1999 AND 2000 ...61
FIGURE 27.AGGREGATED JOBS PER VEHICLE AS A FUNCTION OF MILEAGE FOR 12- AND 14-LITRES ENGINES...62
FIGUR 28MEAN NUMBER OF JOBS PER 100.000 KILOMETRES ON ALL DRIVE TRAIN COMPONENTS...63
FIGURE 29MEAN NUMBER OF JOBS PER 100.000 KILOMETRES ON ENGINE COMPONENTS...63
Foreword
This report constitutes my Masters Thesis and is the result of a project at Scania Technical Centre in Södertälje. The project was initiated in October 2003 and finished in the beginning of spring 2004 and was the last part of my degree in Industrial Engineering and Management. The Department of Industrial Management and Logistics at Lund Institute of Technology has been supervising the project, providing valuable insight and help along the way.
To work with this project has been challenging in many ways and I value the experience and knowledge it has given me greatly. I would like to thank all the people at Scania and its subsidiaries who have helped me in different ways. The library at Scania has been a great resource during the project and have I am very grateful for the help the library staff has provided.
Special thanks to both of my supervisors Andreas Renberg at Scania and Bertil Nilsson at Lund Institute of Technology.
Södertälje March 2004 Fredrik Johansson
Abbreviations
CBM Condtion Based Maintenance FBM Failure Based Maintenance GTW Gross Train Weight
OBM Opportunity Based Maintenance OEE Overall Equipment Efficiency PM Preventive Maintenance R&M Repair and Maintenance’ TPM Total Productive Maintenance TQM Total Quality Management
1 Introduction
1.1 Scania - The history
1In 1911 Scania, then located in Malmö, merged with Vabis from Södertälje. The new company decided to focus on trucks that could replace the horse and wagon. Already in the early days the company focused on developing fuel efficient engines. In the early twenties Scania launched a new engine that could be adapted to use several different sorts of fuel. Customers could simply switch to the most economical fuel at the time by changing pistons. The new engine was the first step towards the module-concept, which Scania is presently famous for. Scania’s first in-house engine was presented in 1936 and was a 6-cylinder diesel with 120 horse powers. Heating inside the cab was still fifteen years away. The engine development- and production-program continued to grow over the years with a great number of new products being introduced. The focus came to be on high-output engines that could operate on low engine speeds, this being beneficial for fuel economy, noise and service life. The first V8, introduced in the late sixties, was the result of a longer period of development efforts.
As the engine output grew there was a greater need for stronger chassis, different brakes and more advanced suspension. Scania had learnt a great deal about loads on different truck components, partially because the company supplied trucks to units within of the Swedish army. This knowledge became a great advantage and it influenced new designs.
The maintenance of trucks has changed a great deal over the years. Originally most trucks were maintained by their owners and only a very simple service organisation existed, engine overhauls were common. As heavy vehicles became more and more complex, Scania started to build a dense network of service workshops with trained staff. At the same time more service-friendly designs where emphasised. In the 1980’s, Scania started to develop new maintenance programs whereby no repairs should be required only regular maintenance and replacement of certain parts. In the last thirty years the hours of maintenance needed have decreased between twenty-five and fifty percent.
1.2 Scania - Today
2At present Scania is the only pure heavy truck producer in Europe. Compared to its competitors Scania is not a very large firm but a highly successful one with profitability better than any other company in the business. The success of Scania is the result of a very clear strategy focusing on the development and production of heavy vehicles.
Scania was the first vehicle producer to incorporate a modular system. The idea behind a modular system is to meet the widest possible demand with the minimum number of components. This is achieved using a standard interface for all the different parts. The customers can then combine these parts, within certain limitations, to meet their specific needs. The modular system has several advantages. First of all Scania does not need to develop as many different variations as would otherwise have been the case. Using a modular system the same basic designs can be used in a number of different products. So are for example several of the engine-components used for all of Scania’s engines. Another advantage with a modular system is that the number of components needed in the production is limited. This makes the whole production-process less complex and easier to co-ordinate. A less complex system with fewer parts to coordinate is more efficient and cheaper to run.
Scania develops and manufactures all of the major components required themselves. Particularly in the United States, where Scania is not present in the marketplace, it is otherwise common for manufacturers to build cabs and chassis only. A second company, determined by the final customer, then provides the power train. To sell trucks equipped with an in-house power train as Scania does, gives a company greater possibilities to control the value chain. Furthermore the different components can also be designed to match each other early on in the development phase.
The initial investment, that is the purchase price, is only a small part of the total operating cost for a truck and many other factors are just as important. For Scania it is hence becoming increasingly important to provide the customer with a number of enhanced services. Finance as well as repair and maintenance are vital areas when trying to attract customers. The life cycle cost for a truck is illustrated in figure 1.
Figure 1. Life cycle cost for truck
1.3 Background
Scania vehicles are comprised of modules and customers can, within certain limits, combine these in any way they find suitable. With so many possible variations there is no standard product. However, several of the many possible combinations are more common than others.
Within Scania and its subsidiaries there is a need to group vehicles into larger categories depending on how they are used. To classify vehicles depending on the situation of operation is useful in several ways. Firstly the need for repair and maintenance (R&M) is dependant on the situation. Knowledge about how a specific vehicle is operated can help the R&M organisation adjust the maintenance program for the particular situation. Likewise, if the type of operation is known, a salesman will have a greater chance to help the customer to find an optimal specification for a new vehicle. It is also important when designing new products to understand how the products actually will be used since this might affect the development project.
Today the grouping of vehicles varies between different departments of Scania depending on which perspective is being used. For example, the sales-,
Life cycle cost
25%
10% 55%
10%
Other variable cost e.g. fuel, tyres, and road taxes Purhase price
Other fixed cost e.g. salary, insurance and vehicle tax
After sales e.g repair and maintenance
workshop- and warranty-organisations all have various classification systems. With several different systems it is necessary, in order to avoid misunderstandings, to clarify which system is being used. In addition to the fact that several different classification systems make it hard to utilise the operation classification all together, the classification itself is very subjective. Few of the operation factors taken into consideration are possible to measure and the classification is partially a result of bargaining between the sales staff and the customer. An exmple of operation type classification can be seen in table 1.
Table 1. Example of operation type classification
Operation type Type 0 Type 1 Type 2 Type 3 Type 4
Characteristics •Light long haulage •Good road conditions •General cargo •GTW <40 tonnes •Long haulage •Good road conditions •General cargo •GTW 40-60 tonnes •Long haulage •Poor road conditions •Timber, bulk •GTW >40 tonnes •Construction operations •Off-road •Gravel, concrete •Short haul distribution •Good road conditions •Distribution
An objective classification system based on measurable operation parameters could have many advantages. Most importantly the different operation types would be clearly defined. Hence, classification could be performed the same way in the entire organisation. However, in order to be meaningful a classification system must be based on parameters which link operation conditions with the effect on the vehicle. The road conditions, the topography, the driver, the weight of the vehicle, the vehicle specification and vehicle speed are several examples of the many factors that influence the vehicle. Unfortunately there is a great level of uncertainty when it comes to quantifying the effect that each of these have on the truck since the relations are very complex. Nonetheless it is crucial to investigate the link between operation conditions and vehicle wear.
Knowledge concerning vehicle operation and its effect on the vehicle can be used for numerous purposes. In coordination with other types of information such as customer data, vehicle data, repair data and registration data, operation data can be utilized extensively both locally and centrally. Being aware of both customer requirements and vehicle information makes it possible to offer customers services in accordance with their needs, see also figure 2.
Figure 2. Data warehouse with customer and operation data
1.4 Formulation of problem
With the starting point in operation data extracted from trucks, how should we go about to develop an objective method for classification? The classification system must be based on variables which are related to vehicle wear. How can such variables be identified?
1.5 Goal
The main aim of the project is to develop a new objective method for classification of vehicles. Operation type classification will be important in for example the design and pricing of maintenance contracts and how new vehicles are specified. Through collection and analysis of vehicle data and operation data from the engine control unit a method will be developed. The power train (the engine) and drive train (see table 1) will work as starting points for the project as they are directly influenced by engine operation.
Table 2. Parts included in the power train and drive train
Engine Clutch Gear box Prop shaft Rear axle
Data base for analysis of customer needs Customer
data Repair and registration data Operation data R&M-contracts Operational cost and customer profitability International Co-ordination
1.6 Target group
The report is primarily intended for employees within Scania and its subsidiaries.
1.7 Delimitations
This project focuses on a method which can be used for development of a new objective operation type classification. Thus, the result of the project will not be an entirely new classification system but a starting point for further work within the area.
1.8 Source limitations
Only one truck out of a thousand sold by Scania is currently represented in the database which contains operation data from the engine control unit. The reason for such a small proportion of the engine data being stored is that an overall strategy for the gathering of such information is lacking. For a long time read-outs of operation data has been something which the workshop does occasionally when the vehicle is in for R&M. However, since there is no real incentive for the workshop to forward the information to Scania Technical Centre, where it is stored in a database, the gathering of data is quite sporadic.
Operation data must be evaluated and used with care. Some of the vehicles in the database have had the information in the engine control unit memory extracted because they repeatedly break down or perhaps have a problem that puzzles the workshop employees. By extracting operation data and perhaps send it to someone at the head office for evaluation the crew often hope to find a clue to what the root cause of the problem is. Thus, it can be questioned whether the operation data sent to Scania and incorporated in the database is representative for Scania vehicles in general.
R&M-data is recorded only for vehicles which are serviced by Scania and its subsidiaries in accordance with a service contract. Not every customer is interested in a R&M contract when buying a new vehicle as they might have their own repair shop or use another workshop which is not connected to Scania in any way. These vehicles are not represented in the R&M statistics.
Some types of vehicles are not commonly sold with an R&M contract. This is for example the case for trucks built on chassis of Distribution- (D) and Construction- (C) type. These trucks are usually driven rather short distances in restricted geographical areas making the owners less prone to sign R&M-contracts. However, Scania predominantly sells vehicles used for varying sorts of long-haulage and many of these vehicles are bought with an R&M-contract. The database containing R&M info is thus somewhat representative for the production mix within Scania.
1.9 Outline of the report
Chapter 2, Method aims at presenting the method which has been used throughout the project. Validity and reliability are described both generally and in the context of the project. Finally the relevance of the report is discussed.
Chapter 3, Theory, aims at describing the theory which serves as a starting point for the project. Machinery failure and different aspects of maintenance are presented.
Chapter 4, Vehicle information, describes the different resources, containing vehicle information, which are available within Scania. Characteristics of these resources are outlined and discussed.
Chapter 5, Analysis of warranty data, investigates the relationship between operation data from vehicles with data concerning warranty issues.
Chapter 6, Analysis of repair and maintenance (R&M) data, investigates the relationship between operation data from vehicles and R&M information.
Chapter 7, Conclusions and recommendations, describes the result from the analysis and the most important conclusions. Finally recommendations for further work within the area are presented.
2 Method
Initially the author’s frame of mind and the impact it has on the research is discussed. After a short introduction, concerning a few of the possible research methods and their characteristics, the chosen working method for the project is described. Finally the relevance of the report is discussed.
2.1 The author’s influence
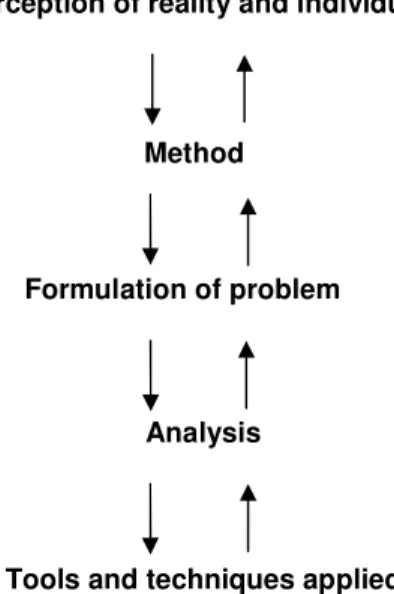
3The author’s understanding of the surrounding world has great implication for how the research is carried out and thus the final result. Our perception of the world around us influences the method we choose to conduct research and the way we analyse the results. However, as can be seen in figure 3, the influence our understanding has on how a specific research task is carried out is not single sided. The results will influence our idea about the reality and thus change our perception of this reality.
Figure 3. The interdependency of the researcher's perceptions and how research is carried out
Rather often the method applied in a certain situation is unspoken. We may have been in the same situation before and to consider all the different alternatives would according to our bias be both time consuming and a waste of resources. Nonetheless, it can occasionally be worthwhile to think about how suitable a
3 Darmer P, Freytag P, Företagsekonomisk undersökningsmetodik, 1995, p 24-27
Perception of reality and individual
Method
Formulation of problem
Analysis
certain method is and the implications it will have. First of all it can help the researcher to understand the limitations of a certain method and the underlying perception. Knowledge about these limitations can lead to a change in attitude which allows the view of the reality and the method to become better aligned with the overall aim of the research project.
Certain methods can be described very carefully but nonetheless only the researcher will have the knowledge to evaluate the information and its limitations. The method used must be carefully described so that choices and interpretations that have been made are easier to understand.
2.2 Research methods
45There are always multiple choices when it comes to selecting a method. If a certain method is appropriate or not depends on the problem at hand and the resources and the competences of the researcher. The method must be suitable for the knowledge needs and the reality being studied. Among the available methods experiments, surveys, and case studies are the main ones.
Experiments are used to evaluate the cause and effect relationships between a number of variables. Conducting experiments is often rather complicated and time consuming. To some extent the researcher needs to be in control of the environment, blocking against certain factors influencing the result.
Surveys can be used to answer research questions of many different kinds but are commonly used when the research question is somewhat straight forward. A questionnaire or a standardised interview is used on a large population. The result is presented with different sorts of diagrams and tables, explaining how the respondents have answered when facing a certain question.
When a case analysis method is used the research focus on one or a few specific objects that are examined more on depth. Case analysis is especially suitable to use when it is hard to determine which factors that are important and makes it possible for the researcher to investigate relationships which was not initially thought of. The researcher has a great amount of freedom when conducting a case analysis both when gathering information as well as when analysing it. Case analysis can be a starting point for a later survey or experimental approach.
4 Ejvegård R, Vetenskpalig metod, 1996, p 30-33
2.3 Methods for data collection
6789A number of different methods for data collection are needed in most research contexts. Usually a distinction is made between primary resources and secondary resources of information. Primary data is data that the researcher gathers while secondary data has already been documented by someone else. The level of freedom that the researcher has when choosing sources of information varies somewhat depending on how the research project is specified. The most commonly used ways to gather information are interviews, observations, database retrievals document reviews and experiments.
Document reviews are often a very efficient way to gather information concerning a specific field or subject. Knowledge about what other people have done before and what their conclusions were is an obvious starting point before any research is done within the same area. When reviewing documents it is important to consider that they were written for a specific purpose and with a specific audience in mind, this can greatly influence their reliability.
Interviews can be performed in ways which are more or less structured depending on the purpose with the interview. An advantage of using interviews that are not very structured is that the researcher can adjust the questions in accordance with what the respondent says making the interview very flexible. The problem with that is of course that it might be hard to analyse the data due to the diversity in response that might be the case. On the other end of the spectra are interviews which are carried out in exactly same way using standard questions which have been validated and tested. In order to be beneficial interviews must to be carefully prepared and analysed something which commonly requires quite a lot of skill and time.
Researchers can increase their knowledge about a certain system by simply observing it for a period of time. Observations make it possible for the researcher to draw conclusions which are not based on other people’s impressions. Just as with interviews, the researcher’s level of involvement can vary considerably. Direct observations does not contain any contact with the system itself, intervenient observations on the other hand require a high level of involvement from the researcher. Observations can only give increased knowledge about the present situation but does not provide any information about what has happened in the past.
6 Lekvall P, Wahlbin C, Information för marknadsföringsbeslut, 2001, p 257-271 7 Karlsson M, Lövdahl C, Vägen till rätt kvalitet, 2003, p 20
8 Ejvegård R, Vetenskaplig metod, 1996, p 44-50
2.4 Quantitative and qualitative research
10 11Qualitative research is concerned with observation, description and generation of hypotheses. The focus of qualitative research is to understand and explain complex situations and context. A researcher conducting a qualitative research task can use a wide range of different sources, the main ones being observation and informal conversation.
Quantitative research is used when the research question involves defined variables and a large number of objects. Quantitative methods are more structured and the researcher is in better control of the situation. The method is commonly used to explain or verify a number of different phenomenons.
Sometimes researchers combine quantitative and qualitative methods, depending on the research question. To use a combination of methods in order to improve the validity of the final result is called triangulation.
2.5 Reliability and validity
1213To evaluate results and information resources is a necessity. Otherwise there is a risk that the material is not interpreted in an appropriate way. For evaluation purposes the concepts of validity and reliability are commonly used.
Reliability addresses the correctness of a certain measurement instrument and a certain measurement unit. If, when the same measurement is repeated, the same value is recorded the method used is said to have high reliability.
Validity is concerned with if the measurement method used actually measures the appropriate property. When conducting research of qualitative type it can be hard to judge if the method used is valid or not since there is no one way to get the correct result.
Reliability and validity are connected to each other; high validity requires high reliability. However, high reliability does not in any way guarantee high validity. Measuring something the correct way does not rule out that the wrong thing has been measured.
10 Lekvall P, Wahlbin C, Information för marknadsföringsbeslut, 2001, p 213
11 Darmer P, Freytag P, Triangulering – ett redskap i analys- och datainsamlingsprocessen, 1995, p 123-127
12 Lekvall P, Wahlbin C, Information för marknadsföringsbeslut, 2001, p 304-308 13 Ejvegård R, Vetenskaplig metod, 1996, p 67-70
2.6 Working method
The project consisted of several parts. These included literature studies, data mining, analysis and finally conclusions and recommendations. The literature studies were mainly conducted to increase the understanding of general maintenance and the R&M business. During the data mining phase different data sources were evaluated and compared. The different sources all had certain characteristics and it was important to be aware of these before an analysis was carried out.
2.6.1 Literature studies
During most of the project literature studies have been carried out to help build a foundation of basic data for decision making. The areas that have been studied are mainly maintenance, in general as well as specifically for vehicles. In cooperation with personnel from the Scania library literature which in some way connect operation factors with the need for repair and maintenance has been investigated.
2.6.2 Data mining
There are a number of data sources available containing different kinds of vehicle information. All of these sources have been designed with a specific application in mind and the types of information they contain differ significantly. Thus, an important part of the project was to learn what these sources contain and how they can be characterised.
2.6.3 Analysis, conclusions and recommendations
To start with, the analysis was based on data already available within Scania. Once this analysis had been performed a review was made and it was decided that further work had to be based on material that was collected in cooperation with workshops in Sweden. Unfortunately the time allowed for the project was not enough to collect all the material that was needed in order to perform a complete analysis. The completion of the analysis had to be done after the termination of the project. Conclusions and recommendations in this report is thus based on the work that has been carried out so far.
2.7 Relevance of the report
The relevance of the report is deemed to be high meaning that the project is of interest not only for the researcher but also for other people. No similar published projects have been found and investigating the link between operational conditions and wear is in many ways important for Scania and its subsidiaries. Aftermarket sales are becoming increasingly important to manufacturers and knowledge concerning links between operation conditions and wear makes it possible for them to design more specific offerings to customers.
3 Theory
The aim of this chapter is to make the reader more familiar with theory concerning maintenance issues and other related areas. The complexity of maintenance issues and the issues involved are important throughout the project.
3.1 Neural networks
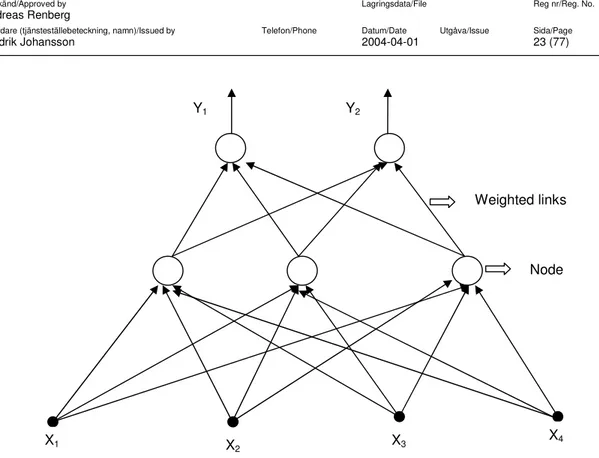
1415Neural networks have become increasingly popular over the last twenty years and their design is often compared to that of the human brain. Networks of this kind are used in areas of prediction and classification where other statistical techniques have traditionally been used. Highly interconnected simple computational units, also called nodes, are the main parts of a neural network.
Each connection in a neural network has a weight w associated with it which is adjusted depending on the problem presented to the network. The total input to one node is the sum of the output from nodes connected to it multiplied with the weight of that particular connection. Only if the total input a to a node is larger than a particular value will an output y be generated (figure 4).
Figure 4. Only if the input is large enough will an output be generated
The adjustment of connection weights is commonly called learning and can be either supervised or unsupervised. Under supervised learning there is a known target value which is compared with the output from the network and the weights are then altered accordingly. Thus, it is important to use a data set which is representative for training purposes. However, a neural network can also receive too much training, causing it to adjust to minor patterns which are perhaps only present in the training set. Unsupervised training is used when no target output values are available.
14 Strandlund H, Introduktion till artificiella neurala nätverk
15 Warner B, Misra M, Understanding neural networks as statistical tools, 1996 a = W1X1 + W2X2 + … + WNXN
a > y = 1 a < y = 0
Figure 5. Schematic representation of a neural network
Neural networks can be used to find complicated connections in a large amount of data and it can be used within almost any science and applied on a variety of problems. There are numerous commercial software programs that can be used to implement neural networks. However, using neural networks is not an entirely straight forward exercise. Choosing input parameters, initial weights and how many layers of nodes to use requires a certain level of knowledge and experience. Neural networks are used in certain maintenance systems for condition monitoring purposes and will be further mentioned in chapter 3.5.3.
3.2 Machinery failure
16Machinery failure is any change which causes the equipment to be unable to function satisfactorily. Very often a failure is the final stage of a longer chain of cause and effect relationships. Failure analysis seeks to uncover the root cause of the problem and to rectify it in order to prevent future failure and to assure safety, reliability and maintainability of machinery as it passes through its life cycle.
16 Bloch H.P, Geitner F.K, Machinery Failure Analysis and Troubleshooting, 1994, p 1-9
X1 X2 X3 X4
Y1 Y2
Node s Weighted links
Failure causes can be classified in the following way:
• Unintended service conditions
• Improper operation
• Maintenance deficiencies
• Faulty design
• Material defects
• Processing and manufacturing deficiencies
• Assembly or installation defects
The first three points on the list, unintended service conditions, improper operation and maintenance deficiencies are especially interesting for this project. With appropriate sales and R&M procedures these ought to be possible to influence directly. The remaining four points might not be possible to affect immediately but knowledge concerning operation conditions and their effect will be of great importance over time.
3.3 Unintended service conditions
If the needs and wants of the customer are not properly understood by the manufacturer and its subsidiaries the customer might buy a product which is not optimised or maybe even unsuitable for the application the customer is interested in. A product being used for purposes it was not intended to be can be a nuisance for both buyer and seller. If for example the product is applied in the wrong setting maintenance and repair costs will typically be higher than what would have been the case if a more appropriate product was selected.
3.4 Improper operation
When new designs are developed they are optimized for a certain type of operation. When put into operation the resemblance between the actual use and the use the equipment was designed for can be quite different. For equipment manufacturers it is important to design systems which are easy to operate and not damaged when they are handled incorrectly. Competent operators are important for safe and efficient operation and can eliminate cost for equipment manufacturers as well as customers.
Increased load cycling, corrosion, unanticipated stresses and many other factors can then reduce the life expectancy of certain components17. Thus, the connection between the operating environment and the maintenance requirements are very strong. Often manufacturers use generous margins to be on the safe side. Thorough knowledge about customers and how they operate their equipment can help the company to develop more appropriate designs and to customize the maintenance program.
3.5 Maintenance
3.5.1 Introduction to maintenance
1819Maintenance deals with the “care and repair of equipment”20 and is a multidisciplinary area. Keeping the equipment running in a cost effective way requires the maintenance organisation to perform tasks at the right time and in the right way. The approach to maintenance varies a great deal between different companies and different sorts of equipment. Some machines cannot be allowed to fail and maintenance therefore focuses on preventing errors to occur. In other cases there might be spare capacity available making the maintenance functions less critical. Numerous aspects must be taken into consideration before a decision regarding maintenance can be made.
3.5.2 Development within maintenance
2122Maintenance practice has changed a great deal over the years in response to different requirements. World events, legislation, corporate strategy, communications and many other factors all affect the maintenance function directly or indirectly. Early on maintenance was mainly an engineering field but the emphasis has shifted and now many other disciplines are also involved.
In the early days of industry maintenance was seen as hardly anything more than a necessary expense, which should be limited to the largest possible extent. The focus was entirely reactive; meaning that when something broke it was replaced or repaired to ensure the equipment run again. The overall efficiency of the total system was not considered to any larger extent.
In the middle of the 20th century the maintenance systems started to change somewhat. More and more preventive maintenance was carried out. Personnel continuously monitored the equipment and tried to determine the best methods to avoid failure, renew components and to reduce repair time. Specialisation made the maintenance organisation grow as the number of technicians increased. During the last few years the emphasis of maintenance has shifted towards integration with other functions within the company. The goals of the maintenance function are becoming aligned with the corporate goals and maintenance is seen as an integrated part of the business which involves the entire organisation and
18 Jonson P, The impact of Maintenance on the production process - Achieveing high performance, 1999, p 25-27
19 Wilson A, Asset maintenance management, 1999, p13-18
20 Bessant J, Macmillan dictionary of production management & Technology, 1990, p 95-96 21 Jonson P, The impact of Maintenance on the production process - Achieveing high performance, 1999, p 27-28
can help to increase the profit. Concepts such as Total Productive Maintenance (TPM) have been introduced and present ways to increase the interaction between different functions.
3.5.3 Maintenance concepts
2324252627A number of different maintenance concepts have been developed in response to the development of equipment and need for reliable operation. Instead of leaving machines running until failure the trend has been to use a more proactive approach aiming at eliminating problems before they arise. As the emphasis of maintenance changes from repairing equipment which has failed to work in a proactive way the responsibility for carrying out maintenance generally becomes more decentralized. The most common maintenance policies are presented below:
Failure-Based Maintenance (FBM)
Under FBM no action is taken until a failure occurs, no maintenance is performed when the equipment is operating as intended. The task for the repair personnel is to restore the machine to its original state as soon as possible. FBM should be used mainly when breakdowns are random and the incurred cost is low. Studies referred to by Mobley28 shows that repairs carried out after a failure are substantially more expensive than the same repair made within a use-based or condition-based mode. A large number of redundancies in spare parts are usually required under FBM, otherwise the time between failure and repair will become to long. At all times the required personnel must be easy to access, should a failure occur.
Preventive Maintenance (PM)
Using PM components are replaced at particular times, independent of its condition. This is intended to reduce the risk of failure and prevent degradation. The time between two replacements can be either calendar time or running time for the specific component. The cost of maintenance can be minimised selecting a suitable replacement interval. However, depending on the underlying distribution of failure selecting the optimal interval is not always an easy task.
23 Al-Najjar B, Condition based maintenance: Selection and improvement of a cost effective vibration-based policy for rolling element bearings, 1997, p 18-23
24 Jonson P, The impact of Maintenance on the production process - Achieveing high performance, 1999, p 28-32
25 Ljungberg Ö, Att förstå och tillämpa TPM, Total Produktivt Underhåll, 1998, p 20 26 Olsson E, Tillståndsbaserat underhåll-Projektplan, 2002, p 1
27 Starr A,. Estaban J,. Willets R, Data fusion as a model for advanced condition-based maintenance, 2002
Condition-Based Maintenance (CBM)
With CBM the condition of the equipment or the technical system is monitored with regular intervals or continuously. When an error is indicated the equipment is taken out of use and serviced before a serious failure occurs.
To monitor a system successfully it is necessary to have a reliable indication of the maintenance requirements. There are several different measurements which can be used to assess the condition of equipment for example temperature, vibration, pressure and acoustic emission. The measured value is compared to historic values and through knowledge about the system and its components it is then possible to estimate the future development of failures and risk. Thus, implementation of CBM requires that a clear link can be established between possible failures and a parameter which is measurable.
CBM is used widely within power- and process-industry where a failure can have a very large effect. As the cost of monitoring equipment declines the interest for CBM increases and also smaller companies with limited financial resources have started to use CBM. However, the more reliable the equipment that should be monitored is, the less cost effective is the implementation of CBM29.
Condition monitoring carried out by operators can be seen as a type of CBM. Most failures can be avoided using the human senses to monitor the equipment. Maggard and Rhyne30 state that 75% of the occurring problems could be prevented by the operator at an early stage.
Large machinery can often generate diverse condition indicators which are hard to use as data for decision making concerning maintenance issues. Data fusion, which is the process of combining data and knowledge from different sources maximising the amount of useful information, can be used to evaluate information from a more advanced monitoring system. In a CBM system containing several different kinds of sensors a significant amount of data needs to be processed when assessing the condition of the equipment. There are many different kinds of data fusion techniques and knowing when the different methods of data fusion are appropriate can require a great deal of experience. Neural networks is one sort of technique which can help to fuse multiple sensor input and even diagnose the condition and suggest actions that should be taken. The accuracy of the neural networks’ prediction should improve over time as it learns more about the relationships present in the data.
29 Rajan B.S, Roylance B.J, Condition-based maintenance: A systematic method for counting the cost and assessing the benefits, p 97-108
30 Maggard B.N, Rhyne D.M, Total productive maintenance: A timely integration of production and maintenance, p 6-10
Opportunity-Based Maintenance (OBM)
With OBM maintenance work is carried out when utilization is low or the equipment is idle. Using OBM might result in delays for some types of maintenance. Large overhauls can be hard to schedule in the program since the equipment must be taken out of service for a longer period of time. Areas where OBM is typically used are for example within power- and process-industry where maintenance is scheduled long in advance.
3.5.4 Total Productive Maintenance (TPM)
Total productive maintenance is a concept which aims at improving equipment efficiency as much as possible. Operators are required to take over some of the maintenance tasks and are told to report any changes in machine condition to the maintenance staff. TPM tries to improve common practices in the organisation changing the corporate culture. The connection between TPM and TQM is strong and the Deming cycle i.e. Plan-Do-Check-Act is important in both of them. Continuous improvements and elimination of all kinds of waste is the focus of TPM.
3.5.5 Maintenance costs
3132Deciding on an appropriate level of maintenance is not a simple task. The cost of maintenance compared to the amount of down-time is not a linear one. Increasing the spending on preventive maintenance can, in some cases, even decrease the ratio between up-time and down-time. Maintenance is an integral part of the company and a tool to keep the value adding process running effectively. Therefore a suitable approach to maintenance requires knowledge about the whole system.
The direct cost for maintaining the assets such as personnel, spare parts and external services is rather easy to quantify. However, Ahlmann33 points out that on average only half of the maintenance cost is direct maintenance cost. Hidden costs, mainly consequential costs of inadequate maintenance, can be totally dominating. An inventory kept to compensate for down-time, cost of over-time due to down-time and the cost of purchasing additional capacity are examples of such hidden costs. Decision models based only on direct cost can be completely misleading.
31 Watson A, Asset maintenance management, 1999, 29-36
32 Jonson Patrik, The impact of Maintenance on the production process - Achieveing high performance, 1999, p 33
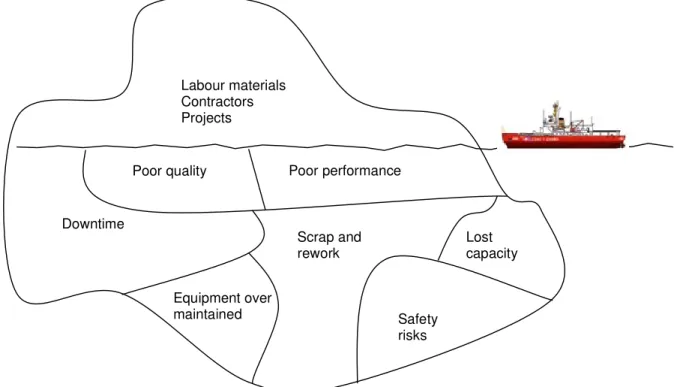
Equipment should be evaluated using the total aggregated cost during its full life-cycle. A large part of the performance is determined already during the design phase and it is important to consider maintenance cost and maintainability already in this stage. However, some measurements can be taken also when the equipment is running to reduce the need for maintenance. To monitor the ‘consequence’ maintenance cost is an important task, helping the organisation to allocate the appropriate level of maintenance resources for the specific equipment. Not taking the total life-cycle cost into consideration might cause a situation where only direct costs, the tip of the ice-berg, are accounted for.
Figure 6. Direct costs are the tip of the ice-berg34
34 Wilson A, Asset maintenance management, 1999, p 33 Labour materials
Contractors Projects
Poor quality Poor performance
Downtime
Scrap and
rework Lost capacity
Safety risks Equipment over
3.5.6 Maintenance aims and performance measures
353637Maintenance is a service function which is mainly noticed when a fault occurs. However, maintenance is an important part when trying to achieve the companies overall business objectives and aims of the maintenance function must therefore be carefully aligned with corporate strategy. Only when the contribution of maintenance to the profitability is well understood can the function gain acceptance and appreciation within the organisation.
When measuring the performance of maintenance activities it would be optimal to track the contribution of maintenance to the life-cycle profit. However this is often not possible. A common approach is to look at maintenance costs and equipment availability. This takes account of sporadic failures, malfunctions that have significant effect when they occur but less so long term. Chronic problems, meaning that the equipment is not operating at the maximum of its capacity, are very common and often hard to recognise. The operator might for example not be aware of how to use the machine efficiently. To discover chronic failure the performance of the system must be compared to a potential level which is possible to reach. Performance measurements such as the overall equipment efficiency (OEE) measure and the up-time measure can be used to broaden the focus.
• OEE = Availability x performance efficiency x percentage of first quality products
• Up-time = Amount of time running on maximum capacity whilst making first quality products
3.6 Maintenance of vehicles
3.6.1 Introduction
Vehicles are from a maintenance point of view quite different from other types of equipment. The mobility and the changing operation conditions make it hard to monitor the condition of vehicles and determine appropriate maintenance intervals. Thus, maintenance is not to any larger extent adapted to the specific vehicle. The consequence is that many vehicles are maintained too often or too seldom, resulting in higher cost for maintenance and increased wear respectively.
In cases where the R&M interval is in some way aligned with operation conditions the maintenance organisation can many times not access any more information about the operation of the vehicle than what the owner provides. How a vehicle is
35 Wilson A, Asset maintenance management, 1999, p 42-59
36 Jonson P, The impact of Maintenance on the production process - Achieveing high performance, 1999, p 48
actually used can however differ greatly from what the owner says and might also change over time.
The mobility of a vehicle sometimes makes it hard to provide R&M activities if it does break down. Furthermore, it is also hard to immediately replace for example a truck with spare capacity as might be possible with other types of equipment. To limit the impact of a malfunction requires an R&M network with extensive geographic coverage.
3.6.2 The Scania maintenance program
Maintenance requirements differ from one component to another and maintenance intervals are adjusted accordingly. Within Scania the recommended maintenance program can be subdivided into six different parts, each to be carried out in accordance with an overall scheme.
• D-maintenance: Carried out before the vehicle is delivered to customer
• R-maintenance: Carried out within four weeks of delivery during the running-in period
• S-maintenance: The least extensive type of maintenance carried out on a regular basis
• M-maintenance: Regular maintenance
• L-maintenance: Extensive maintenance compromising all the inspection points
• X-maintenance: Extra lubrication of the chassis
The D- and R-maintenance are only carried out once before and shortly after the vehicle has been delivered. The S-, M- and L-maintenance schemes are carried out on regular basis in a pattern: S-M-S-L...
The distance driven in between maintenance occasions depends on which operation type the vehicle is classified as and varies between 120.000 kilometres for type 0 (only if a certain engine oil is used) and 30.000 kilometres for type 4. In certain cases when trucks are idle or running other equipment through a Power Take Out for extensive periods of time maintenance intervals are adjusted accordingly.
The extra lubrication is not done on all vehicles depending on the prevailing road conditions but is otherwise carried out once in between regular maintenance occasions.
The current maintenance program is mainly based on the concept of preventive maintenance. Components are replaced with certain intervals to reduce the risk of failure and prevent degradation. However, the maintenance program also contains elements of failure based maintenance, some components are not maintained but expected to last the full lifetime of the truck.
Jobs
Most tasks in a workshop are carried out regularly as a part of R&M activity. Many of these tasks have been standardised by Scania and are called jobs. Jobs are carried out similarly by all workshops. The compensation for a particular job is set and so are the materials and the components which are needed. For Scania jobs mean less administration since the mechanic only needs to register the particular jobs that have been carried out. For customers jobs mean that the R&M is performed the same way independent of the location of the workshop.
3.6.3 Condition-Based Maintenance for vehicles
3839Most machinery failure is preceded by some sort of warning signal but in many cases the signal is not specific, thus giving little notice of individual distress before failure. However, Bloch and Geitner looking at process machinery, state that internal combustion engines often are quite viable to diagnose.
Often vehicles are serviced too early or too late since as the estimation of suitable intervals is very rough. Monitoring the condition of a vehicle and using the data collected for maintenance purposes have several advantages. These include:
• Saving money for the owner by reducing the cost for maintenance or additional wear.
• Fewer problems with operation disturbances as malfunctions are taken care of at an earlier stage.
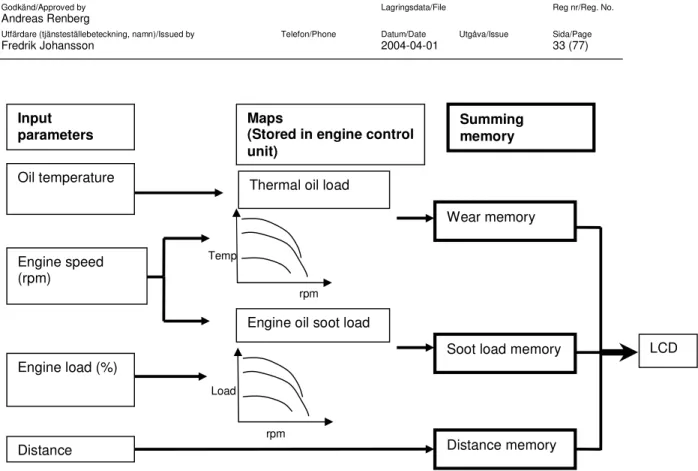
Vehicle manufacturers have used more or less sophisticated types of CBM for several years. These systems, usually based on a combination of empirical data and complementing sensors, mainly monitor the condition of engine oil. However, other properties are also often considered for example break-pad wear. Figure 7 shows a schematic illustration of Volkswagen’s monitoring system. The input parameters to the left are compared to maps in the engine control unit and based on these the control unit calculates the residual distance to the next service.
38 Kollman K, et al, Extended oil drain intervals – conservation of resources or reduction of engine life, 1998
Figure 7. Design of a condition monitoring system40
3.6.4 Repair and maintenance contracts
41With an R&M-contract the customer pays an agreed price to cover repairs and maintenance for a certain period of time. What is included in the contract mainly depends on what the specific customer needs and thus the differences between contracts can be large. Certain parts of the vehicle can thus be excluded or included in the contract, all in accordance with customer needs. However, in a great majority of the cases a contract template is used with only minor alterations. The most popular R&M package in Sweden is called “Green Card” and includes breakdown service.
From the manufacturers point of view R&M-contracts have several advantages, the main one being that they tie the customer closer to the company. R&M is often an important part of the manufacturers turn-over. The profit margin on the vehicle itself is generally not that large and the major part of the profit is generated after the initial purchase has been done, on spare parts and services. Competition to offer the lowest possible life-cycle cost is tough within the heavy vehicle segment.
40 Volkswagen AG, Self study program 224 Service Interval extension 41 Sandström O, What is repair and maintenance contracts
Oil temperature Engine speed (rpm) Engine load (%) Distance Input
parameters Maps (Stored in engine control
unit)
Summing memory
Thermal oil load
Engine oil soot load
Wear memory
Soot load memory
Distance memory LCD rpm Load rpm Temp
Improved customer contact makes it possible to gain regular feed-back on product performance. This data can then be used for design and evaluation purposes. Also if the vehicle owner carries out maintenance and repairs in an authorized workshop the market for none-manufacturer parts narrows.
For the customers a suitable R&M-contract means the possibility to focus more on the actual transport task, their core business. Ultimately the overall cost is often lower and availability better, also the financial risk of expensive repairs is covered by the manufacturer. The price paid for an R&M-contract is dependent on the type of transport and the vehicle’s specification. The length of the contract is fixed and the price can be either time or distance dependant.
3.6.5 Development of repair and maintenance
For manufacturers to provide a low total life-cycle cost and to attract profitable after sales business it is necessary to continuously develop the R&M services. However, to adapt the service program to the individual vehicle and perform necessary service only when needed is a complex process with several steps. Currently not enough is known about how operation conditions impact on the vehicle and CBM is not cost effective enough or even possible to use, in every situation. Gaining knowledge about the link between operation and wear on different subsystems is vital to design and to sell trucks with a highly competitive life-cycle cost.
3.7 Product lifecycle management (PLM)
424344The aim of PLM is to provide stakeholders with comprehensive information regarding all the phases of a products lifespan. During the life of a product a large number of people are often involved in creating, selling, using and maintaining it but information about these different operations is often scattered and remains within the department that created it. A more integrated way of sharing knowledge across functional areas helps in the understanding of the whole lifecycle of a product and how different processes influence the product over a longer period of time. If for example maintenance data from vehicle workshops was available instantly for those working in the design department problems could be rectified faster. Firms have a lot to gain if they can learn from product malfunctions and implement this knowledge during product development, almost 80% of a product’s final cost is determined at the design stage. Innovation and portfolio management, design, product data management, manufacturing planning, service management and support management are all essential contributors to PLM.
42 Dutta D, Creating a product lifecycle management development consortium, 2003 43 Fernandez F, How PLM helps, 2002
PLM is not a new tool but rather a set of different technologies linked together in a new way and from a new perspective. The concept of PLM can be compared to a big repository of data that distributes data to the right person at the correct time. Several companies deliver PLM systems but the user can adapt the system in accordance with their specific needs using software from several different suppliers. Certain standards have evolved that allow niche companies to develop software applications which are compatible with one or more core systems.