2012:60
Technical Note
Report number: 2012:60 ISSN: 2000-0456Available at www.stralsakerhetsmyndigheten.se
Handling of climate related issues in
the safety assessment SR-Site
SSM perspektiv
Bakgrund
Strålsäkerhetsmyndigheten (SSM) granskar Svensk Kärnbränslehantering
AB:s (SKB) ansökningar enligt lagen (1984:3) om kärnteknisk verksamhet
om uppförande, innehav och drift av ett slutförvar för använt kärnbränsle
och av en inkapslingsanläggning. Som en del i granskningen ger SSM
konsulter uppdrag för att inhämta information i avgränsade frågor. I SSM:s
Technical note-serie rapporteras resultaten från dessa konsultuppdrag.
Projektets syfte
Detta uppdrag fokuserar på att studera SKB:s hantering av
klimat-relate-rade frågor i säkerhetsanalysen SR-Site. Frågor som berörs är
referenskli-matcykeln, global uppvärmning samt olika scenarier med bland annat
permafrost eller extrema istjocklekar. Uppdraget går även ut på att titta på
tillförlitligheten och tolkningen av utförda analyser.
Författarens sammanfattning
SKB:s ansökan om att bygga ett slutförvar för utbränt kärnbränsle i
Fors-mark är en diger och imponerande sammanställning av forskning och
många års studier. Avsnitten om klimat, glaciation och permafrost har
suc-cesivt utvecklats genom vetenskapliga landvinningar och genom tidigare
granskningar. Mycket har förbättrats och utvecklats genom åren samtidigt
som en del nya frågetecken har uppstått och en del problem kvarstår.
När det gäller ansökans generella struktur så är det oklart på vilket sätt
resultat från studier påverkar beslutsgången samt hur flödet av
informa-tion sker mellan olika typer av studier. I tillägg till denna oklarhet så är det
svårt och omständigt att finna bakgrundsmaterial, vilket hänger samman
med att merparten av informationen ligger i SKB:s egna rapportserier.
Klimatscenariot är en modifiering av de vanligt förekommande
översätt-ningarna av syreisotopdata till temperatur, från den grönländska
inlandsis-en. Klimatserien som används i ansökan kallas ”a reference climate cycle”
vilket är ett bra namn, eftersom den kan multipliceras med ett lämpligt tal
för att beskriva hur olika processer kan påverka miljön i framtiden.
Modi-fieringen har gjorts med hjälp av en numerisk modell av en inlandsis över
Skandinavien. Det är ett pragmatiskt tillvägagångsätt som möjligen ger
en sannare bild av hur klimatet var under Weichselnedisningen. Men det
inför också en grumlighet i beskrivningen eftersom kalibreringsmodellen
drivs av klimatkurvan. Det medför att det blir mycket svårt att uppskatta
felgränser på beräknade resultat av exempelvis permafrostdjup.
Hante-ringen av felgränser är ett generellt problem i ansökan. Felgränserna är
konsekvent underskattade.
Avsnittet om glacial erosion är överraskande tunt och på intet sätt
överty-gande. Det hävdas att den glaciala erosionen under en kommande
glacia-tion kommer att vara försumbar. Slutsatsen baseras främst på morfologiska
studier av Upplands inland, d.v.s. söder om Forsmark. I motsatt riktning
berättar landskapet om avsevärd glacial erosion och studier från recenta
glaciärer och inlandsisar ger potentiella värden som är 10-20 gånger
gre än vad SKB anger. SKB måste belägga sin uppskattning mycket bättre
än vad de gör nu, alternativt omvärdera sitt påstående.
Avsnittet om glacial hydrologi är i stora drag bra, men det måste
uppda-teras från de sena arbeten som har publicerats kring den grönländska
inlandsisens hydrologi.
Projektinformation
Kontaktperson på SSM: Lena Sonnerfelt
Diarienummer: SSM2012-774
Aktivitetsnummer: 3030007-4106
SSM perspective
Background
The Swedish Radiation Safety Authority (SSM) reviews the Swedish
Nu-clear Fuel Company’s (SKB) applications under the Act on NuNu-clear
Acti-vities (SFS 1984:3) for the construction and operation of a repository for
spent nuclear fuel and for an encapsulation facility. As part of the review,
SSM commissions consultants to carry out work in order to obtain
in-formation on specific issues. The results from the consultants’ tasks are
reported in SSM’s Technical Note series.
Objectives of the project
This assignment focuses on the handling by SKB of climate-related issues
in the safety assessment SR-Site. Issues regarded are the reference climate
case, global warming case and different scenarios with for example
per-mafrost or extreme ice sheets. The assignment includes assessment of the
robustness and interpretation of the analyses performed.
Summary by the author
The application is based on research carried out over several decades and
is an impressive compilation of data and knowledge of the site of
Fors-mark. The sections on climate, glaciations and permafrost have developed
continuously through the earlier compilations reported (e.g. the
SR-97-reports). Much has been improved over the years while new question
marks have occurred and some known weaknesses still remain.
On the general structure there are some remarks on the way the process is
described in the proposal. It is unclear how new research findings can
en-ter and influence the decision process. In addition the background data
is difficult to find. The reader needs to dig deep down into the archives of
SKB to get information.
The climate scenario is a modification of the climate record received by
oxygen isotope data from the Greenland ice cores. It is called a reference
climate cycle, which is a good naming as the cycle can be multiplied by
any number to describe the future. The modification in this reference
climate cycle is made by the use of a numerical model of an ice sheet over
Scandinavia. This is a pragmatic solution which may improve our
under-standing of the Weichselian climate. But it is also somewhat problematic
as the ice sheet model used for the calibration in turn is driven by the
climate curve. The data sets are thus not independent of each other. This
makes it very difficult to estimate the accuracy in calculated results, such
as permafrost depth. The lack of true error estimations is in general a
problem all through the climate related sections. They are consequently
underestimated.
The section on glacial erosion is surprisingly poor and thus not by any
mean convincing. It is suggested that the erosion rate of future
glacia-tion will be negligible in the area, primarily based on morphological
studies on the landscape south of Forsmark. The landscape north and
east of Forsmark tells another story with much higher rates and studies on
present glaciers and ice sheets give potential numbers 10-20 higher than
the value suggested by SKB. SKB needs to support their suggestion more
convincingly or reevaluate it.
The hydrology section is basically good, but needs to be updated by new
findings on the Greenland ice sheet.
Project information
Contact person at SSM: Lena Sonnerfelt
2012:60
Author:Date: October 2012
Report number: 2012:59 ISSN: 2000-0456 Available at www.stralsakerhetsmyndigheten.se
Handling of climate related issues in
the safety assessment SR-Site
Per Holmlund
Stockholms Universitet, Stockholm, Sverige
This report was commissioned by the Swedish Radiation Safety Authority
(SSM). The conclusions and viewpoints presented in the report are those
of the author(s) and do not necessarily coincide with those of SSM.
Contents
1. General remarks ... 3
1.1. Climate and glaciers ... 3
1.2. Glacier erosion ... 6
1.3. The ice sheet model and the permafrost model ... 8
1.3.1. The climate curve ... 8
1.3.2. Permafrost ... 10
1.4. Glacial hydrology ... 11
2. References………13
2 SSM 2012:60
3
1. General remarks
The application from Swedish Nuclear Fuel and Waste Management Co (SKB) for a final storage of nuclear waste in Sweden is reviewed by the Swedish Radiation Safety Authority (SSM). This report covers the review of tasks regarding climate and glaciations. In general the application is well written and SKB have taken care of many of the critical comments given in previous evaluations. However, some problems still remain and others have arrived as the procedure is moving on and due to the fact that this is an application. The unclearness still not described is how new information and/or findings influences the decision process. What difference does it make if new scientific findings are achieved within the programme? Another way of expressing this is; is the scientific work carried out to optimize the final suggested method even if this would mean that the plans would have to be changed to a significant degree. Or is it just a justification or a “validation” of the method which is already decided? This is not clear in the wordings, and this is of crucial
importance for the credibility of the process.
Another issue in the general structure is that such a large part of the references are to SKB-reports and that important information sometimes is difficult to find. This is partly a consequence of the fact that so large portion of the work is applied research reports ordered by SKB, but it influences the reliability of the text. This problem could most probably be solved by adding more of crucial data in the final writing and also make use of more external references.
The writing in the special technical reports such as TR-10-49 is generally good. The authors are making use of peer reviewed references and the text work fine as research reports, though they also sometimes suffer from explanatory text, especially concerning the models used.
1.1. Climate and glaciers
Climate varies naturally for various reasons over different time scales. The solar radiation which is the driving force for the climate, shows only small changes over time, but the amount received on the earth surface varies due to orbital changes. These changes are cyclic and can be calculated. The earth orbit is more or less elliptic, the inclination of the earth axis changes with time and the wobbling of the earth is more or less pronounced. These components give natural fluctuations of solar radiation on the Northern Hemisphere giving the basis for the shifts between ice ages and interglacials. We can thus foresee that we are approaching a new ice age within the coming 100 000 years. Forecasts of future climate is difficult to make and the SKB approach that the next coming hundred thousand years may be rather similar to the climate during the last glaciation may thus be pragmatic and fair. The climate of the coming one million years may just be a tenfold repetition of the first glacial cycle. The climate of the last glacial cycle can be interpreted from
geological evidences. However, such time series are proxies for climatic parameters, never real climate data, and must therefore always be questioned, though they may
4
be very close to the reality. A question difficult to handle with proxy climate data is how to transfer uncertainties through several steps of calculations. This issue will be discussed more in detail below.
There is also another task on the same issue. The past is the key to understand the future, but the past is not the future. Though the Weichselian glaciation may be a good approximation for the next coming one, it is not the coming one and certainly not the successive glaciations. The uncertainties in our estimations of the future climate are very large and this is not stated clear enough. In the TR-10-49-report this is not crucial as this report concerns data and science as such, but in the TR-11-01, data from the previous report is used as hard facts which are misleading. What is meant by the extreme scenarios used? They may be extreme compared to what we believe climate was during the Weichselian, but not necessarily unlikely for the future.
The atmosphere is a necessity for life on earth. Its content of greenhouse gases increases the global mean surface temperature significantly. The modeled scenarios suggest an increased global temperature by approximately 3 degrees which is a significant change. It is on the same order of magnitude as the shifts between glacial and interglacials. One threat is an increased sea level due to melting glaciers and collapses of ice sheets. The total estimated contribution of these sources to the sea level is at maximum about 10 m. There is much more ice on earth but in a scenario with a three degree warming these ice masses are not believed to influence the sea level. The big issue here is the timetable. If this potential sea level raise is spread over 10 000 years it may not be a big problem but if it happens over 200 years it becomes a catastrophy. An increase of sea level by some meters will increase the sea water influx to the Baltic which may have an effect on the conditions in the Forsmark area. There is surprisingly little mentioned about the effect of potential positive changes in sea level on the Forsmark area. The effect may perhaps be negligible, but reading the application does not give convincing evidence for this.
The size and physical settings of glaciers and ice sheets are directly linked to the climate and its changes. Glaciers consist of ice but the properties of ice are dependent on the added forces and on thermal conditions. The effect on the substratum of a glacier or an ice sheet is thus dependent on a large number of parameters. The most important issue is whether the interface between ice and the substratum is at the pressure melting point or if it is below freezing point . The first case allows basal sliding, with access to liquid water and basal erosion. The second case does not allow any sliding at all, and thus negligible effect on the ground. In the modeling experiments carried out by SKB they have introduced the term sliding distance which is a way of expressing the erosion potential. The sliding distance is the estimated sliding speed times the years of wet basal ice coverage. This is a novel and useful way of describing erosion potential. Under a wet based ice stream the sliding distance can be a kilometer per year and in the case of a frozen interface the sliding distance is zero. This is an interesting and useful way of describing a process based on an ice sheet model. But data must be interpreted with caution as set up conditions such as grid cell size in the model influence the quantities as well as the quality of input data does. But it is very good for qualitative analyses.
5
Figure 1. Basal conditions beneath the present East Antarctic Ice sheet as interpreted from radar soundings performed during the Japanese-Swedish Antarctic expedition 2007/08 (Fujita el al 2012). The upper figure shows the relation between ice thickness and basal ice temperature conditions. The indicated layers in between the surface and the bed are annual layers with extraordinary high reflectance. They are shown to illustrate the stability of the ice sheet. The lower figure shows the route.
6
1.2. Glacier erosion
In the Technical report TR-10-49 the denudation processes are discussed and the erosion processes are highlighted as the potentially most important ones. Water erosion may not be of highest importance as Forsmark is situated close to the sea level. Glacial erosion is handled from different aspects where different methods have been used to make estimations. Values of glacial erosion from present glaciers differ significantly in different climates and for different bedrocks and different types of glaciers. The most common way of surveying erosion rate from glaciers is to measure the sediment load in the pro glacial streams (Schneider and Bronge 1996). The inter annual variability is significant, but by averaging time series reliable results can be achieved. We may though remember that the erosion rate by present glaciers in the Swedish mountains is of the order of 1 mm/year. Studies of potential total Quaternary erosion in Norwegian fiords suggest a number close to 2 mm/year (Nesje et al. 1992). However, the uncertainties are large on this issue if little is known about the settings, such as temperature of the ice, type of bedrock, ice flow velocity etc.
Estimations of total sediment load on sea floor from the Weichselian glaciation suggest low average erosion rates and studies of the denudation rate of the
Precambrium Peneplain also suggest low rates. Thus the conclusion in the technical report is that, based on the uncertainties and the studies of the Peneplain, glacial erosion can be neglected as the expected rates for the coming million years is on the order of 10 m according to SKB. This is acceptable for the TR-09-18 report as it is based on the methods mentioned with their values and limitations. But it is an unacceptable simplification for the TR-10-49 report. The statements are poorly supported and they may be totally wrong As studies from present glaciers suggest values 20 times larger.
First of all, Forsmark is situated at the southeastern coastal line of the Gulf of Bothnia. The erosion rates north of Forsmark are not considered though this area may be more relevant than mainland Uppland. Secondly, what is really known about the real bedrock relief? The fact that the low hills are remnants of the old Peneplain does not exclude existence of till and clay filled eroded vallies. Thirdly, the archipelago outside Forsmark is an excellent example of glacially eroded surfaces and we also have deep troughs towards Åland which may well be examples of severe glacial erosion. A potential erosion rate of some tens of meters for a glaciation is not unrealistic, based on marine geologic evidence and reasonable erosion rates.
Let us try to visualize a scenario when the coastline is more or less at its present site and the air temperature drops. Glaciers will expand in the mountains and permafrost will develop on land. The large lakes and Gulf of Bothnia will remain warm spots in the landscape. When a cold glacier expands over a permafrost landscapes and reach a lake it will slide quickly over the substratum and sediments will freeze on to the glacier sole at the downstream side. In an initial phase erosion will be significant in a process to elongate the lake. If the lake is large enough the sliding conditions will influence the stress field in the ice in such a way that an ice stream is formed and if topography allows, it can be semi stable in time and thus a significant impact on the glacial erosion. One such example might have been the trough where the Gulf of
7
Bothnia is situated, the ice was thick and the basin is deep. During the maximum phase of the Weichselian glaciation the ice divide was situated somewhere in the northern part of the Gulf of Bothnia. If we consider the length of flowlines at this stage we can see that the longest one is the path through the Baltic basin and then turning westwards towards Denmark. It is more than twice as long as a
corresponding flowline directed towards the west coast. It must by necessity be governed by basal conditions indicating an ice stream like flow in the Baltic, a Baltic Ice Stream. This Ice stream show up in most modeling experiments including the one used by SKB. The conclusion to be drawn is that the potential erosion rate in the trough of Gulf of Bothnia is significant, while it is potentially not as significant on present day land surfaces. The potentially higher erosion rates in the Baltic basin is briefly mentioned in the application, but not considered.
This process of ice stream formation can be studied on present day glaciers and ice sheets. The ice streams A-E entering the Ross Ice shelf have been studied for decades showing both the delicate boundary between fast sliding ice and more stagnant ice. Another example of a related phenomena is studied at Lake Vostok on East Antarctica. This lake is believed to have preexisted the glaciations and “always” been there as a lake. When the glacier moves over it the basal ice is melting on the upstream side and lake water refreezes on the downstream side of the lake. Up to several hundred meters of refrozen water and sediments are attached underneath the ice downstream Lake Vostok. The sediments frozen onto the ice sheet sole is the mechanical tool needed for an efficient glacial erosion. This is a good analogue to the north coast of Uppland, and we know that the clays all over Uppland include limestone from the Gulf of Bothnia. There are smaller scale examples on such events on glaciers in northern Sweden and else in subarctic and arctic environments.
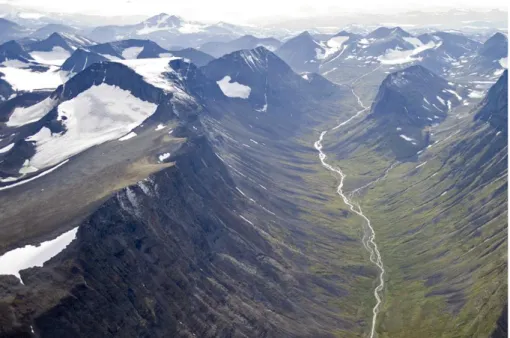
To summarize this criticism we can look at a figure showing a mountain in Swedish Lapland. The vallies surrounding it are deeply glacially eroded while the top surface is well preserved. Studies of exposure rates and excavations in till show that the erosion rates have been negligible during the last glaciations though it has been ice covered during several phases of the glaciations(Kleman and Stroeven 1997). The vallies are eroded during other phases of the glaciations, probably mostly during initiation phases of glaciations. Imagine now that we were aiming at putting a repository at the edge of the mountain top plateau. The method SKB have chosen is to study the well preserved top plateau and they do not consider the vallies. The only consideration made is a measure of the total erosion rate which in this case equals taking an average of the county of Norrbotten which in this case is an irrelevant number as the spatial variability in glacial erosion is tremendous.
The issue of glacial erosion must be considered much more seriously. The conclusions drawn in the report are not justified. The suggested erosion rate of maximum 10 m in a million years can just as well be 200 m as Forsmark is situated so close to sites with documented high eroding rates. 200 m corresponds to 200 000 years of glacial erosion at a rate of a glacier in northern Sweden today.
8
Figure 2: Stour Räitavagge in the Kebnekaise massif in Northern Sweden. This valley is often used to illustrate the magnificent force of glacial erosion. However, on Mount Räitatjåkka to the left there is hardly no glacial erosion though the mountain has been ice covered during several ice ages.
1.3. The ice sheet model and the permafrost model
The ice sheet model used by SKB has been operational for more than two decades and is well reputed in the scientific community. But it has short comings in its basal handling of the physics though it has been refined over years. For a reader of the SKB technical report it is almost impossible to find all details in the way the model is handling different issues. Different types of tunings must be examined and justified. This is not necessarily the case in a pure scientific paper, but in this case when resultant data are used for other purposes it is quite important. The same critisism is valid for the permafrost model which is used as a black box. It is there somewhere and we shall trust the results but we are not introduced into how physics are handled. A new report is needed where these models are described in detail and also includes a valuation of its performance from the users.
1.3.1. The climate curve
The driving force for the models is the climate curve extracted from the Greenland GRIP ice core (Johnsen et al. 1995). This is probably the most advanced climate record available. It contains information on atmospheric content and composition for at least the last 110 kyrs. Stable isotopes of oxygen and hydrogen are used to establish a temperature record based on present day empiric relations between
9
temperature and isotope fractionation. The isotope ratio varies with temperature but it varies also with other parameters like amount of total ice on land (globally), source of water to the air mass, number of precipitation outfalls on its path, changes in sea ice distribution, changes in distribution of precipitation over the year and changes in ice sheet configuration over time (Vinther et al. 2009). All of these variables have varied during a glaciation and from the glaciation to the present. The scientific community is well aware of that, but the problem is how to handle the uncertainty when the outcome of a modeling experiment is further used as true data. We must remember that these proxy climate datasets (Johnsen et al 1995) are partly used to tune the models which are somewhat problematic in this case.
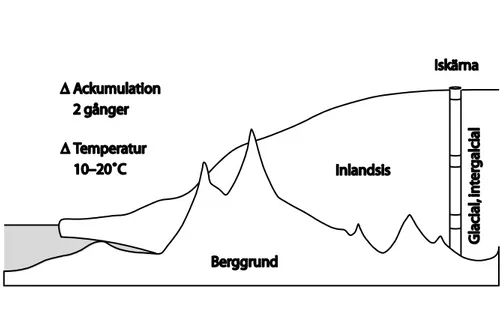
Figure 3: In Antarctica and on Greenland the precipitation rate during a glacial is about 50% of
the interglacial rates, and the corresponding temperature change is 10-20 degrees. These different climate zones are well covered by present day conditions by moving from the coastal area up to the top of the Ice sheet. On East Antarctica typical annual mean temperatures by the coast are -10- -15 oC and on top of the ice sheet the temperature is about -50 oC. The
precipitation rate by the coast is 500-1000 mm and only 30-50 mm on the summit. This width of temperatures and precipitation rates are used to establish relationships between stable isotope ratios in the snow/ice and climate parameters valid for the present climate.
In the present report SKB has taken a pragmatic step and made use of the ice sheet model to tune the climatic curve. Known past extents of the ice sheet have been used to adjust the climate curve and the result is the reference glacial cycle. There are reasons to believe that the results are improved compared with the original Greeland ice core proxy climate scenario (GRIP) which is based on a relation which cannot be valid for the entire glaciations as it is based on present day conditions. But the SKB method also introduce an obvious problem. The data sets are not independent of each other so in terms of uncertainty in model results we are totally lost.
In summary there is a need for a fair declaration of uncertainties expressed as error bars. This may be a difficult task but it is a necessity for future work.
10
Figure 4: Stable isotope curve from the GRIP ice core on Greenland. In order to date an ice
core several methods are used. First of all annual variations in stable isotopes and other chemical compounds are used to count annual layers. Volcanic ash is used for datings. In the lower part a model is used for ice deformation to establish a chronology covering the whole length of the ice core. To the right the core is seen as it was sampled. The first half of the core covers approximately 10 000 years and the second half covers more than 100 000 years. The curve to the left shows the adjusted curve using time as Y axis.
1.3.2. Permafrost
The permafrost calculations are very well illustrated and the results are most interesting. However, there are two main problems, which I have already touched on. First of all there is a need for a description of the model with a declaration of its shortcomings and how physics is handled. Secondly, considering the uncertainties in the climate curve used it is not at all clear if the extreme scenarios really are that unbelievable as is expressed in the text. An additional figure combined with error bars from the forcing curve and from these calculations would be a helpful tool to judge the realism in the statements made.
11
1.4. Glacial Hydrology
The hydrology section is to a large extent based on the technical report TR-06-34 with additions from TR-10-68. The older report is very general and make basically use of temperate or polythermal glaciers with limited relevance to an ice sheet. The TR-10-49 report which is of concern in this review, only little of present ongoing research on the Greenland ice sheet is considered. This is partly an effect of the timing of the report. Research on hydrology and ice dynamics on Greenland outlet glaciers is a hot topic. This is to a large extent driven by the IPCC process. In 2007 the fourth IPCC report was published which indirectly highlighted the need for research on Greenland, as major changes in the dynamics of this ice sheet was observed since the turn of the century and this was not considered at all in the IPCC report (Joughin et al. 2008). The dynamics and the hydrology of the outlet ice streams on Greenland will be of highest concern in the next coming issue of IPCC. Thus, advanced and relevant scientific compilation will be available during the coming year.
There are several uncertainties not yet solved. The link to the thermal condition within the ice is obvious. We simply need to know the temperature of the ice body and at the base. This determines the viscosity of the ice and the potential occurrence of liquid water within the ice body. We also need a better understanding of the way water penetrates a cold ice body and how water pressures vary at the base
considering sudden openings of moulins emptying lakes at the ice surface. Such occasional openings influence the groundwater flow beneath the ice as it leads to injection of large amounts of water at spot like sites (Clason et al 2012, Strömberg 2010, Zwalley et al. 2002).
Another task that should be considered in the hydrology section is the new findings concerning subglacial lakes on Antarctica (Siegert et al 2005). The Gulf of Bothnia is a potential site for such a lake to form. There are no findings of lakes beneath the Greenland ice sheet but this does not exclude the existence of subglacial lakes beneath a Scandinavian ice sheet. Being there or not has major impact on potential glacial erosion and on access to water beneath the ice.
All these new findings have significant relevance to a repository located at Forsmark. There is an obvious need for a revision of this part
Ice Sheet
150 m Yoldia Sea
(The Baltic)
Meltwater channel
Figure 5:A sketch of the receeding Weichselian ice front over Forsmark some 10 000 years
ago. Assuming a temperature at the pressure melting point at the bottom allows water to flow and erosion and deposition of sediments to occur. The direction of the drainage will be
12
determined by the ice load and can be calculated. But, when sudden pathways are opened between the ice surface and the ice bottom this hydraulic system is disturbed in a manor determined by the distribution of moulins in the ice and the access to surface water. This disturbed system allows both pressure drops and extreme over pressurized events to occur.
Figure 6:There are many sites where extreme glacial erosions have occurred where access to
large water masses have co acted. Landforms can be seen in the Stockholm archipelago where the rocks are newly exposed by the isostatic uplift. These examples are from Väderöarna on the west coast of Sweden and from the Abisko mountains.
13
2. References
Clason, C., Mair, D.W.F., Burgess, D.O., Nienow, P.W., 2012: Modelling the delivery of supraglacial meltwater to the ice/bed interface: application to south west Devon Ice Cap, Nunavut, Canada. Journal of Glaciology 58(208): 361-374.
Fujita, S., Holmlund, P., Matsuoka, K., Enomoto, H., Fukui, K., Nakazawa, F., Sugiyama, S., Surdyk, S., 2012: Radar diagnosis of the subglacial conditions in Dronning Maud Land, East Antarctica. The Cryosphere, accepted.
Johnsen, S.J., Dahl-Jensen, D., Dansgaard, W., Gundestrup, N., 1995: Greenland paleotemperatures derived from GRIP bore hole temperature and ice core isotope profiles. Tellus 47B: 624-629.
Joughin, I., Das, S.B., King, M.A., Smith, B.E., Howat, I.M., Moon, I., 2008: Seasonal speed up along the western flank of the Greenland Ice Sheet. Science 320: 781-783.
Kleman, J., Stoeven, A.P., 1997: preglacial surface remnants and
Quaternary glacial regimes in north western Sweden. Geomorphology 19: 35-54.
Nesje, A., Dahl, S.O., Valen, V., Östedahl, J., 1992: Quaternary erosion in the Sognefjord drainage basin, western Norway. Geomorphology, 5: 511-520.
Schneider, T., Bronge, C., 1996: Suspended sediment transport in the Storglaciären drainage basin. Geografiska Annaler 78 A (2-3): 155-161. Siegert, M.J., Carter, S., Tabacco, I., Popov, S., and Blankenship, D.D., 2005: A revised inventory of Antarctic subglacial lakes. Antarctic Science 17(3): 453-460.
Strömberg, B., 2010: Rare forms of meltwater erosion on bedrock: polished flutes in the Åland Sea area, Sweden-Finland. Annales Academiae
Scientiarum Fennicae Geologica-Geographica 169: 40 pp.
Vinther, B.E., Buchardt, S.L., Clausen H.B. Dahl-Jensen, D., Johnsen, S.J., Fisher, D.A., Koerner, R.M., Raynaud, D., Lipenkov, V., Andersen, K.K., Blunier, T., Rasmussen, S.O., Steffensen, J.P. & Svensson, A.M., 2009: Holocene thinning of the Greenland ice sheet. Nature letters, vol 461: 385-388.
Zwally, J.H., W. Abdalati, T. Herring, K. Larson, J. Saba and K. Steffen. 2002. Surface Melt Induced Acceleration of Greenland Ice Sheet Flow, Science, 297: 218-222.
14 SSM 2012:60
15
APPENDIX 1
Coverage of SKB reports
[Insert a description of the achieved coverage of SKB reports.]
Table X:XXXX
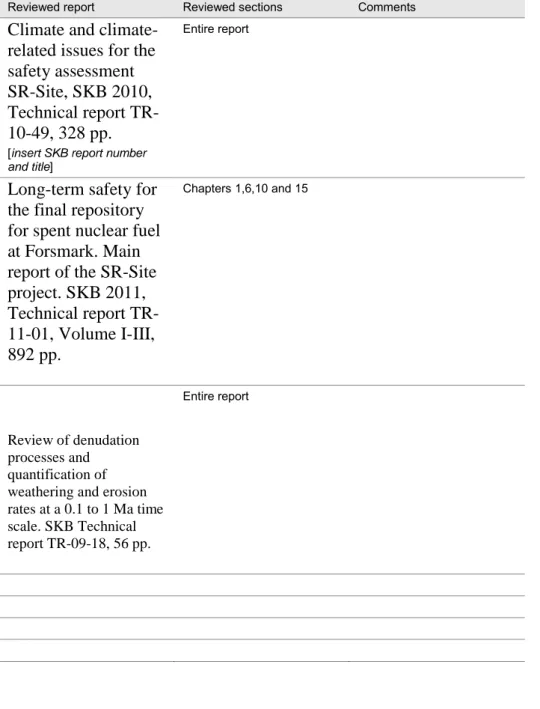
Reviewed report Reviewed sections Comments
Climate and
climate-related issues for the
safety assessment
SR-Site, SKB 2010,
Technical report
TR-10-49, 328 pp.
[insert SKB report number
and title]
Entire report
Long-term safety for
the final repository
for spent nuclear fuel
at Forsmark. Main
report of the SR-Site
project. SKB 2011,
Technical report
TR-11-01, Volume I-III,
892 pp.
Chapters 1,6,10 and 15 Review of denudation processes and quantification of weathering and erosion rates at a 0.1 to 1 Ma time scale. SKB Technical report TR-09-18, 56 pp.Entire report
16 SSM 2012:60
17
APPENDIX 2
Suggested needs for
complementary information
from SKB
1. The decision process is unclear. To what extent will research findings influence the final decision and how are results implemented in related scientific fields?
2. Background data is difficult to reach. It is not acceptable that a whole library of SKB reports is needed to understand the content of the present report.
3. The acceptance of using the Weichselian glaciation as a type-glaciation does not mean that this is a valid forecast for the future. It is just one possible development. Discussions concerning extreme events must thus be handled with more care.
4. The declaration of uncertainties in calculations and estimations must be improved. Especially how uncertainties are transferred from one estimation to another.
5. The estimation of future glacial erosion needs a revision. The present statements are far too poorly supported to be trustworthy.
6. The way the models used for ice sheet configuration and for permafrost development are handling the physics need a more careful presentation including a self-evaluation made by the model managers.
7. The reference climate cycle needs to be more transparent. The dependency between the climate record and the ice sheet model also need more
explanation and finally there is a strong need for an estimation of error bars on the record.
8. The permafrost calculations are not transparent and they are too focused on the reference glacial cycle.
9. The glacial hydrology section needs to be updated including new research findings from Greenland and Antarctica, data of highest concern for a repository at Forsmark.
18 SSM 2012:60
19
APPENDIX 3
Suggested review topics for
SSM
1. The decision process is unclear. To what extent will research findings influence the final decision and how are results implemented in related scientific fields?
2. Background data is difficult to reach. It is not acceptable that a whole library of SKB reports is needed to understand the content of the present report.
3. The acceptance of using the Weichselian glaciation as a type-glaciation does not mean that this is a valid forecast for the future. It is just one possible development. Discussions concerning extreme events must thus be handled with more care.
4. The estimation of future glacial erosion needs a revision. The present statements are far too poorly supported to be trustworthy.
5. The reference climate cycle needs to be more transparent. The dependency between the climate record and the ice sheet model also need more
explanation and finally there is a strong need for an estimation of error bars on the record.
6. The permafrost calculations are not transparent and they are too focused on the reference glacial cycle.
7. The glacial hydrology section needs to be updated including new research findings from Greenland and Antarctica, data of highest concern for a repository at Forsmark.
2012:60 The Swedish Radiation Safety Authority has a comprehensive responsibility to ensure that society is safe from the effects of radiation. The Authority works to achieve radiation safety in a number of areas: nuclear power, medical care as well as commercial products and services. The Authority also works to achieve protection from natural radiation and to increase the level of radiation safety internationally. The Swedish Radiation Safety Authority works proactively and preventively to protect people and the environment from the harmful effects of radiation, now and in the future. The Authority issues regulations and supervises compliance, while also supporting research, providing training and information, and issuing advice. Often, activities involving radiation require licences issued by the Authority. The Swedish Radiation Safety Authority maintains emergency preparedness around the clock with the aim of limiting the aftermath of radiation accidents and the unintentional spreading of radioactive substances. The Authority participates in international co-operation in order to promote radiation safety and finances projects aiming to raise the level of radiation safety in certain Eastern European countries.
The Authority reports to the Ministry of the Environment and has around 270 employees with competencies in the fields of engineering, natural and behavioural sciences, law, economics and communications. We have received quality, environmental and working environment certification.
Strålsäkerhetsmyndigheten Swedish Radiation Safety Authority
SE-171 16 Stockholm Tel: +46 8 799 40 00 E-mail: registrator@ssm.se