An index to cottonwood establishment potential
Robert T Milhous1Hydrologist, Fort Collins, Colorado 80526
Abstract: The logic and an application of a program that calculates the potential for the
establishment of cottonwood and other riparian tress along rivers in arid North America is the topic of this paper. Establishment of cottonwood is essentially restricted to riverine sites that are moist and have clean substrate. Seedlings can become established on moist, open areas along the edge of the channel and within the channel. Streamflows following establishment may remove many of the seedlings. Data for a USGS gage on the Virgin River in Southwestern Utah is used as an example in the presentation of a computational procedure for an index to the potential for establishment. Three indices are presented: 1) peak streamflow establishment, 2) linked peak streamflow establishment, and 3) establishment width. Peak Streamflow establishment index: a commonly held view is that floods establish the vegetation in the riparian zone of a river; the peak streamflow establishment index is the magnitude of the annual maximum streamflows that exceed the bankfull discharge. Linked peak streamflow establishment index: a concern with the peak streamflows establishment index is that seeds deposited on substrate may germinate and seedlings grow but if the substrate is in the stream channel the seedlings will be destroyed by streamflows following establishment during the next couple of years; the linked peak streamflow index for a year is zero if the streamflows in a destruction period following the establishment period are higher. Width establishment index: the logic is the same as the linked peak streamflow index with the streamflows transformed to a width related factor. The concepts related to the width index illustrate the linking of peak streamflows to following streamflows.
1. Introduction
The logic and an application of a program that calculates the potential for the
establishment of cottonwood and other riparian tress along rivers in arid North America is the topic of this paper. Friedman et al (1995) showed that the failure of cottonwood reproduction along a dammed, channelized reach if Boulder Creek in Colorado results from scarcity of bare, moist surfaces suitable for seedling establishment. After presenting these observations they continued with the following:
Recruitment of plains cottonwood is essentially restricted to sites that are not only moist and open enough for seedling establishment but also free from lethal scour during subsequent higher flows. Along meandering streams, seedlings become established on moist, open point bars; then sediment accretion and channel migration gradually decrease the shear stress experienced by the young trees during higher flows. In addition,
successful recruitment may occur on higher surfaces when an exceptional flood clears and wets areas that are high enough to avoid subsequent scour for several years Along Boulder Creek and many other streams below dams, flow regulation has reduced peak flows, thus decreasing the meandering rate and eliminating the occasional formation of open patches high above the bed. As a result, the only sites bare and moist enough for establishment are low, scour-prone surfaces unsuitable for long-term survival. (page 553)
These concepts are the basis of the establishment indices presented herein.
presentation of the establishment model. One issue in calculation of the establishment index is the selection of the annual streamflows when the maximum streamflows are used. One option is to use to use the instantaneous peak discharges; the other is to use the
maximum daily discharges. The first section of this paper discusses the selection of the appropriate maximum discharges. The three sections following the discussion of
maximum discharge selection present the three indices to the establishment of cottonwood on western streams.
1.1. Virgin River near Hurricane, Utah
Before starting the presentation of the index model it is important to know something about the data used to illustrate the use of the calculation of the establishment indices. The streamflow data used is for the Virgin River near Hurricane, Washington County, Utah. (USGS station number 09408150). The data was measured by the U.S. Geological Survey. The present location of the gage is 1.8 miles downstream of Quail Creek at the State
Highway 9 Bridge, 5.2 miles west of Hurricane. Other locations of the gage have been at a site 100 feet downstream and at a site 1.2 miles upstream. Since 1985, streamflows are diverted about 14 miles upstream into a pipeline that feeds Quail Creek Reservoir (capacity 40,000 acre-feet) and since 2003 into Sand Hollow Reservoir (capacity 51,400 acre-feet). Water is released from Quail Creek Reservoir to the Virgin River during low flow periods. The watershed area is 1,493 mi² with a measured average annual discharge of 208 cfs. The period of record is March 1967-present. Some data used was measured on the Virgin River above Quail Creek (09408135) 2.5 mi upstream of Quail Creek and 4.4 mi upstream of State Highway 9 Bridge. The watershed area is 1,314 mi².
The annual peak discharges measured at the USGS on the Virgin River near Hurricane, Utah are presented in Figure 1. On 1 January 1989 a wing-dam impounding the reservoir on Quail Creek failed releasing a large amount of water to the Virgin River just above the gage (Carlson, 1995). No measured data is available for the gage from the date of failure until the beginning of water year 1991. USGS estimated discharges for the remainder of January and measured data for the above Quail Creek gage beginning in mid-February 1989 and continuing thru water year 1990 are available. The USGS estimates of peak and maximum daily discharges at the site of the stream gage are presented in Table 1. Also in the table are estimates of the discharges that might have occurred at the gage location if the wing-dam had not failed. The estimated peak discharges without dam failure are the same as were measured at the site above Quail Creek; the maximum daily discharges are the maximum daily discharges above Quail Creek transformed to the location of the gage. The daily data for water year 1989 used in the analysis in following sections was measured (October thru December 1988), USGS estimates for January 1989 with the dam-break impacts on the daily streamflows removed, daily values measured by USGS above Quail Creek transformed to the gage near Hurricane gage location (15 February thru the rest of the water year), and estimates based on Virgin River gages both upstream and downstream of the Hurricane gage for the first half of February 1989. The daily values for water year 1990 are based on the measurements made at the above Quail Creek gage.
0 10000 20000 30000 40000 50000 60000 70000 1967 1977 1987 1997 2007 P ea k di sch ar ge , cf s Water year normal dam-break
Figure 1. Annual peak discharge in the Virgin River near Hurricane, Utah (USGS station 09408150). The
water year is from 1 October thru 30 September. (No data for water year 1990).
Table 1. Maximum daily and peak discharges that were estimated by the USGS to have actually occurred
and estimates of the discharges that would have occurred if the wing-dam had not failed. Virgin River near Hurricane, Utah (USGS station 09408150).
Maximum daily discharge, cfs Peak discharge, cfs Water year Discharge, cfs Date Discharge, cfs Date
USGS 1989 13200 1 January 66000 1 January
Estimated without dam-break 1989 583 3 March 1840 18 August Estimated from above Quail Creek 1990 541 23 September 3370 23 September
1.2. Vegetation in Virgin River Riparian Zone
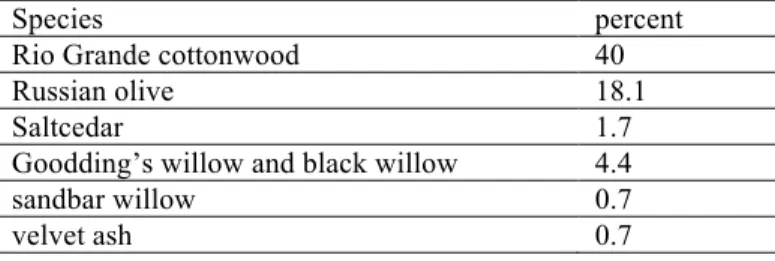
Auble and others, 2012, measured the dominated species in areas of the Virgin River at Virgin, Utah. Virgin, Utah is upstream of Hurricane, Utah. The results of their
measurements are presented in Table 2.
Table 2. Vegetation found near the USGS gage on the Virgin River at
Virgin, Utah (station number 09406000). Data from Auble et al, 2012.
Species percent
Rio Grande cottonwood 40
2. Instantaneous peak versus maximum daily discharge
There are two maximum annual discharge values available from USGS water data files, the first is the maximum instantaneous maximum discharge and the second is the maximum of the daily values. The instantaneous maximum discharge is usually called the peak discharge. In snow-melt rivers there is usually relatively little difference between the annual peak discharge and annual maximum daily discharge. Rivers in basins with strong thunderstorms often have considerable differences between the instantaneous peak and maximum daily discharges (the Virgin River is one of these). Which is best for ecological studies? Depends on the study; in establishment of trees there must be time to remove debris from the establishment surface (as cleaning discharge time tends toward zero substrate cleaning goes to none). In the approach presented in this paper the maximum daily discharge will be used. Never-the-less, knowing the difference between peak and maximum daily discharges for the river being studied is appropriate and informative.
A log-Pearson Type III analysis was made of both the maximum daily and peak discharge set for water years 1967 thru 2012 (estimated discharges values presented in Table 1 were used for 1989 and 1990). The more frequent frequency values are important for the establishment of trees. These are presented in Table 3.
Table 3. Return periods of the maximum daily and peak discharges calculated using a
log-Pearson Type III analysis with data skew. Data is for water years 1967 – 2012. Return period (years) Maximum daily discharge, cfs Peak discharge, cfs 1.67 1010 3940 2.0 1400 4420 5 2970 8990 10 4900 12150
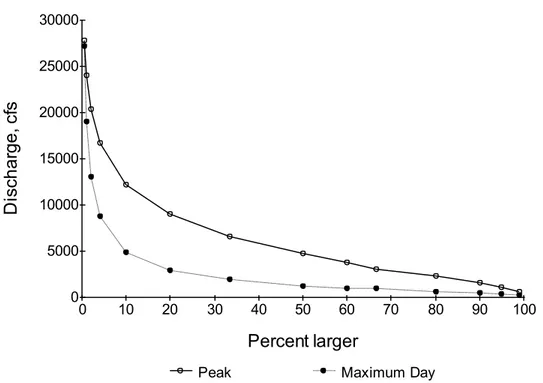
The relation between return period and discharge for both annual peak and daily discharges are also presented in Figure 2. The reader is responsible for the assessment and interpretation of flood-frequency data in Table 3 and in Figure 2 for other than the
establishment of trees. A significant reason for using daily maximum discharges instead of peak discharges is because mixing peak discharges with daily discharges in rivers with large differences between daily maximum and peak discharges gives a less than clear picture of the processes in the river and in the riparian zone.
3. Peak Streamflow Establishment Index
A commonly held view is that floods establish the vegetation in the riverine riparian zone. In this section flood discharges on the Virgin River near Hurricane are investigating. The measured annual maximum daily discharges are presented in Figure 3. The annual peak discharges are also shown on the figure. Not all the maximum daily discharges will result in the establishment of trees. In almost all years, seeds deposited on substrate will germinate and seedlings grow but if the substrate is in the stream channel the seedlings will be destroyed by streamflows that fill the channel bottom sometime during the next couple of years.
0 5000 10000 15000 20000 25000 30000 0 10 20 30 40 50 60 70 80 90 100 D isch a rg e , cf s Percent larger
Peak Maximum Day
Figure 2. Return periods of the maximum daily and peak discharges calculated using a log-Pearson Type III
analysis with data skew. Data used is for water years 1967 – 2012.
0 5000 10000 15000 20000 25000 1967 1977 1987 1997 2007 M ax im um d ai ly o r pe ak d is ch arg e, c fs Water year
The annual maximum discharges were divided into two classes, establishment and non-establishment streamflows, based on the assumption that any seedling growing from a seed deposited on a surface at an elevation below bankfull will not survive for long. An
additional assumption is made that the bankfull discharge will be similar to the maximum daily discharge with a return period of 1.67 years. The discharge with a 1.67 year return period is 1010 cfs (see Table 3). The maximum daily streamflows split into establishment and non-establishment streamflows is shown in Figure 4. The establishment index is the magnitude of the streamflows that are establishment streamflows and zero for the non-establishment streamflows. It is probable that the higher three or five maximum annual discharges may be the streamflows that make the conditions good for establishment of cottonwood trees – but what about the others?
0 2000 4000 6000 8000 10000 12000 14000 1968 1978 1988 1998 2008 M a xi m u m d a ily d isch a rg e , cf s Water year
establish non-establish 1.67 year discharge
Figure 4. Annual maximum daily discharges measured at the USGS gage on the Virgin River near
Hurricane, Utah (09408150).
4. Linked Peak Streamflow Establishment Index
An algorithm has been developed to calculate two indices to the establishment of cottonwood in western river floodplains based on the daily streamflows. The logic is based on cottonwood trees where a clean substrate is required prior to the dispersal of seeds. The indices can also be considered to be indices to the establishment of riparian vegetation along many rivers. The first of the two indices is presented in this section. The index is based on peak daily discharge and the daily streamflows following the
establishment period.
The peak discharge during the establishment period is the index to riparian vegetation (cottonwood) establishment. The first assumption is that a clean substrate results if the streamflows cover a stream bed area during the germination period (in the Virgin River
this was taken as 15 April thru 15 July). The second assumption is that the seedlings survive if the streamflows during the remainder of the current water year and the whole of the following water year (for the Virgin River this was 16 July through 30 September of the following water year) does not exceed the flows during the germination period. The index is the magnitude of the maximum streamflow during the establishment period. The linked peak streamflow index for the Virgin River near Hurricane is presented in Figure 5. A minimum discharge of 1010 cfs was used in the analysis.
0 500 1000 1500 2000 2500 3000 1968 1978 1988 1998 2008 E st a b lish m e n t d isch a rg e , cf s Water Year
Figure 5. Linked peak streamflow establishment index for the Virgin River near Hurricane, Utah shown as
the maximum discharge during the establishment period (15 April-15 July).
The linked peak streamflow establishment index is less than the index based on the annual maximum daily streamflows because the linked index is based on daily streamflows in the establishment window. Most of the annual maximum daily discharges are outside the establishment window as is shown in Figure 6.
The two largest maximum daily discharges shown on Figure 6 occurred in the winter and well outside the establishment window (13700 cfs on 11 January 2005 and 13400 cfs on 21 December 2011). As Figure 6 shows, this is normal for the Virgin River. Seed dispersal is later in the year during the spring runoff period which has significantly lower stream streamflows than is typical for the winter period. Relatively short, but intense, thunderstorms occur in the summer which has been assumed (because daily values are used) to not have as much impact on cottonwood establishment as longer event
0 2000 4000 6000 8000 10000 12000 14000 0 50 100 150 200 250 300 350 400 M a xi m u m d a ily d isch a rg e , cf s
Day from 1 November
Figure 6. Day of annual maximum daily discharges and the magnitude of the discharge. Data for the Virgin
River near Hurricane, Utah. Period of record is 1968-2012.
5. Establishment Width Index
The Establishment Width Index is similar in concept to the linked peak flow index. The width of a river is calculated using the simple power law W=A*(Q**b) where W is the width, Q the stream flow, and a and b constants. If the streamflow available to prepare an area for cottonwood establishment during the establishment period is QEST, and the discharge following the establishment period limiting the area available for establishment is QDST. Then the width available for establishment (WEST) is WEST=A*((QEST**a) - (QDST**b)). Dropping the a-term gives an index of ESTI = (QEST**b) - (QDST**b). For the Virgin River the establishment discharge was the maximum average 4-day discharge in the period germination period. QDST was the maximum average daily
discharge in the rest of the water year and the following water year. A minimum discharge can be specified that essentially prevents the index from being other than zero when the streamflows in the establishment period are less than the specified minimum. Typically the minimum discharge will be the bankfull discharge.
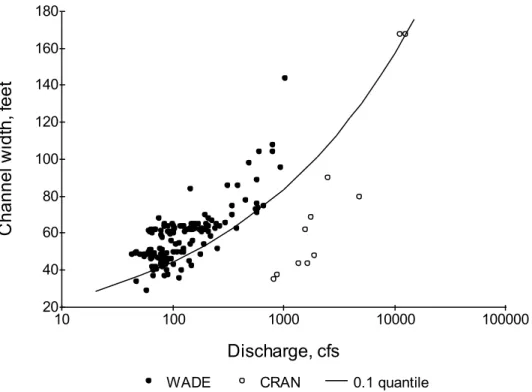
An important task in the application of the width based index is the selection of the b-term. Information on width as related to discharge is available from the discharge
measurement summaries obtained from the USGS web page for the gage. Data is available for a number of years but the gage has been move around a bit. The best data is probably for 1993 – 2008 followed by data for 2008-2012. The data for 1993 – 2008 are presented in Figure 7. Table 4 is a summary of the power terms based on the two periods and least absolute deviation regression and 0.1-quantile regression. The value for 1993 – 2008 and 0.1-quantile regression was selected for use in the calculation of the establishment width
index.
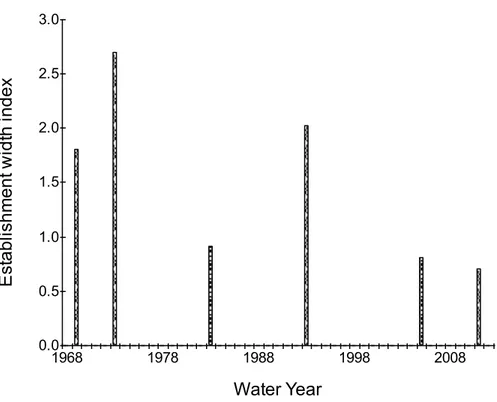
The width establishment index model calculated using the 2 has been applied to daily streamflows in the Virgin River (See Figure 8). The power term used in the calculations was 0.27 and the minimum discharge was the peak discharge exceed 1 in 1.67 years (1010 cfs). 20 40 60 80 100 120 140 160 180 10 100 1000 10000 100000 Ch a n n e l wid th , f e e t Discharge, cfs
WADE CRAN 0.1 quantile
Figure 7. Channel width as related to discharge near the gaging station on the Virgin River near Hurricane,
Utah for 1993 – 2008. CRAN is measurement made using a bridge crane. The CRAN data was not used to fit the 0.1 quantile relation.
Table 4. Power terms in the width as related to discharge based on different periods and relations. Data for
the Virgin River near Hurricane, Utah. Based on data in the USGS discharge measurement summaries.
1993-2008 2008-2012 Least absolute deviation 0.2471 0.2273
0.1 quantile 0.2740 0.2346
6. Discussion
Computation procedures for the calculation of an index to the potential for the
establishment of cottonwood trees and similar vegetation have been the topic of this paper. It is important to remember the index gives information on the potential for establishment and not the actual establishment of trees.
0.0 0.5 1.0 1.5 2.0 2.5 3.0 1968 1978 1988 1998 2008 E st a b lish m e n t w id th in d e x Water Year
Figure 8. Width establishment index for riparian vegetation along the Virgin River near Hurricane, Utah.in
the Poudre River, Colorado. The minimum discharge for establishment is 1010 cfs and the power term in the width equation is 0.27.
References
Auble, Gregor T, Jonathan M. Friedman, Patrick B. Shafroth, Michael F. Merigliano, and Michael L. Scott. 2012. Woody Riparian Vegetation near Selected Streamgages in the Western United States. U.S. Geological Survey Data Series 708. U.S. Geological Survey Fort Collins, Colorado. 8 pages.
Carlson, Darrell D. and David F. Meyer. 1995. Flood on the Virgin River, January 1989, in Utah, Arizona, and Nevada. Water-Resources Investigations Report 94-4159. U. S. Geological Survey. Salt Lake City, Utah.
Friedman J. M., M. L. Scott, and W. M. Lewis, Jr. 1995. Restoration of riparian forest using irrigation, artificial disturbance, and natural seedfall. Environmental Management 19:547–557. Springer-Verlag New York
Milhous, R.T. 1994. Instream flows and cottonwood establishment in the Bosque del Apache reach of the Rio Grande. in R.A. Marston and V.R. Hasfurther (eds.). Effects of human-induced hydrologic systems. Proceedings of the Annual Summer Symposium of the American Water Resources Association. Jackson Hole, WY: American Water Resources Association. p. 535-5.
Scott, Michael L, Gregor T Auble and Jonathan M Friedman. 1997. Flood Dependency of Cottonwood Establishment along the Missouri River, Montana, USA. Ecological Applications, 7(2), 1997, pp. 677– 690.