This is an author produced version of a paper published in Clinical Oral
Implants Research. This paper has been peer-reviewed but does not include
the final publisher proof-corrections or journal pagination.
Citation for the published paper:
Bertl, Kristina; Mick, René-Bernard; Heimel, Patrick; Gahleitner, André;
Stavropoulos, Andreas; Ulm, Christian. (2018). Variation in bucco-palatal
maxillary sinus width does not permit a meaningful sinus classification.
Clinical Oral Implants Research, vol. 29, issue 12, p. null
URL: https://doi.org/10.1111/clr.13387
Publisher: Wiley
This document has been downloaded from MUEP (https://muep.mah.se) /
DIVA (https://mau.diva-portal.org).
Accepted
Article
This article has been accepted for publication and undergone full peer review but has not
DR. KRISTINA BERTL (Orcid ID : 0000-0002-8279-7943)
DR. ANDREAS STAVROPOULOS (Orcid ID : 0000-0001-8161-3754)
Article type : Original Research
Variation in bucco-palatal maxillary sinus width does not permit a meaningful sinus classification
Kristina Bertl1,2, René-Bernard Mick2, Patrick Heimel3,4,5, André Gahleitner6, Andreas Stavropoulos1, Christian Ulm2
1 Department of Periodontology, Faculty of Odontology, University of Malmö, Sweden 2 Division of Oral Surgery, School of Dentistry, Medical University of Vienna, Austria
3 Karl Donath Laboratory for Hard Tissue and Biomaterial Research, Division of Oral Surgery, Medical University of Vienna, Austria
4 Austrian Cluster for Tissue Regeneration, Vienna, Austria
5 Ludwig Boltzmann Institute for Clinical and Experimental Traumatology, Vienna, Austria 6 Department of Diagnostic Radiology, Division of Osteoradiology, General Hospital, Medical
University of Vienna, Austria
Running title: Variability in sinus width
Corresponding author: Andreas Stavropoulos, Department of Periodontology, Faculty of
Odontology, University of Malmö, Carl Gustafs väg 34, 20506 Malmö, Sweden; phone: +46 040 66 58066; email: andreas.stavropoulos@mah.se
Accepted
Article
Abstract Objectives
The bucco-palatal sinus width (SW) appears as relevant factor for graft consolidation after maxillary sinus (MS) floor augmentation. The present study aimed to assess a) SW at different height levels of posterior teeth, b) possible factors influencing SW, and c) whether a simple/meaningful sinus classification based on SW is possible.
Methods
The following parameters were recorded on computed tomographies of 76 edentulous and 86 partially edentulous maxillary quadrants displaying 383 tooth sites in total: i) alveolar ridge height, ii) -area, iii) -width 2mm apical to the alveolar crest, iv) -width at the sinus floor, and v) SW and sinus area at a level 2, 4, 6, 8, and 10mm above the sinus floor. The possible influence of gender, tooth position [i.e., premolar (PM); molar (M)], tooth-gap extent, and residual alveolar ridge dimensions on SW was assessed. Further, based on percentiles of average values or on the frequency distribution of SW <10, 10-15, or >15mm, it was attempted to classify the sinus at each given site into narrow, average, or wide.
Results
Gender and tooth-gap extent presented no relevant impact on MS dimensions; however, significant differences were observed among the various tooth positions regarding all evaluated parameters. The lower the residual alveolar ridge, the wider the MS at 4-10mm height, while the wider the residual alveolar ridge, the wider the MS. Large variation in SW classes among the different height levels within the same tooth position and among tooth positions within the same person was observed, irrespective of the threshold applied. Further, at a MS height of 10mm at PM1, PM2, M1, and M2, SW was <10mm in 68%, 33%, 0%, and 7% of the cases, respectively, while in 3%, 21%, 65%, and 57%, respectively, SW was >15mm.
Conclusions
There is a large variation in SW depending on the height level within the sinus and on tooth position, which does not permit a simple/meaningful classification of each sinus as “narrow”, “average”, or “wide”. Nevertheless, narrow sinuses (<10mm) are rather prevalent in the premolar region, while wide sinuses (>15mm) in the molar region; further, a wider and shorter residual alveolar ridge is associated with a wider SW.
Accepted
Article
Keywords
maxillary sinus; sinus grafting; sinus width; classification; computed tomography.
Introduction
Alveolar bone resorption and maxillary sinus (MS) pneumatisation after tooth loss results often in inadequate residual alveolar ridge height; in approximately 50% of the edentulous molar sites the residual alveolar ridge is < 5 mm high, and often only a paper-thin bone wall is left at buccal and occlusal aspects of the alveolar process (Nunes et al. 2013). The maxillary sinus floor augmentation (MSFA) technique (Boyne & James 1980; Tatum 1986) has thus been developed to generate bone in the deficient posterior maxilla and allows replacement of missing teeth with dental implants. MSFA is currently frequently applied – either in its original form of the lateral window approach or in several variations, like the transcrestal approach – and in general yields successful outcomes (Esposito et al. 2014).
Recent studies, employing cross-sectional imaging, have suggested to classify the MS on the basis of its width, for assisting in the selection of the surgical approach, grafting material and/or healing time during treatment planning (Chan et al. 2014; Teng et al. 2016). Both studies showed that the sinus width (SW) is in general larger at higher (apical) levels and at more posterior sites compared with lower (coronal) levels and anterior sites, respectively. For adults, average width (i.e., bucco-palatal dimension), height, and length (i.e., mesio-distal dimension) ranges of 25-35, 36-45, and 38-45 mm, respectively, have been reported, resulting in an approximate MS volume of 12-15 cm3 (van den Bergh et al. 2000). In this context, SW appears to influence bone regeneration and/or graft consolidation after MSFA; i.e., new bone formation and/or graft consolidation in central aspects of a “wide” MS seems to require longer time compared with a “narrow” MS, due to the longer distance angiogenic/osteogenic factors and cells need to cover to populate the graft. Indeed, several publications have shown reduced proportions of vital bone and/or increased loss of augmentation volume/height in patients with wide MS (Avila et al. 2010; Soardi et al. 2011; Spinato et al. 2015; Lombardi et al. 2017); for example, it has been reported that MS > 15 mm wide presented about 2-3 times less vital bone compared with MS < 10 mm wide, 6 months post-MSFA (i.e., 13% vs. 31%, respectively) (Avila et al. 2010).
Accepted
Article
Therefore, the aim of the present study was to assess a) SW in the premolar and molar region at different height levels, b) the possible influence of gender, tooth region, tooth-gap extent, and residual alveolar ridge dimensions on SW, and c) whether a simple/meaningful MS classification based on SW is possible.
Materials and Methods
Patient population and eligibility criteria
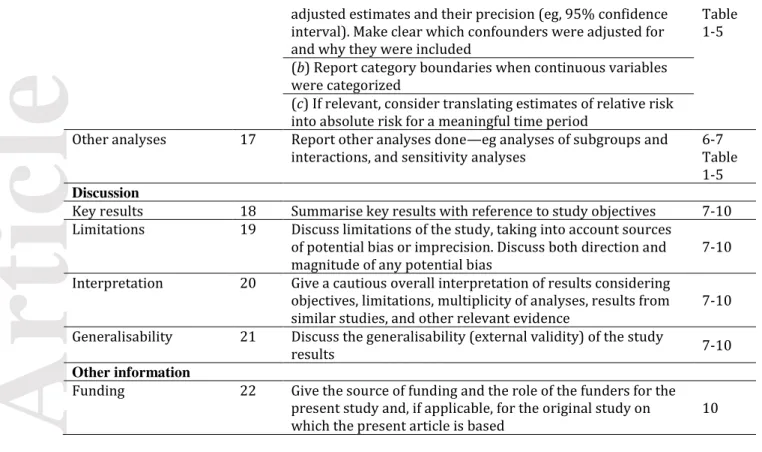
The study protocol of the present retrospective radiographic study was approved by the ethics committee of the Medical University of Vienna (EK-Nr. 1124/2015) and reporting complies with the STROBE guidelines (Appendix 1). Per protocol, all patients, who received a computed tomography (CT) of the maxilla between 01/2009 and 12/2014, were screened on the following eligibility criteria: (1) at least one posterior tooth missing [i.e., first or second premolar (PM1 or PM2) or molar (M1 or M2)], (2) ≥ 6 mm of the MS space above the floor of the sinus at the edentulous position is displayed in the CT (i.e., at least until the purple line indicated in Figure 1), (3) no extraction socket recognizable, (4) no MSFA, alveolar ridge preservation procedure, and/or dental implant installation after tooth extraction, (5) no oro-antral communication, (6) no cystic lesion, and (7) no artefacts impeding assessment of the residual alveolar ridge or the MS. If both sides of one patient fulfilled these criteria, one was chosen randomly by coin toss. The patients were divided into 2 groups of distinctly different tooth-gap extent: (a) edentulous, i.e., all premolars and molars missing (group E), and (b) 1 or 2 neighboring teeth missing (group D). Further, information on age, gender, and quadrant was collected.
Dental CT scans
Dental CT scans were recorded by a standard dental CT investigation protocol (Gahleitner et al. 2003) [Somatom Sensation 4 (Siemens, Forchheim, Germany) with 0.5 mm slice thickness, 1.0 mm table feed, 120 kV, 80 mA, 1 s scan time, 100 to 120 mm field of view, high-resolution bone filter]. Use of axial slices enabled orthoradial multiplanar reconstruction, which was calculated perpendicular to a manually-drawn line along the centerline of the jaw arch.
Residual alveolar ridge and MS dimensions
Orthoradial multiplanar reconstruction slices were used for all measurements. A single examiner (RBM) determined the center of each edentulous tooth position, considering a) the center of the distance between the neighboring teeth (in single tooth gap); b) the sizes of the contralateral teeth
Accepted
Article
(in 2-tooth gap); and c) the average mesio-distal tooth widths reported previously (in edentulous cases), i.e., 7 mm for PM1 and PM2, 10 mm for M1, and 9 mm for M2 (Piehslinger 2006) (Figure 1a). In an image-analysis software (Adobe Photoshop CS 5, Version 12.0.4, Adobe Systems Inc., San Jose, CA, USA) the outer contour of the alveolar ridge and the inner contour of the MS were manually traced on each orthoradial multiplanar reconstruction slice. Thereafter, an automated image analysis software (Definiens Developer XD 2.1, Definiens AG, Munich, Germany) was used to set 2 landmarks [AC – most coronal point of the alveolar ridge (i.e., the alveolar crest); BSF – base of the sinus floor] and for calculating the following parameters (Figure 1b):
Residual alveolar ridge height (ARH): the distance (in mm) between 2 horizontal lines set at AC and BSF
Residual alveolar ridge area (ARA): the area (in mm2
) of the residual alveolar ridge between 2 horizontal lines set at AC and BSF
Residual alveolar ridge width (in mm) at 2 mm apical to AC (ARW2) and at BSF (ARWS) Bucco-palatal SW (in mm) 2, 4, 6, 8, and 10 mm above BSF (SW2, SW4, etc.)
Sinus area (in mm2
) up to the height of a horizontal line 2, 4, 6, 8, and 10 mm above BSF (SA2, SA4, etc.)
All manual registrations were repeated in 25% of the entire sample (i.e., 40 patients) by the main (RBM) and a second (KB) examiner with a ≥ 2-week interval. These cases have been randomly chosen by generating a random list of 40 numbers between 1 and 162 corresponding to each patient entry.
MS classification
The 25th, 33rd, 67th, and 75th percentile of SW at the different tooth positions and height levels was calculated. Then, based on these values, the possibility of using (A) the < 33rd, 33 to 67th, > 67th percentile, and (B) the < 25th, 25 to 75th, > 75th percentile as cut-off values for categorizing each of the included MS sites into “narrow”, “average”, and “wide”, respectively, was evaluated. A given site was put into one of the 3 classes if > 50% of the measurements at the different height levels belonged to the same class (e.g., if at least 3 out of 5 height levels at the given site belonged to the “narrow” class, then this particular site was categorized as “narrow”; Figure 2c,d,h,m,n), or if no class was represented in > 50% of the measurements it was judged as “unclassified” (e.g., SW2 and SW4 at a given site belonged to the “narrow” class and SW6 and SW8 belonged to the “average” or “wide” class; Figure 2b).
Accepted
Article
Further, frequency distribution of a SW < 10, 10-15, or > 15 mm, at the different tooth positions and height levels was calculated. As above a given site was categorized as “narrow”, “average”, or “wide”, when > 50% of SW measurements at the different height levels in that site were either < 10, 10-15, or > 15 mm, respectively; if no class was represented in > 50% of the measurements this specific site was judged as “unclassified” (Figure 3).
Statistical Analysis
Normal distribution of all data was confirmed graphically by Q-Q-plots. Differences between a) group E and group D, and b) males and females, in regards with the various alveolar ridge and sinus parameters, were assessed separately for each individual tooth position (i.e., PM1, PM2, M1, and M2) by the independent t-test, while differences among tooth positions were assessed by generalized estimating equations to account for several tooth sites within a patient. Correlations between residual alveolar ridge dimensions and MS were analysed with the Pearson’s correlation coefficient and χ2-test was applied to compare the frequency distribution of a SW < 10, 10-15, or > 15 mm at the different tooth positions and height levels. Presentation of comparisons regarding the various MS parameters was restricted to the measurements at the height level of 2, 6, and 10 mm. Inter-examiner reproducibility and intra-examiner repeatability of the calculated parameters was tested with the intra-class correlation coefficient (ICC 1.1). Statistical analysis was performed using SPSS Version 24.0 (SPSS Inc., Chicago, IL, USA) and p-values < 0.05 were considered as statistically significant.
Results
Patient population
Out of 1000 maxillary CT scans performed between 01/2009 and 12/2014, 838 could not be used. Most common reasons for exclusion of a CT scan were the presence of a cyst, no posterior tooth missing, scan performed after MSFA, and non-healed extraction sockets. The scans of 162 patients, that fulfilled the eligibility criteria (86 females / 76 males; group D: n=86 / group E: n=76; 68 right MS / 94 left MS; mean age: 55 ± 11.4 years), contributed with 436 edentulous tooth sites. In 53 sites, however, MS height on the orthoradial multiplanar reconstruction slice was < 6 mm; hence, the final study sample comprised of 383 tooth sites (162 patients), including 58 PM1 (15.1%), 97 PM2 (25.3%), 129 M1 (33.7%), and 99 M2 (25.8%).
Accepted
Article
Residual alveolar ridge and MS dimensions
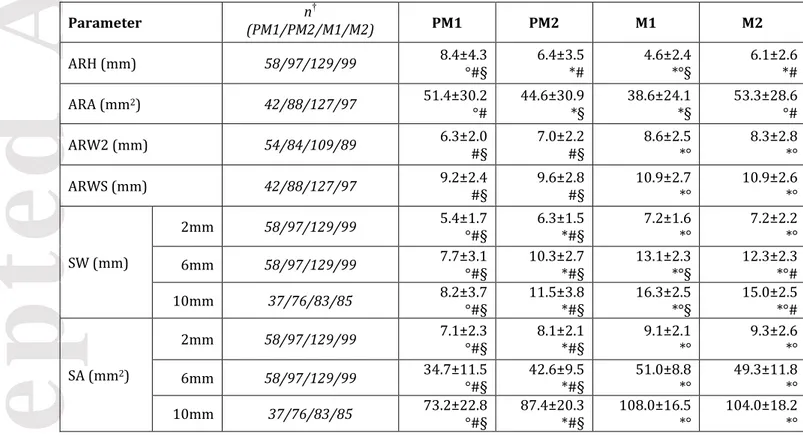
Gender (Appendix 2) and tooth-gap extent (i.e., group E vs. group D; Appendix 3) were not found to have any relevant impact on residual alveolar ridge dimensions (i.e., height, area, width) or on MS dimensions; only in a few instances, SW in the molar region in group D was statistically significant larger compared with group E, however the differences were mostly within 1 mm. On the other hand, significant differences were observed among the various tooth positions regarding all evaluated parameters. In general, ARH and ARA was smallest at M1, while ARW2, ARWS, SW, and SA were significantly larger in the molar region compared to the premolar region (Table 1, Appendix 4). Further, ARH had a significantly negative correlation with SW4-10 and SA6-10 (i.e., the lower the residual alveolar ridge, the wider the MS), and ARW2 and ARWS significantly correlated positively with SW and SA at all height levels (i.e., the wider the residual alveolar ridge, the wider the MS; Table 2).
MS classification
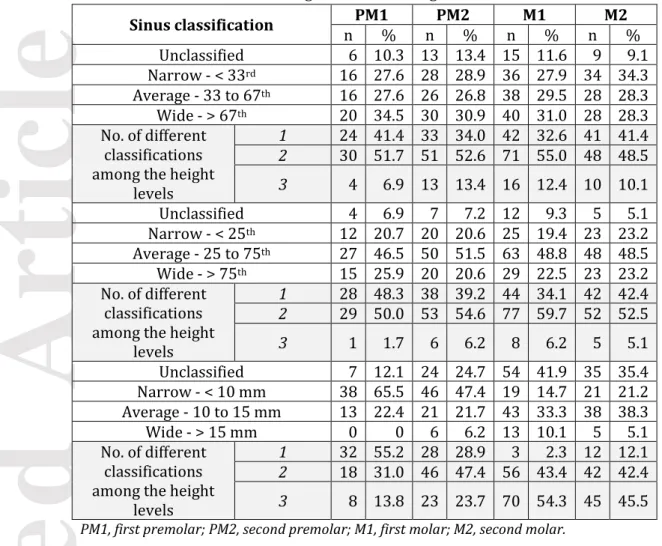
The values corresponding to (A) < 33rd, 33 to 67th, > 67th percentile, and (B) < 25th, 25 to 75th, > 75th percentile of SW values at the different tooth positions and height levels are presented in Table 3. A large variation in SW classes among the different height levels within the same tooth position was observed irrespective of the threshold applied; i.e., in > 50% of the cases, more than one MS class (i.e., “narrow”, “average”, or “wide”) was observed in a given tooth position (Figure 2, Table 4). Additionally, large variation in SW classes among tooth positions within the same person was observed; i.e., regarding patients of group E with at least 3 included tooth sites (n=67) at least 2 different classes were present in ca. 60% of the cases. Specifically, with threshold A, 25.4%, 58.2%, and 16.4% of the patients presented 1, 2, and 3 different classes, respectively, and with threshold B, 26.9%, 59.7%, and 13.4% of the patients presented with 1, 2, and 3 different classes, respectively.
Prevalence of a MS with a SW < 10 mm was very high (≥ 94%) at SW2 level in all tooth positions and was in general reduced at higher levels in all tooth positions; however, prevalence of SW < 10 mm remained rather high at PM1 and PM2 (i.e., in 68% and 33% of the cases at SW10, respectively), compared with M1 and M2, where it was only a scarce finding (i.e., 0% and 7% of the cases at SW10, respectively). In contrast, MS with SW > 15 mm were only seldom present at PM1 and PM2 (i.e., 3% and 21%, respectively) at SW10, but comprised the majority of MS at M1 and M2 (i.e., 65% and 57%, respectively) (Table 5). In general, large variation in SW classes among the different height levels within the same tooth position was observed; only in PM1 a single class (< 10 mm) was represented in a slight majority of the cases (55.2%), while 71.1%, 97.7%, and 87.9% of cases at PM2, M1, and
Accepted
Article
M2, respectively, presented 2 or 3 different classes among the different height levels (Figure 3, Table 4). Further, as above, a large variation in SW classes among tooth positions within the same person was observed; specifically, 34.3%, 61.2%, and 4.5% of the patients presented 1, 2, and 3 different classes, respectively, at the various tooth positions.
Reliability
Evaluation of reliability of manual registrations presented a high degree of intra-examiner repeatability (ICC > 0.98) and inter-examiner reproducibility (ICC > 0.96). In particular, mean difference in height and width measurements was 0.05 and 0.07 mm, respectively, regarding intra-examiner repeatability and 0.12 and 0.15 mm, respectively, regarding inter-intra-examiner reproducibility.
Discussion
Recently, MS morphology and specifically the bucco-palatal bone wall distance, i.e., the SW, has been discussed as influencing the outcome of MSFA. Particularly, a large bucco-palatal bone wall distance, i.e., a wide MS, appears to delay graft consolidation and/or compromises stability of augmentation volume, including new bone formation (Avila et al. 2010; Soardi et al. 2011; Spinato et al. 2015; Lombardi et al. 2017; Stacchi et al. 2018). Recent studies have attempted to classify the MS to assist in the selection of the surgical approach, grafting material, and/or healing time during treatment planning (Chan et al. 2014; Teng et al. 2016). Thus, one of the aims in the present study was to assess whether a simple/meaningful MS classification based on SW is possible, while taking into account possible inter- and intra-subject variations of the MS morphology/dimension. Indeed, the results herein revealed a large variation in SW, depending on the height level within the MS and on the tooth position. Specifically, the SW increased from coronal to apical and from anterior (i.e., premolar sites) to posterior sites (i.e., molar sites). Further, at the 2 mm-height level the difference in SW between premolar and molar positions was relatively small (i.e., about 1 to 2 mm), but this difference increased with increasing MS height; i.e., at a height level of 6 and 10 mm, SW at M1 was approximately twice as wide compared to PM1. Thus, the previous suggestions for a classification of the MS on the patient level, i.e., based on pooled average SW values of premolars and molars (Chan et al. 2014; Teng et al. 2016), appear somewhat simplistic and hardly meaningful.
Consequently, an attempt was made herein to classify MS as “narrow”, “average”, and “wide”, for each height level and for each tooth position separately, and then classify the MS at each tooth position, depending on the majority of “classes” represented in this particular site at the various height levels. The initial attempt was to classify the MS with a similar approach as the
above-Accepted
Article
mentioned recent studies (Chan et al. 2014; Teng et al. 2016). Two sets of threshold values (i.e., A: < 33rd, 33 to 67th, > 67th percentile; and B: < 25th, 25 to 75th, > 75th percentile of the average SW values for the specific height level and tooth position) were tested. In general, depending on whether threshold A or B was used, the majority of the MS in the various tooth positions would be classified as wide or average, respectively; nevertheless, the results presented large variation irrespective of the threshold set applied. Specifically, in > 50% of the cases, the MS classification as “narrow”, “average”, or “wide” varied/changed at least once among SW height levels within the same site and among tooth positions within the same person. Additionally, about 5-15% of the sites remained “unclassified”, as no “class” was present in > 50% of the evaluated height levels. Neither gender nor tooth-gap extent showed any clinically relevant association with MS dimensions herein, as previously reported (Uchida et al. 1998; Wagner et al. 2017). In perspective, it has to be pointed out that by using such threshold values based on percentiles of averages, a certain SW distance in mm, which is classified as wide at a certain height level in a certain tooth position, may be classified as narrow at a higher level in the same position or at the same level in a more posterior tooth position.
In this context, a previous histological study on bone-core biopsies from patients (Avila et al. 2010) identified a significantly larger proportion of vital bone 6 months after MSFA with a lateral window approach in biopsies from MS with bucco-palatal distance (i.e., SW) of < 10 mm compared with biopsies from MS with bucco-palatal distance > 15 mm (31% vs. 13%, respectively). Similar histological results have been very recently presented after MSFA with a transcrestal approach (Stacchi et al. 2018). Therefore, it was considered more relevant to also attempt to classify the MS using fixed values and to assess the prevalence of SW < 10 and > 15 mm in the present relatively large sample (162 patients/383 sites). About 2/3 and 1/2 of the PM1 and PM2 positions were classified as “narrow”, while “wide” sites appeared quite seldom (ca. 0-10%, irrespective of the tooth position). However, this classification based on fixed values confirmed the high variability of the MS morphology and dimension. Specifically, only in PM1 was only one class represented in a slight majority of the cases (55%), while in > 71% of the cases in PM2, M1, and M2, 2 or 3 different classifications were observed among the different height levels; in general, the higher the level in the MS, the higher the variation in among tooth positions. For example, a MS with a width < 10 mm was very frequent (≥ 94%) at SW2 level in all tooth positions; in contrast, while the prevalence of SW < 10 mm remained relatively high up to 10 mm above the sinus floor at PM1 and PM2 (i.e., in 68% and 33%, respectively), it was a scarce finding at M1 and M2 (i.e., 0% and 7% respectively). Similarly, MS with SW > 15 mm were only seldom present at PM1 and PM2 (i.e., 3% and 21%, respectively), but comprised the majority of MS at M1 and M2 (i.e., 65% and 57%, respectively) at SW10.
Accepted
Article
Thus, from a clinical perspective, healing (i.e., bone regeneration) in the majority of premolars sites would be expected to occur faster compared with molar sites, at an extent/height relevant for implant placement (i.e., in the first 8-10 mm within the MS). As mentioned earlier graft consolidation after MSFA requires angiogenic/osteogenic factors and cells sprouting into the augmentation material from the surrounding recipient bone, i.e., bony walls of the MS and the residual alveolar ridge, and less from the Schneiderian membrane (Scala et al. 2012; Jungner et al. 2015; Rong et al. 2015; Reich et al. 2016). Hence, a larger distance between the buccal and palatal MS wall (i.e., a wide MS) might delay graft consolidation due to the longer distance angiogenic/osteogenic factors and cells need to cover to populate the graft. Additionally, one has to keep in mind that wide MS might impede/prevent to lift the Schneiderian membrane until the palatal wall, which in turn would reduce the number of bony walls contributing with osteogenic resources during healing (Jang et al. 2010). Indeed, reduced formation of new bone has been shown for cases with non-exposure of the palatal wall (i.e., non-lifting of the Schneiderian membrane until the palatal wall) (Lombardi et al. 2017) and for the region of the lateral window (Artzi et al. 2005). In perspective, SW should also be considered during treatment planning and/or decision making together with the various systemic and local parameters known to influence the outcome of MSFA and especially the timeframe of bone regeneration and/or graft consolidation, e.g., presence of systemic diseases, smoking status, gender, age, augmentation material (i.e., no material vs. autogenous bone vs. bone substitutes vs. combinations thereof), use of growth factors, manipulation of the surgical site (e.g., perforation of the sinus floor for improved blood supply), use of a membrane to seal the lateral window, etc. (Rios et al. 2009; Esposito et al. 2014; Shanbhag et al. 2014; Reich et al. 2016; Ulm et al. 2017). For example, longer healing time as well as the use of autologous bone and/or a growth factor might be preferably considered in a wide MS, while in a narrow sinus a shorter healing time and/or use of bone substitutes may be considered. In the clinic, and in the absence of 3-dimensional MS imaging, the ARW and ARH can be used as surrogate features for the SW; specifically, a wider and shorter residual alveolar ridge is associated with a wider SW. In this context, it has to be mentioned that the reason for reduced alveolar bone height and need for MSFA, i.e. due to sinus expansion or alveolar bone height loss, or combination thereof, dictates treatment. For example, MSFA may need to be combined with vertical bone augmentation to avoid a too apical implant positioning, which may compromise the prosthetic outcome.
In conclusion, there is a large variation in SW depending on the height level within the MS and on tooth position, and this does not permit a simple meaningful classification of each MS as “narrow”, “average”, or “wide”, irrespective of whether average or fixed values are used. Nevertheless, narrow
Accepted
Article
MS (i.e., < 10 mm wide) are rather prevalent in the premolar region, while wide MS (i.e., > 15 mm wide) are rather prevalent in the molar region; further, a wider and shorter residual alveolar ridge is associated with a wider SW. This information could be considered during the choice of augmentation material and/or healing time during MSFA in the various regions; it appears reasonable to suggest that shorter healing time and/or use of bone substitutes may be considered in premolar sites, while longer healing time and/or use of autogenous bone in combination with bone substitutes appear preferable in molar sites.
Acknowledgements
The authors thank Helge Schöchtner for his support in sampling the CT scans. Further, the authors declare no conflict of interest, and no external funding was obtained to perform the present study.
References
Artzi, Z., Kozlovsky, A., Nemcovsky, C. E., & Weinreb, M. (2005). The amount of newly formed bone in sinus grafting procedures depends on tissue depth as well as the type and residual amount of the grafted material. Journal of Clinical Periodontology, 32, 193-199. doi:10.1111/j.1600-051X.2005.00656.x
Avila, G., Wang, H. L., Galindo-Moreno, P. et al. (2010). The influence of the bucco-palatal distance on sinus augmentation outcomes. Journal of Periodontology, 81, 1041-1050. doi:10.1902/jop.2010.090686
Boyne, P. J., & James, R. A. (1980). Grafting of the maxillary sinus floor with autogenous marrow and bone. Journal of Oral Surgery, 38, 613-616.
Chan, H. L., Suarez, F., Monje, A., Benavides, E., & Wang, H. L. (2014). Evaluation of maxillary sinus width on cone-beam computed tomography for sinus augmentation and new sinus classification based on sinus width. Clinical Oral Implants Research, 25, 647-652. doi:10.1111/clr.12055
Esposito, M., Felice, P., & Worthington, H. V. (2014). Interventions for replacing missing teeth: augmentation procedures of the maxillary sinus. Cochrane Database Systematic Reviews, CD008397. doi:10.1002/14651858.CD008397.pub2
Gahleitner, A., Watzek, G., & Imhof, H. (2003). Dental CT: imaging technique, anatomy, and pathologic conditions of the jaws. European Radiology, 13, 366-376. doi:10.1007/s00330-002-1373-7
Accepted
Article
Jang, H. Y., Kim, H. C., Lee, S. C., & Lee, J. Y. (2010). Choice of graft material in relation to maxillary sinus width in internal sinus floor augmentation. Journal of Oral & Maxillofacial Surgery, 68, 1859-1868. doi:10.1016/j.joms.2009.09.093
Jungner, M., Cricchio, G., Salata, L. A., Sennerby, L., Lundqvist, C., Hultcrantz, M., & Lundgren, S. (2015). On the Early Mechanisms of Bone Formation after Maxillary Sinus Membrane Elevation: An Experimental Histological and Immunohistochemical Study. Clinical Implant Dentistry and Related Research, 17, 1092-1102. doi:10.1111/cid.12218
Lombardi, T., Stacchi, C., Berton, F., Traini, T., Torelli, L., & Di Lenarda, R. (2017). Influence of Maxillary Sinus Width on New Bone Formation After Transcrestal Sinus Floor Elevation: A Proof-of-Concept Prospective Cohort Study. Implant Dentistry, 26, 209-216. doi:10.1097/ID.0000000000000554
Nunes, L. S., Bornstein, M. M., Sendi, P., & Buser, D. (2013). Anatomical characteristics and dimensions of edentulous sites in the posterior maxillae of patients referred for implant therapy. International Journal of Periodontics and Restorative Dentistry, 33, 337-345. doi:10.11607/prd.1475. Piehslinger, E. (2006). Grundlagen der zahnärztlichen Prothetik: Ein Leitfaden für Studierende und Zahnärzte (2nd ed.). Vienna: Universimed.
Reich, K. M., Huber, C. D., Heimel, P., Ulm, C., Redl, H., & Tangl, S. (2016). A quantification of regenerated bone tissue in human sinus biopsies: influences of anatomical region, age and sex. Clinical Oral Implants Research, 27, 583-590. doi:10.1111/clr.12627
Rios, H. F., Avila, G., Galindo, P., Bratu, E., & Wang, H. L. (2009). The influence of remaining alveolar bone upon lateral window sinus augmentation implant survival. Implant Dentistry, 18, 402-412. doi:10.1097/ID.0b013e3181b4af93
Rong, Q., Li, X., Chen, S. L., Zhu, S. X., & Huang, D. Y. (2015). Effect of the Schneiderian membrane on the formation of bone after lifting the floor of the maxillary sinus: an experimental study in dogs. The British Journal of Oral & Maxillofacial Surgery, 53, 607-612. doi:10.1016/j.bjoms.2015.02.010 Scala, A., Botticelli, D., Faeda, R. S., Garcia Rangel, I., Américo de Oliveira, J., & Lang, N. P. (2012). Lack of influence of the Schneiderian membrane in forming new bone apical to implants simultaneously installed with sinus floor elevation: an experimental study in monkeys. Clinical Oral Implants Research, 23, 175-181. doi:10.1111/j.1600-0501.2011.02227.x
Shanbhag, S., Shanbhag, V., & Stavropoulos, A. (2014). Volume changes of maxillary sinus augmentations over time: a systematic review. International Journal of Oral & Maxillofacial Implants, 29, 881-892. doi:10.11607/jomi.3472.
Accepted
Article
Soardi, C. M., Spinato, S., Zaffe, D., & Wang, H. L. (2011). Atrophic maxillary floor augmentation by mineralized human bone allograft in sinuses of different size: an histologic and histomorphometric analysis. Clinical Oral Implants Research, 22, 560-566. doi:10.1111/j.1600-0501.2010.02034.x
Spinato, S., Bernardello, F., Galindo-Moreno, P., & Zaffe, D. (2015). Maxillary sinus augmentation by crestal access: a retrospective study on cavity size and outcome correlation. Clinical Oral Implants Research, 26, 1375-1382. doi:10.1111/clr.12477
Stacchi, C., Lombardi, T., Ottonelli, R., Berton, F., Perinetti, G., & Traini, T. (2018) New bone formation after transcrestal sinus floor elevation was influenced by sinus cavity dimensions: A prospective histologic and histomorphometric study. Clinical Oral Implants Research, 29, 465-479. doi: 10.1111/clr.13144
Tatum, O. H. (1986). Maxillary and sinus implant reconstruction. Dental Clinics of North America, 30, 207-229.
Teng, M., Cheng, Q., Liao, J., Zhang, X., Mo, A., & Liang, X. (2016). Sinus Width Analysis and New Classification with Clinical Implications for Augmentation. Clinical Implant Dentistry and Related Research, 18, 89-96. doi:10.1111/cid.12247
Uchida, Y., Goto, M., Katsuki, T., & Akiyoshi, T. (1998). A cadaveric study of maxillary sinus size as an aid in bone grafting of the maxillary sinus floor. Journal of Oral & Maxillofacial Surgery, 56, 1158-1163.
Ulm, C., Bertl, K., Strbac, G. D., Esfandeyari, A., Stavropoulos, A., & Zechner, W. (2017). Multiple Perforations of the Sinus Floor During Maxillary Sinus Floor Augmentation to Provide Access to the Bone Marrow Space: A Technical Report. Implant Dentistry, 26, 956-960. doi:10.1097/ID.0000000000000682
van den Bergh, J. P., ten Bruggenkate, C. M., Disch, F. J., & Tuinzing, D. B. (2000). Anatomical aspects of sinus floor elevations. Clinical Oral Implants Research, 11, 256-265.
Wagner, F., Dvorak, G., Nemec, S., Pietschmann, P., Traxler, H., Schicho, K., & Seemann, R. (2017). Morphometric analysis of sinus depth in the posterior maxilla and proposal of a novel classification. Scientific Reports, 7, 45397. doi:10.1038/srep45397
Accepted
Article
Figure legends
Figure 1. A central orthoradial multiplanar reconstruction slice from each edentulous tooth site was
chosen (a) to record the following parameters (b): i) alveolar ridge height (ARH), ii) alveolar ridge area (ARA), iii) alveolar ridge width 2 mm apical to the alveolar crest (ARW2) and at the base of the sinus floor (ARWS), and at a level 2, 4, 6, 8 and 10 mm above the sinus floor iv) bucco-palatal sinus width (SW) and vi) sinus area (SA). All included sinuses displayed at least 6 mm of MS space above the floor of the sinus (i.e., at least until the purple line). AC, most coronal point of the alveolar crest; BSF, base of sinus floor; PM1, first premolar; PM2, second premolar; M1, first molar; M2, second molar.
Figure 2. Four patient cases demonstrating the high variability of SW among different height levels
as well as among the different tooth positions within the same person. Based on the < 25th, 25 to 75th, > 75th percentile of the sinus width at the various tooth positions and height levels, each height level as well as the given tooth site in total was categorized as “narrow” (pink), “average” (green), “wide” (light blue), or “unclassified” (white). PM1, first premolar; PM2, second premolar; M1, first molar; M2, second molar.
Figure 3. Four patient cases demonstrating the high variability of SW among different height levels
as well as among the different tooth positions within the same person. The following threshold values, (1) < 10 mm, (2) 10-15 mm, or (3) > 15 mm have been applied to categorize each height level as well as the given tooth site as “narrow” (pink), “average” (green), “wide” (light blue), or “unclassified” (white). PM1, first premolar; PM2, second premolar; M1, first molar; M2, second molar.
Table legends
Table 1. Comparison of the residual alveolar ridge and maxillary sinus dimensions at different tooth
positions.
Table 2. Correlation between residual alveolar ridge dimension (i.e., height and width) and maxillary
sinus dimensions (Pearson’s correlation coefficient).
Table 3. Values representing the (A) < 33rd, 33 to 67th, > 67th percentile, and (B) < 25th, 25 to 75th, > 75th percentile of SW at a height level of 2, 6 and 10 mm within the sinus.
Table 4. Frequency distribution of the sinus classification per tooth position and of the number of
different classifications among the different height levels.
Table 5. Frequency distribution of a maxillary sinus width < 10, 10-15, or > 15 mm at the different
Accepted
Article
Appendix
Appendix 1. STROBE Statement — cross-sectional studies.
Appendix 2. Comparison of the residual alveolar ridge and maxillary sinus dimensions depending on
gender.
Appendix 3. Comparison of the residual alveolar ridge and maxillary sinus dimensions depending on
the tooth-gap extent (i.e., group D vs. group E).
Appendix 4. Comparison of the residual alveolar ridge and maxillary sinus dimensions at different
tooth positions (generalized estimating equations).
Table 1. Comparison of the residual alveolar ridge and maxillary sinus dimensions at different tooth positions. Parameter n † (PM1/PM2/M1/M2) PM1 PM2 M1 M2 ARH (mm) 58/97/129/99 8.4±4.3 °#§ 6.4±3.5 *# 4.6±2.4 *°§ 6.1±2.6 *# ARA (mm2) 42/88/127/97 51.4±30.2 °# 44.6±30.9 *§ 38.6±24.1 *§ 53.3±28.6 °# ARW2 (mm) 54/84/109/89 6.3±2.0 #§ 7.0±2.2 #§ 8.6±2.5 *° 8.3±2.8 *° ARWS (mm) 42/88/127/97 9.2±2.4 #§ 9.6±2.8 #§ 10.9±2.7 *° 10.9±2.6 *° SW (mm) 2mm 58/97/129/99 5.4±1.7 °#§ 6.3±1.5 *#§ 7.2±1.6 *° 7.2±2.2 *° 6mm 58/97/129/99 7.7±3.1 °#§ 10.3±2.7 *#§ 13.1±2.3 *°§ 12.3±2.3 *°# 10mm 37/76/83/85 8.2±3.7 °#§ 11.5±3.8 *#§ 16.3±2.5 *°§ 15.0±2.5 *°# SA (mm2) 2mm 58/97/129/99 7.1±2.3 °#§ 8.1±2.1 *#§ 9.1±2.1 *° 9.3±2.6 *° 6mm 58/97/129/99 34.7±11.5 °#§ 42.6±9.5 *#§ 51.0±8.8 *° 49.3±11.8 *° 10mm 37/76/83/85 73.2±22.8 °#§ 87.4±20.3 *#§ 108.0±16.5 *° 104.0±18.2 *°
* significantly different from PM1 (p<0.05); ° significantly different from PM2 (p<0.05); # significantly different from M1 (p<0.05); § significantly different from M2 (p<0.05) based on the results of generalized estimating equations; data are presented as mean ± standard deviation.
†: Differences in the numbers of sites are due to occasions where, a) either the sinus floor was in a more
cranial position than the hard palate and thus ARA and ARWS could not be determined, b) the alveolar ridge was less than 2 mm high and thus ARW2 could not be determined, or c) the MS space was not displayed for 10 mm above the sinus floor in the CT and thus SW and SA at 10 mm could not be determined.
MS, maxillary sinus; ARA, alveolar ridge area; ARH, alveolar ridge height; ARW2, alveolar ridge width at 2 mm apical to the alveolar crest; ARWS, alveolar ridge width at the base of the sinus floor; PM1, first premolar; PM2, second premolar; M1, first molar; M2, second molar; SA, sinus area; SW, sinus width.
Accepted
Article
Table 2. Correlation between residual alveolar ridge dimension (i.e., height and width) and
maxillary sinus dimensions (Pearson’s correlation coefficient).
SW SA 2 mm 6 mm 10 mm 2 mm 6 mm 10 mm ARH r -0.078 -0.299 -0.391 -0.041 -0.169 -0.252 p-value 0.127 <0.001 <0.001 0.428 0.001 <0.001 ARW2 r 0.311 0.399 0.365 0.291 0.389 0.347 p-value <0.001 <0.001 <0.001 <0.001 <0.001 <0.001 ARWS r 0.516 0.447 0.298 0.472 0.552 0.443 p-value <0.001 <0.001 <0.001 <0.001 <0.001 <0.001
ARH, alveolar ridge height; ARW2, alveolar ridge width at 2 mm apical to the alveolar crest; ARWS, alveolar ridge width at the base of sinus floor; SA, sinus area; SW, sinus width.
Accepted
Article
This article is protected by copyright. All rights reserved.
Table 3. Values representing the (A) < 33rd, 33 to 67th, > 67th percentile, and (B) < 25th, 25 to 75th, > 75th percentile of SW at a height level of 2, 6 and 10 mm within the sinus.
Height level Sinus classification (A) < 33rd, 33 to 67th, > 67th (B) < 25th, 25 to 75th, > 75th PM1 PM2 M1 M2 PM1 PM2 M1 M2 2mm narrow <4.82 <5.51 <6.48 <6.44 <4.62 <5.24 <6.02 <5.98 average 4.82-6.09 5.51-6.65 6.48-7.78 6.44-7.60 4.62-6.52 5.24-7.03 6.02-8.06 5.98-8.21 wide >6.09 >6.65 >7.78 >7.60 >6.52 >7.03 >8.06 >8.21 6mm narrow <6.04 <9.34 <11.98 <11.35 <5.52 <8.67 <11.27 <10.78 average 6.04-8.86 9.34-11.26 11.98-14.24 11.35-13.10 5.52-9.75 8.67-12.14 11.27-14.62 10.78-13.76 wide >8.86 >11.26 >14.24 >13.10 >9.75 >12.14 >14.62 >13.76 10mm narrow <5.91 <9.99 <14.86 <14.27 <4.98 <8.67 <14.36 <13.84 average 5.91-9.97 9.99-13.04 14.86-17.58 14.27-16.34 4.98-11.35 8.67-14.27 14.36-18.15 13.84-16.70 wide >9.97 >13.04 >17.58 >16.34 >11.35 >14.27 >18.15 >16.70
Accepted
Article
Table 4. Frequency distribution of the sinus classification per tooth position and of the number
of different classifications among the different height levels.
Sinus classification PM1 PM2 M1 M2 n % n % n % n % Unclassified 6 10.3 13 13.4 15 11.6 9 9.1 Narrow - < 33rd 16 27.6 28 28.9 36 27.9 34 34.3 Average - 33 to 67th 16 27.6 26 26.8 38 29.5 28 28.3 Wide - > 67th 20 34.5 30 30.9 40 31.0 28 28.3 No. of different classifications among the height
levels 1 24 41.4 33 34.0 42 32.6 41 41.4 2 30 51.7 51 52.6 71 55.0 48 48.5 3 4 6.9 13 13.4 16 12.4 10 10.1 Unclassified 4 6.9 7 7.2 12 9.3 5 5.1 Narrow - < 25th 12 20.7 20 20.6 25 19.4 23 23.2 Average - 25 to 75th 27 46.5 50 51.5 63 48.8 48 48.5 Wide - > 75th 15 25.9 20 20.6 29 22.5 23 23.2 No. of different classifications among the height
levels 1 28 48.3 38 39.2 44 34.1 42 42.4 2 29 50.0 53 54.6 77 59.7 52 52.5 3 1 1.7 6 6.2 8 6.2 5 5.1 Unclassified 7 12.1 24 24.7 54 41.9 35 35.4 Narrow - < 10 mm 38 65.5 46 47.4 19 14.7 21 21.2 Average - 10 to 15 mm 13 22.4 21 21.7 43 33.3 38 38.3 Wide - > 15 mm 0 0 6 6.2 13 10.1 5 5.1 No. of different classifications among the height
levels
1 32 55.2 28 28.9 3 2.3 12 12.1
2 18 31.0 46 47.4 56 43.4 42 42.4
3 8 13.8 23 23.7 70 54.3 45 45.5
PM1, first premolar; PM2, second premolar; M1, first molar; M2, second molar.
Table 5. Frequency distribution of a maxillary sinus width < 10, 10 to 15, or > 15 mm at the different tooth positions and height levels.
Height Sinus width PM1 PM2 M1 M2 p-value (χ2-test) n % n % n % n % 2 mm < 10 mm 58 100 95 97.9 122 94.6 93 93.9 0.277 10 – 15 mm 0 0 2 2.1 7 5.4 5 5.1 > 15 mm 0 0 0 0 0 0 1 1.0 6 mm < 10 mm 45 77.6 42 43.3 11 8.5 15 15.2 < 0.001 10 – 15 mm 13 22.4 51 52.6 90 69.8 74 74.7 > 15 mm 0 0 4 4.1 28 21.7 10 10.1 10 mm < 10 mm 25 67.6 25 32.9 0 0 6 7.1 < 0.001 10 – 15 mm 11 29.7 35 45.9 29 34.9 31 36.4 > 15 mm 1 2.7 16 21.1 54 65.1 48 56.5
Accepted
Accepted
Accepted
Article
Appendix 1. STROBE Statement — cross-sectional studies.
Item
No Recommendation Page
Title and abstract 1 (a) Indicate the study’s design with a commonly used term in
the title or the abstract 1
(b) Provide in the abstract an informative and balanced
summary of what was done and what was found 2 Introduction
Background/rationale 2 Explain the scientific background and rationale for the
investigation being reported 3
Objectives 3 State specific objectives, including any prespecified
hypotheses 3
Methods
Study design 4 Present key elements of study design early in the paper 4-5 Figure 1 Setting 5 Describe the setting, locations, and relevant dates, including
periods of recruitment, exposure, follow-up, and data collection
4-5 Participants 6 (a) Give the eligibility criteria, and the sources and methods
of selection of participants 4-5
Variables 7 Clearly define all outcomes, exposures, predictors, potential confounders, and effect modifiers. Give diagnostic criteria, if applicable
4-5 Data sources/
measurement
8* For each variable of interest, give sources of data and details
of methods of assessment (measurement). Describe comparability of assessment methods if there is more than one group
4-5
Bias 9 Describe any efforts to address potential sources of bias - Study size 10 Explain how the study size was arrived at - Quantitative variables 11 Explain how quantitative variables were handled in the
analyses. If applicable, describe which groupings were chosen and why
5-6 Statistical methods 12 (a) Describe all statistical methods, including those used to
control for confounding
5-6 (b) Describe any methods used to examine subgroups and
interactions
(c) Explain how missing data were addressed
(d) If applicable, describe analytical methods taking account of sampling strategy
(e) Describe any sensitivity analyses Results
Participants 13* (a) Report numbers of individuals at each stage of study—eg numbers potentially eligible, examined for eligibility,
confirmed eligible, included in the study, completing
follow-up, and analysed 6
(b) Give reasons for non-participation at each stage (c) Consider use of a flow diagram
Descriptive data 14* (a) Give characteristics of study participants (eg
demographic, clinical, social) and information on exposures
and potential confounders 6
(b) Indicate number of participants with missing data for each variable of interest
Accepted
Article
adjusted estimates and their precision (eg, 95% confidence interval). Make clear which confounders were adjusted for and why they were included
Table 1-5 (b) Report category boundaries when continuous variables
were categorized
(c) If relevant, consider translating estimates of relative risk into absolute risk for a meaningful time period
Other analyses 17 Report other analyses done—eg analyses of subgroups and interactions, and sensitivity analyses
6-7 Table 1-5 Discussion
Key results 18 Summarise key results with reference to study objectives 7-10 Limitations 19 Discuss limitations of the study, taking into account sources
of potential bias or imprecision. Discuss both direction and magnitude of any potential bias
7-10 Interpretation 20 Give a cautious overall interpretation of results considering
objectives, limitations, multiplicity of analyses, results from similar studies, and other relevant evidence
7-10 Generalisability 21 Discuss the generalisability (external validity) of the study
results 7-10
Other information
Funding 22 Give the source of funding and the role of the funders for the present study and, if applicable, for the original study on which the present article is based
10
*Give information separately for exposed and unexposed groups.
Note: An Explanation and Elaboration article discusses each checklist item and gives methodological
background and published examples of transparent reporting. The STROBE checklist is best used in conjunction with this article (freely available on the Web sites of PLoS Medicine at http://www.plosmedicine.org/, Annals of Internal Medicine at http://www.annals.org/, and Epidemiology at http://www.epidem.com/). Information on the STROBE Initiative is available at www.strobe-statement.org.
Accepted
Article
Appendix 2. Comparison of the residual alveolar ridge and maxillary sinus dimensions depending on gender.
PM1 PM2 M1 M2
n mean±SD n mean±SD n mean±SD n mean±SD
ARH (mm) male 31 8.0±4.9 48 6.7±4.1 61 4.5±2.0 51 6.0±2.7 female 27 8.8±3.4 49 6.0±2.8 68 4.7±2.8 48 6.2±2.5 p-value (95% CI) 0.501 (-3.0;1.5) 0.369 (-0.8;2.0) 0.574 (-1.1;0.6) 0.642 (-1.3;0.8) ARA (mm2) male 23 46.8±31.7 43 49.1±35.8 60 41.0±25.0 50 54.8±31.2 female 19 57.0±28.2 45 40.3±25.0 67 36.5±23.2 47 51.8±25.8 p-value (95% CI) 0.285 (-29.0;8.8) 0.189 (-4.4;21.9) 0.291 (-3.9;13.0) 0.606 (-8.6;14.6) ARW2 (mm) male 27 6.7±2.1 40 7.4±2.1 53 9.4±2.5 46 8.6±2.9 female 27 5.9±1.9 44 6.6±2.2 56 7.9±2.3 43 7.9±2.7 p-value (95% CI) 0.130 (-0.3;1.9) 0.080 (-0.1;1.8) 0.001 (0.6;2.4) 0.252 (-0.5;1.9) ARWS (mm) male 23 9.3±2.5 43 10.1±2.1 60 11.5±2.4 50 11.2±2.6 female 19 9.1±2.3 45 9.2±3.3 67 10.3±2.8 47 10.8±2.6 p-value (95% CI) 0.811 (-1.3;1.7) 0.110 (-0.2;2.1) 0.011 (0.3;2.1) 0.387 (-0.6;1.5) SW (mm) 2mm male 31 5.6±1.2 48 6.4±1.4 61 7.3±1.6 51 6.8±2.0 female 27 5.1±2.1 49 6.1±1.6 68 7.1±1.6 48 7.5±2.3 p-value (95% CI) 0.265 (-0.4;1.5) 0.412 (-0.4;0.9) 0.327 (-0.3;0.8) 0.115 (-1.5;0.2) 6mm male 31 8.4±2.8 48 10.5±2.7 61 13.1±2.3 51 11.9±2.1 female 27 6.8±3.4 49 10.0±2.8 68 13.1±2.3 48 12.7±2.5 p-value (95% CI) 0.057 (-0.1;3.2) 0.328 (-0.6;1.6) 0.924 (-0.8;0.8) 0.086 (-1.7;0.1) 10mm male 21 8.9±3.8 39 11.8±3.4 50 16.3±2.6 49 14.5±2.5 female 16 7.3±3.4 37 11.2±4.2 33 16.2±2.4 36 15.6±2.2 p-value (95% CI) 0.208 (-0.9;4.0) 0.516 (-1.2;2.3) 0.863 (-1.0;1.2) 0.044 (-2.1;-0.1) SA (mm2) 2mm male 31 7.3±1.6 48 8.3±2.0 61 9.3±2.0 51 9.0±2.7 female 27 6.8±2.9 49 7.9±2.3 68 8.9±2.2 48 9.6±2.4 p-value (95% CI) 0.380 (-0.7;1.8) 0.359 (-0.5;1.3) 0.284 (-0.3;1.1) 0.216 (-1.7;0.4) 6mm male 31 37.0±8.5 48 43.7±8.8 61 51.7±9.2 51 47.3±11.4 female 27 32.0±13.8 49 41.6±10.2 68 50.5±8.5 48 51.5±11.9 p-value (95% CI) 0.100 (-1.0;10.9) 0.276 (-1.7;5.9) 0.444 (-1.9;4.3) 0.080 (-8.8;0.5) 10mm male 21 75.9±20.0 39 88.3±18.1 50 109.0±16.6 49 101.5±18.2 female 16 69.6±26.2 37 86.4±22.6 33 106.5±16.4 36 107.3±18.0 p-value (95% CI) 0.409 (-9.1;21.7) 0.684 (-7.4;11.2) 0.495 (-4.8;9.9) 0.145 (-13.7;2.1)
ARA, alveolar ridge area; ARH, alveolar ridge height; ARW2, alveolar ridge width 2 mm apical to the alveolar crest; ARWS, alveolar ridge width at the base of the sinus floor; CI, confidence interval; PM1, first premolar; PM2, second premolar; M1, first molar; M2, second molar; SA, sinus area; SW, sinus width.
Accepted
Article
Appendix 3. Comparison of the residual alveolar ridge and maxillary sinus dimensions depending on the tooth-gap extent (i.e., group D vs. group E).
PM1 PM2 M1 M2
n mean±SD n mean±SD n mean±SD n mean±SD
ARH (mm) group D 9 7.0±3.5 26 7.3±3.6 57 4.6±1.8 31 5.8±2.6 group E 49 8.6±4.4 71 6.0±3.4 72 4.6±2.8 68 6.3±2.6 p-value (95% CI) 0.313 (-4.7;1.5) 0.111 (-0.3;2.8) 0.947 (-0.8;0.8) 0.361 (-1.6;0.6) ARA (mm2) group D 7 39.2±19.4 24 57.2±34.6 57 41.4±22.6 31 52.3±29.3 group E 35 53.9±31.2 64 39.9±28.2 70 36.4±25.2 66 53.8±28.5 p-value (95% CI) 0.246 (-39.9;10.5) 0.018 (3.0;31.6) 0.248 (-3.5;13.5) 0.821 (-13.8;11.0) ARW2 (mm) group D 9 6.8±1.0 26 8.0±1.7 53 9.0±2.4 29 8.4±2.8 group E 45 6.2±2.2 58 6.5±2.3 56 8.3±2.5 60 8.2±2.8 p-value (95% CI) 0.212 (-0.4;1.6) 0.002 (0.6;2.3) 0.167 (-0.3;1.6) 0.693 (-1.0;1.5) ARWS (mm) group D 7 8.4±1.6 24 10.4±2.2 57 11.6±2.5 31 11.8±2.6 group E 35 9.4±2.5 64 9.3±3.0 70 10.4±2.7 66 10.6±2.5 p-value (95% CI) 0.310 (-3.0;1.0) 0.106 (-0.2;2.4) 0.011 (0.3;2.1) 0.034 (0.1;2.3) SW (mm) 2mm group D 9 4.8±1.2 26 6.0±1.2 57 7.3±1.6 31 7.6±2.7 group E 49 5.5±1.8 71 6.3±1.6 72 7.1±1.6 68 7.0±1.9 p-value (95% CI) 0.225 (-2.0;0.5) 0.299 (-1.1;0.3) 0.395 (-0.3;0.8) 0.188 (-0.3;1.5) 6mm group D 9 7.1±1.5 26 10.3±2.3 57 13.2±2.5 31 13.2±2.5 group E 49 7.8±3.4 71 10.2±2.9 72 13.1±2.1 68 11.9±2.1 p-value (95% CI) 0.348 (-2.1;0.8) 0.835 (-1.1;1.4) 0.791 (-0.7;0.9) 0.008 (0.3;2.3) 10mm group D 5 7.0±3.2 25 10.9±3.4 40 16.5±2.5 26 16.4±1.9 group E 32 8.4±3.8 51 11.8±3.9 43 16.0±2.6 59 14.4±2.4 p-value (95% CI) 0.454 (-5.0;2.3) 0.355 (-2.7;1.0) 0.329 (-0.6;1.6) <0.001 (1.0;3.1) SA (mm2) 2mm group D 9 6.4±1.5 26 7.6±1.6 57 9.3±2.0 31 9.6±2.6 group E 49 7.2±2.4 71 8.2±2.3 72 9.0±2.2 68 9.1±2.5 p-value (95% CI) 0.372 (-2.4;0.9) 0.229 (-1.6;0.4) 0.420 (-0.4;1.0) 0.386 (-0.6;1.6) 6mm group D 9 31.6±5.5 26 42.3±7.6 57 51.7±9.5 31 52.1±13.0 group E 49 35.2±12.2 71 42.7±10.2 72 50.5±8.3 68 48.1±11.0 p-value (95% CI) 0.165 (-8.9;1.6) 0.868 (-4.7;4.0) 0.459 (-1.9;4.3) 0.119 (-1.0;9.0) 10mm group D 5 63.1±14.4 25 85.0±17.8 40 108.9±17.1 26 111.6±17.5 group E 32 74.7±23.6 51 88.6±21.5 43 107.2±16.1 59 100.6±17.7 p-value (95% CI) 0.294 (-33.8;10.5) 0.473 (-13.5;6.3) 0.632 (-5.5;9.0) 0.010 (2.7;19.2)
Accepted
Article
Group E: edentulous, i.e., all premolars and molars missing; group D: 1 or 2 neighboring teeth missing. ARA, alveolar ridge area; ARH, alveolar ridge height; ARW2, alveolar ridge width 2 mm apical to the alveolar crest; ARWS, alveolar ridge width at the base of the sinus floor; CI, confidence interval; PM1, first premolar; PM2, second premolar; M1, first molar; M2, second molar; SA, sinus area; SW, sinus width.
Appendix 4. Comparison of the residual alveolar ridge and maxillary sinus dimensions at different tooth positions (generalized estimating equations).
Parameter Comparison B 95% CI p-value
ARH (mm) PM1-PM2 3.66 2.72; 4.60 <0.001 PM1-M1 5.32 4.27; 6.37 <0.001 PM1-M2 3.88 2.71; 5.04 <0.001 PM2-M1 1.66 1.03; 2.29 <0.001 PM2-M2 0.22 -0.57; 1.01 0.585 M1-M2 -1.44 -2.03; -0.85 <0.001 ARA (mm2) PM1-PM2 19.94 11.76; 28.11 <0.001 PM1-M1 25.48 16.71; 34.24 <0.001 PM1-M2 8.69 -0.69; 18.07 0.069 PM2-M1 5.54 -0.40; 11.48 0.068 PM2-M2 -11.25 -18.18; -4.31 0.001 M1-M2 -16.78 -21.66; -11.91 <0.001 ARW2 (mm) PM1-PM2 -0.45 -0.91; 0.01 0.055 PM1-M1 -2.12 -2.70; -1.53 <0.001 PM1-M2 -2.04 -2.7; -1.37 <0.001 PM2-M1 -1.67 -2.17; -1.16 <0.001 PM2-M2 -1.59 -2.18; -1.00 <0.001 M1-M2 0.08 -0.55; 0.71 0.808 ARWS (mm) PM1-PM2 -0.02 -0.66; 0.61 0.946 PM1-M1 -1.24 -1.95; -0.53 0.001 PM1-M2 -1.43 -2.15; -0.72 <0.001 PM2-M1 -1.22 -1.73; -0.71 <0.001 PM2-M2 -1.41 -2.03; -0.79 <0.001 M1-M2 -0.19 -0.69; 0.30 0.443 SW (mm) 2mm PM1-PM2 -1.00 -1.42; -0.59 <0.001 PM1-M1 -1.90 -2.34; -1.45 <0.001 PM1-M2 -1.91 -2.47; -1.35 <0.001 PM2-M1 -0.89 -1.26; -0.53 <0.001 PM2-M2 -0.91 -1.40; -0.41 <0.001 M1-M2 -0.01 -0.45; 0.42 0.947 6mm PM1-PM2 -3.35 -4.03; -2.67 <0.001 PM1-M1 -6.20 -7.03; -5.37 <0.001 PM1-M2 -5.35 -6.24; -4.45 <0.001 PM2-M1 -2.85 -3.39; -2.31 <0.001 PM2-M2 -2.00 -2.69; -1.31 <0.001 M1-M2 0.85 0.36; 1.35 0.001 10mm PM1-PM2 -5.60 -6.63; -4.58 <0.001 PM1-M1 -9.74 -11.17; -8.31 <0.001 PM1-M2 -8.77 -10.02; -7.52 <0.001
Accepted
Article
PM2-M2 -3.17 -4.19; -2.15 <0.001 M1-M2 0.97 0.14; 1.80 0.022 SA (mm2) 2mm PM1-PM2 -1.23 -1.84; -0.62 <0.001 PM1-M1 -2.52 -2.89; -1.62 <0.001 PM1-M2 -2.39 -3.01; -1.68 <0.001 PM2-M1 -1.03 -1.50; -0.55 <0.001 PM2-M2 -1.16 -1.78; -0.54 <0.001 M1-M2 -0.13 -0.68; 0.42 0.637 6mm PM1-PM2 -9.38 -11.95; -6.80 <0.001 PM1-M1 -17.52 -20.31; -14.72 <0.001 PM1-M2 -16.07 -19.54; -12.60 <0.001 PM2-M1 -8.14 -10.14; -6.14 <0.001 PM2-M2 -6.70 -9.54; -3.85 <0.001 M1-M2 1.44 -0.79; 3.68 0.206 10mm PM1-PM2 -22.46 -30.32; -14.60 <0.001 PM1-M1 -40.06 -49.62; -30.50 <0.001 PM1-M2 -37.69 -46.41; -28.97 <0.001 PM2-M1 -17.60 -23.10; -12.11 <0.001 PM2-M2 -15.23 -21.03; -9.43 <0.001 M1-M2 2.38 -2.54; 7.29 0.343ARA, alveolar ridge area; ARH, alveolar ridge height; ARW2, alveolar ridge width at 2 mm apical to the alveolar crest; ARWS, alveolar ridge width at the base of the sinus floor; CI, confidence interval; PM1, first premolar; PM2, second premolar; M1, first molar; M2, second molar; SA, sinus area; SW, sinus width.