Implementation of the Baltic
Sea Action Plan (BSAP)
in the Russian Federation;
eutrophication segment,
point sources
Results from the RusNIP project
MINISTRY OF NATURAL RESOURCES AND ENVIRONMENT OF THE RUSSIAN FEDERATION
in the Russian Federation;
eutrophication segment,
point sources
Results from the RusNIP project
ISSN 0282-7298
The ministers of environment from the Baltic Sea States agreed upon the Baltic Sea Action Plan (BSAP) in Krakow in November 2007.
Russia and Sweden have a joint co-operation project which aims to strengthen the capacity for compliance with BSAP. The project is focusing on euthrophication.
The report concentrate on discharges of nutrients from point sources. The report shows that preliminary obligations for the Gulf of Finland will be met by the ongoing measures within St. Petersburg Vodokanal. For the Baltic Proper powerful measures for phosphorus and nitrogen treatment in bigger sewage treatment plants are in most cases cost-effective. Anyhow this is not enough to reach the Russian BSAP obligations.
Russia contributes to transboundary loads to the Gulf of Riga with 114 tons. It has not been possible to find out what the sources can be and what measures should be taken.
eutrophication segment, point sources
Report
REPORT 6368 • MARCH 2010
is handled by the Swedish Agency for Marine and Water Management. Telephone +46 (0)10 698 60 00 publications@havochvatten.se www.havochvatten.se/publications
SWEDISH ENVIRONMENTAL PROTECTION AGENCY
in the Russian Federation;
eutrophication segment,
point sources
Results from the RusNIP project
Swedish Environmental Protection Agency International Projects Section
Ministry of Natural Resources and Environment of the Russian Federation Department for International Co-operation
Internet: www.naturvardsverket.se/bokhandeln
The Swedish Environmental Protection Agency
Phone: + 46 (0)8-698 10 00, Fax: + 46 (0)8-20 29 25 E-mail: registrator@naturvardsverket.se
Address: Naturvårdsverket, SE-106 48 Stockholm, Sweden Internet: www.naturvardsverket.se
ISBN 978-91-620-6368-9 ISSN 0282-7298 © Naturvårdsverket 2010
Print: CM Gruppen AB
Contents
FOREWORD 3 AcROnymS 6 SummARy 7 InTRODucTIOn 9 Background 9mEASuRES TO REDucE EuThROPhIcATIOn 10
The Russian Federation’s obligation 11 Current load and results of proposed measures 11 Reduce emissions from wastewater treatment plants 13 Gulf of Finland 13 Baltic proper 14 Reduce nutrient inputs from industry 16 The forest products industry 16 The chemical and metal industries 17 The Economics of nutrient load reduction 17 Finding the cost effective measures 17 Finding the optimal policy instrument 19 Financing required investments 20 Cost recovery of financial and environmental costs at Russian Sewage
treatment plants 20 Financial and environmental costs 20 Recovery of financial costs 20 Recovery of environmental costs 21
Conclusion 21
Economic and financial analysis 21 Economic analysis 22 Financial analysis 22
AnnExES
Annex 1 List of Plants within St. Petersburg Vodokanal, Leningrad Oblast priorities and Kaliningrad Oblast 23 Annex 2 Report on sewage treatment plants 25 Annex 3 List of all investigated plants within St. Petersburg Vodokanal,
Leningrad Oblast priorities and Kaliningrad Oblast including
estimated costs 79 Annex 4 Report on industries 85 Annex 5 Economic and financial analysis 115
Acronyms
BSAP Baltic Sea Action Plan (HELCOM action plan for the Baltic Proper, the Gulf of Finland and the Gulf of Riga
BaltHazAR Baltic Hazardous waste and Agricultural releases Reduction
EU European Union
GIS Geographic Information System
HELCOM Helsinki Commission (cooperation body of the Baltic Sea states for the Helsinki Convention)
NIP National Implementation Plan
PLC 5 Pollution Load Compilation No. 5 (The fifth compilation of the load of pollutants on the Baltic Sea)
Summary
The Ministers of the Environment from the Baltic Sea Countries and the High Representative of the European Commission in November 2007, within the framework of HELCOM, adopted the HELCOM Baltic Sea Action Plan (BSAP) concerning the Baltic Proper, the Gulf of Riga and the Gulf of Finland. The goal of the action plan is to achieve good environmental status by 2021. The action plan consists of around 150 different activities in four main seg-ments and another four sections. The main segseg-ments cover eutrophication, hazardous substances, biodiversity and nature conservation including fisher-ies, and maritime activities. The other four sections concern development of assessment tools and methodologies, awareness raising and capacity building, financing and implementation and revision of the Baltic Sea Action Plan.
According to the plan the Baltic Sea Countries are to develop national programmes and submit them for HELCOM assessment at a HELCOM min-isterial meeting in May 2010. For euthrophication, measures are to be imple-mented by 2016 at the latest, with the exception of certain measures in the wastewater sector where other timetables are established in adopted recom-mendations.
The present document is a report from a joint co-operation project between Sweden and the Russian Federation “Capacity for Compliance with Baltic Sea Action Plan named RusNIP.
The greatest challenge in BSAP is to reduce nutrient inputs. Under the preliminary burden sharing, the Russian Federation is to reduce its nitrogen inputs by 6,970 tonnes and its phosphorus inputs by 2,500 tonnes, based mainly on discharge figures for year 2000.
The principal sources of nitrogen and phosphorus inputs are municipal wastewater treatment plants and agriculture. The industry sector, mainly the forest products industry, the chemical industry, the metal industry, single-household sewage systems and forestry also contribute.
Specific measures regarding euthrophication caused by discharges from major point sources are, as far as possible, discussed in this plan. Municipal waste water treatment plants (sized for more than 10,000 inhabitants) and waste water treatment in the forest, chemical and metal industry are discussed and measures to improve waste water treatment are proposed. The agricultural pollution is dealt within the EU BaltHazAR agri project managed by Project Implementation Unit, PIU established in the HELCOM secretariat aiming at improvements in manure management. The ongoing and proposed measures presented below for waste water treatment plants signify a reduction in inputs of approximately 7,200 tonnes of nitrogen and around 2,000 tonnes of phorus to Gulf of Finland and 1,700 tons of nitrogen and 360 tons of phos-phorus to Baltic Proper.
The Russian BSAP preliminary obligations for the Gulf of Finland, 4,145 tonnes of nitrogen and 1,661 tonnes of phosphorus, will be met by the on-going measures within SUE St. Petersburg Vodokanal. Nevertheless, there
plants based on their potential for nutrient reductions. Those are; Kingisepp 100,000 people, Sosnovy Bor 70,000 people, Vyborg 100,000 people, Gatchina 100,000 people, and Sertolovo 70,000 people.
Regarding the Baltic Proper actions in Kaliningrad oblast are needed in order to fulfil the Russian BSAP preliminary obligations, 2,821 tonnes of nitrogen and 724 tonnes of phosphorous These obligations will not be met by the proposed measures. Further actions are accordingly needed in smaller tows and/or within the agricultural sector. This has to be further investigated by Russian Federation as soon as possible. The following plants are proposed as priority plants; Kaliningrad 475,000 people, Zaostrovje 40,000 people, Chernjahovsk 42,000 people, and Gvardejsk 15,000 people.
The priority measures in point sources are in the municipal waste water treatment sector as the measures within the industrial sector would give only minor reductions,
In addition Russia contributes to transboundary loads. Thus, Russia has to reduce the phosphorus load to the Gulf of Riga with 114 tons by upgrading waste water treatment to meet HELCOM recommendations and other meas-ures in Russia, which covers 1/3 of the river Daugava drainage basin. This is based on the information available regarding the size of the population living in this area at the time for the Krakow meeting. Within this project it has not been possible to identify the sources and what measures to be taken. This issue has to be further elaborated by Russia within the HELCOM work by the ministerial meeting in 2013.
Due to high retention of phosphorous (ca 70%) and nitrogen (ca 30%) in Lake Ladoga and Lake Pepsi, the sources upstream of these lakes have not been proposed as priority. The measures in these would not be cost-effective in reducing pollution to the Baltic Sea. Information concerning some sewage treatment plants and industries upstream of Lake Ladoga is, however, given.
Since the load will vary between years, a way to describe the loads reduc-tion requirements is to show maximum allowable inputs for each coun-try and basin. For Russia the maximum allowable inputs are for nitrogen 84,420 tonnes and for phosphorus 4,183 tonnes.
The HELCOM expert workshop of June 2009 pointed out that the cur-rent allocation model for the country-wise nutrient reductions is in some cases based on uncertain figures for treatment levels of eg the sewage treat-ment plants and an update to that information would be needed since a lot of changes and improvements in waste water treatment have taken place. The maximum allowable inputs and burden sharing are under discussion within HELCOM and will be reviewed for the 2013 Ministerial Meeting.
Introduction
Background
The ministers of the environment of the countries around the Baltic Sea decided on 15 November 2007 on a joint action programme, the HELCOM Baltic Sea Action Plan (BSAP).
The plan consists of four main segments and other four sections. The main segments are concerned with eutrophication, hazardous substances, biodiver-sity including fisheries and maritime issues (shipping, accidents, emergency services etc.). The other four segments deal with the development of assessment tools and methodologies, awareness raising and capacity building, financing and implementation/review of the plan.
Under the plan, the countries accepted the description of the environmen-tal status of the Gulf of Finland, the Gulf of Riga and the Baltic Proper and a number of formulated environmental objectives. With regard to euthrophica-tion, a provisional distribution has been agreed for how much emissions to the various basins from each country are to be reduced by the “burden sharing”. The measures in the eutrophication segment are to be implemented by 2016 with some exemptions for sewage treatment plants.
According to the BSAP all member countries shall have their respective National Implementation Plans (BSAP-NIP) ready before May 2010 for dis-cussion and decisions by a ministerial meeting in May 2010 in Moscow.
In order to promote the elaboration of the Russian BSAP-NIP, Sweden and Russia have included a joint co-operation project for strengthening the prereq-uisites this work in the bilateral Work Programme for 2009–2010.
Overall Objectives for this Project are: a) To contribute, mainly concern-ing euthrophication, to the implementation of BSAP and its goal to achieve good environmental status in the Baltic Sea by 2021, b) To strengthen the capacity of Russian authorities to meet the requirements of the Baltic Sea Action Plan (BSAP) in the most effective way.
Project Objective: To have Proposals for the National Implementation Plan for the Russian part of BSAP elaborated with regard to the nutrient reduction requirements and to propose institutional conditions necessary for the implementation of the NIP”.
Since this project, named RusNIP, was initiated an EU project (BaltHazAR) has been launched concerning pollution of the Baltic Proper and Gulf of Finland by hazardous substances and nutrients. The eutrophication part deals with pollution from big animal farms especially concerning manure heaps. Due to that the RusNIP project is concentrated on point sources (municipal and industrial). Other measures such as discharges from single houses and phos-phorous free detergents have not been elaborated. There is a close coordination between the work within RusNIP and BaltHazAR. The results and findings from the Russian/Finish project PRIMER have also been carefully used. The PRIMER project is focused on the catchment area the Gulf of Finland.
Measures to reduce euthrophication
The greatest challenge in BSAP is to reduce the nutrient load. The principal sources of nitrogen and phosphorus load are inputs from wastewater treat-ment plants, the industry sector mainly the forest products industry, the chem-ical industry, the metal industry and agriculture. Private sewage systems and forestry also contribute to a small extent.The Russian Federation is to reduce its nitrogen and phosphorus inputs to the Baltic Proper and the Gulf of Finland, while a further reduction to the Gulf of Riga only is required under the burden sharing for phospho-rus. The burden sharing between the countries will be adjusted through the HELCOM activity which is in progress in the work of PLC 5 (Pollution Load Compilation).
The agricultural sector is dealt with by the EU BaltHazAR agri project concerning changes in manure management. In this project wastewater treat-ment plants and further treattreat-ment in the pulp and paper industry and some chemical and metal industries are discussed and measures within the waste water treatment sector are proposed.
The ongoing and proposed measures result in the reduction of inputs of approximately 9,000 tonnes of nitrogen and around 2,400 tonnes of phosphorus. Since the loads will vary between years, a way to describe the requirements of antropogenic load reduction is to show maximum allow-able inputs for each country and basin. These numbers can be calculated from the data on loads, minus antropogenic loads reductions requirements as used in the Krakow agreement. For Russia a total load 2006 are for nitrogen 68,536 tonnes and for phosphorus 5,348 tonnes and the maximum allowable inputs are for nitrogen 84,420 tonnes and for phosphorus 4,183 tonnes. This means that no further actions are needed for nitrogen, but for phosphorus. This approach is discussed within HELCOM.
In addition to these reductions, Russia contributes to transboundary loads. Thus, Russia has to reduce the phosphorus load to the Gulf of Riga with 114 tons by upgrading sewage treatment to HELCOM recommendations in installations within the Russian part which covers 1/3 of the Daugava drain-age basin. This is based on the information available concerning the popula-tion living in this area at the time for the Krakow meeting. During the work with this project it has not been possible to find out which the sources can be and what measures should be taken. This issue has to be further elaborated by Russia within the HELCOM work.
Due to high retention of phosphorous (ca 70%) and nitrogen (ca 30%) in Lake Ladoga and Lake Pepsi all sources upstream these lakes have not been dealt with due to that measures in these areas are not cost-effective from BSAP point of view. Information concerning some sewage treatment plants and industries upstream of Lake Ladoga is although given.
The Russian Federation’s obligation
The BSAP plan contains a partially new approach for eutrophication. Based on what inputs the Baltic Sea can tolerate in order to attain environmental objectives previously decided upon by HELCOM, including visibility depth and nutrient levels, burden sharing has been decided upon for the countries’ reduction of nutrient load (phosphorus and nitrogen). The figures are prelimi-nary and will be adjusted based, among other things, on data from the work within PLC 5.
According to the preliminary burden sharing, the Russian Federation is to reduce its nitrogen inputs by 6,970 tonnes and its phosphorus inputs by 2,500 tonnes.
In the BSAP agreement, as signed in Krakow November 2007, total load reductions for each country and to each sub basin of the Baltic were given. However, the load reductions requirement of each country to each sub basin were not shown and are only given in the background document that are not easily accessible from the HELCOM web site. This document was distributed at the RusNIP meeting in September 2009 in Helsinki.
The reduction requirements for Russia are:
• the Gulf of Finland of 4,145 tonnes of nitrogen out of a total load of 78,792 tonnes and of 1,661 tonnes of phosphorus out of a total load of 5,302 tonnes,
• the Gulf of Riga of 114 tonnes of phosphorus,
• the Baltic Proper of 2,821 tonnes of nitrogen out of a total load of 10,594 tonnes and of 724 tonnes of phosphorus out of a total load of 1,266 tonnes.
These reductions are needed in order to reach a good environmental status in the sea, from those loads that occurred, as an average for the period 1997–2003.
Current load and results of proposed measures
Table 1. Gulf of Finland
nitrogen
(tonnes/year Phosphorous (tonnes/year)
Obligation according to preliminary burden sharing
4,145 1,661
Average load 1997–2003 BSAP figures 78,792 5,302 Proposed measures industry downstream of Lake Ladoga * 122–132 17–20 Proposed measures (including ongoing measures) within
priority municipal waste water treatment plants down-stream of Lake Ladoga *
7,224 2,015
Remaining need for action ** + 3,200 + 370
* Mainly based on year 2000 discharge figures. ** The reduction is bigger than the BSAP obligations. *** The reduction is less than the BSAP obligations.
Table 2. Baltic Proper
nitrogen
(tonnes/year Phosphorous (tonnes/year)
Obligation according to preliminary burden sharing 2,821 724 Average load 1997–2003 BSAP figures 10,594 1,266
Proposed measures industry * 0 0
Proposed measures municipal waste water treatment plants *
1,696 361
Remaining need for action *** –1,125 –363
* Mainly based on year 2000 discharge figures. ** The reduction is bigger than the BSAP obligations. *** The reduction is less than the BSAP obligations.
The consequence of table 1 and 2 is that the current actions, especially within St. Petersburg City sewage treatment plants, the BSAP obligations according to preliminary burden sharing are fulfilled for the Gulf of Finland but there are still further actions than proposed to be taken within Kaliningrad oblast in order to fulfil these obligations for the Baltic Proper.
There are nevertheless a number of plants in urgent need of either improvement or reconstruction especially within Leningrad Oblast, due to either sanitation or local/regional environmental reasons. Five treatment plants near the coastline of Gulf of Finland have been selected as priority plants due to these reasons.
In addition to these reductions, Russia contributes to transboundary loads. Thus, Russia has to reduce the phosphorus load to the Gulf of Riga with 114 tons by upgrading sewage treatment to HELCOM recommendation fig-ures in installations within the Russian part which covers 1/3 of the Daugava drainage basin. This is based on the information available concerning the population living in this area at the time for the Krakow meeting. During the work with this project it has not been possible to find out what the sources can be and what measures should be taken. This issue has to be further elabo-rated by Russian Federation within the HELCOM work until the ministerial meeting 2013.
Due to high retention of phosphorous (ca 70%) and nitrogen (ca 30%) in Lake Ladoga and Lake Pepsi all sources upstream these lakes have not been dealt with due to that measures in these areas are not cost-effective from BSAP point of view. Information concerning some sewage treatment plants and industries upstream of Lake Ladoga is given.
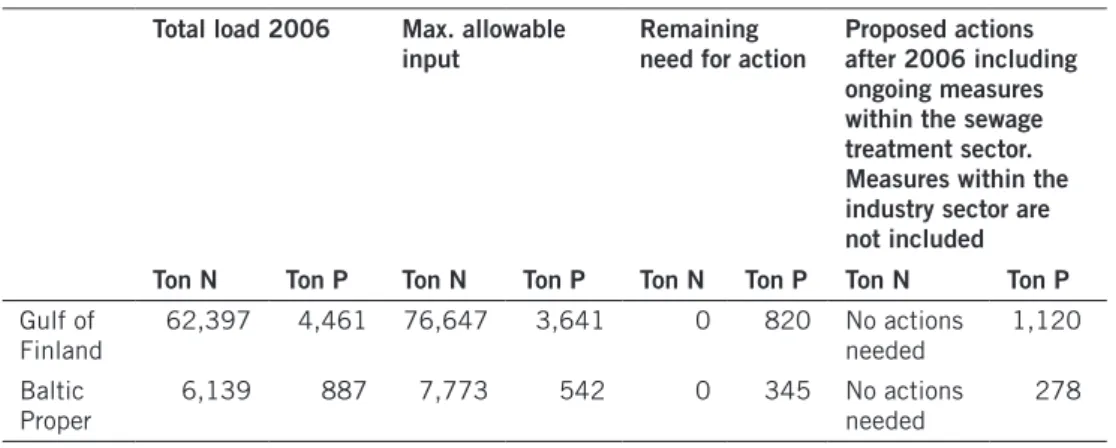
Since the loads will vary between years, a way to describe the loads reduc-tion requirements is to show maximum allowable inputs for each country and basin. This approach is discussed within HELCOM. For Russia total load 2006 and maximum allowable inputs are:
Table 3. maximum allowable input to Gulf of Finland and Baltic Proper Total load 2006 max. allowable
input Remaining need for action Proposed actions after 2006 including ongoing measures within the sewage treatment sector. measures within the industry sector are not included
Ton n Ton P Ton n Ton P Ton n Ton P Ton n Ton P
Gulf of
Finland 62,397 4,461 76,647 3,641 0 820 No actions needed 1,120 Baltic
Proper 6,139 887 7,773 542 0 345 No actions needed 278
Reduce emissions from wastewater treatment
plants
In Russia sewage treatment plants are the main point sources for nutrient dis-charges, annexes 1, 2, 3.
In this project we have investigated cost-effective measure to fulfil the BSAP obligations according to preliminary burden sharing.
In order to reduce nutrient inputs to the sea from the built environment,
the countries have agreed, according to recommendations adopted in BSAP, to take measures at the wastewater treatment plants (more than 100,000 p.e., 10,001–100,000 p.e., 2,000–10,000 p.e., 300–2,200 p.e.) and on how waste-water in rural areas and small settlements is to be dealt with.
Gulf of Finland
WHY?
Powerful measures for phosphorus and nitrogen treatment in sewage treat-ment plants which receive wastewater from 10,000 or more population equiv-alents (pe) downstream of Lake Ladoga and Lake Pepsi are in most cases most cost-effective. Actions within priority sewage treatment plants selected due to their location near the coastline of Gulf of Finland are proposed even though measures in these plants not are needed to fulfil the BSAP obligations accord-ing to preliminary burden sharaccord-ing but due to sanitarian and regional/local environment point of view.
Information concerning some plants upstream of Lake Ladoga is given in Annex 2.
HOW?
In the case of phosphorus and nitrogen, measures are ongoing and further measures are proposed in priority waste water treatment plants downstream of Lake Ladoga and Lake Pepsi with discharges to the Gulf of Finland. This applies for 5 cities and St. Petersburg Vodokanal in the Leningrad Oblast.
The conditions and assumptions for the proposals have been the following: • Assessment of potential amounts of BOD5, phosphorus (P) and
nitrogen (N) are based on the specific pollution rates defined as person equivalent (pe): BOD5, 60 g/ pe/d; P, 2.5 g/ pe/d and N, 12 g/ pe/d. In some cases other specific pollution figures are known. Then these figures are used. This is indicated in the description of each plant below.
• In order to simplify the calculations the following assumptions are made: Unless reliable information on the plant status is given it is assumed that a new facility will be built for wastewater treatment;
For plants located upstream either lake Ladoga or lake Pepsi it has been assumed that the retentions of Phosphorus and Nitrogen are 70 and 30% respectively.
A potential to reduce discharges by new or/and upgrading the waste water treatment exist. The measures can reduce the discharges of phosphorus with 2,015 tonnes, whereof 1,768 tonnes from St. Petersburg Vodokanal wastewa-ter treatment plants, and nitrogen with 7,223 tons whereof 6,246 tonnes from St. Petersburg Vodokanal wastewater treatment plants. Quite many measures are already taken in St. Petersburg waste water treatment plants after year 2000.
WHO?
The Ministry of Natural Resources and Environment of the Russian Federation, the Neva-Ladoga Water Basin Authority and the municipalities
TIMETABLE
As soon as possible, but no later than 2016 for most of the plants.
BENEfIT
Expansion of the treatment plants taken, under way and proposed for phos-phorus and nitrogen treatment so that they meet the requirements of the HELCOM recommendations from the ministerial Krakow meeting means a reduction in inputs to the Gulf of Finland of around 2,000 tonnes of phospho-rus and 7,200 of nitrogen. The obligations according to preliminary burden sharing in the BSAP are already fulfilled but there are a number of plants in urgent need of either improvement or reconstruction due to either sanitation and local/regional environmental reasons.
Baltic proper
WHy?
Powerful measures for phosphorus and nitrogen treatment in sewage treat-ment plants (WWTPs) which receive wastewater from 10,000 or more population equivalents (pe) are in most cases cost-effective. Anyhow this is
not enough to reach the Russian BSAP obligations according to preliminary burden sharing. Further actions are needed in smaller tows and/or within the agricultural sector. This has to be further investigated by Russian Federation as soon as possible.
HOW?
A potential to reduce discharges by new or and upgrading the waste water treatment plants exist.
The conditions and assumptions for the proposals have been the following: • Assessment of potential amounts of BOD5, phosphorus (P) and nitrogen
(N) are based on the specific pollution rates defined as person equivalent (pe): BOD5, 60 g/ pe/d; P, 2.5 g/ pe/d and N, 12 g/ pe/d. In some cases other specific pollution figures are known. Then these figures are used. This is indicated in the description of each plant below.
• In order to simplify the calculations the following assumptions are made: Unless reliable information on the plant status is given it is assumed that a new facility will be built for wastewater treatment;
In the case of phosphorus and nitrogen, further measures are proposed in four waste water treatment plants. The measures can reduce the discharges of phos-phorus with 361 tonnes, whereof 280 tonnes from Kaliningrad WWTP and nitrogen with 1,696 tons, whereof 1,358 tonnes from Kaliningrad WWTP.
WHO?
The Ministry of Natural Resources and Environment of the Russian Federation, the Neva-Ladoga Water Basin Authority and the municipalities.
TIMETABLE
As soon as possible, but no later than 2016 for most plants.
BENEfIT
Expansion of the treatment plants proposed for phosphorus and nitrogen treatment so that they meet the requirements of the HELCOM recommenda-tions from the ministerial Krakow meeting means a reduction in inputs to the Baltic Proper of around 1,700 tons of nitrogen and 360 tonnes of phospho-rus. Further actions are needed for phosphorus and nitrogen removal within Kaliningrad Oblast to obtain the BSAP obligation according to preliminary burden sharing, which mean that actions also are needed in smaller cities and within the agricultural sector. No more actions are needed for nitrogen removal according to the maximum allowable inputs.
Reduce nutrient inputs from industry
The industry sector is not a dominant source for nutrient load, annex 4.
The forest products industry
WHy?
Inputs from the forest-product industry within the decided catchment area of the Gulf of Finland downstream of Lake Ladoga are around 58 tonnes of nitrogen and 14 tonnes of phosphorus. Two plants upstream of Ladoga have been investigated and the inputs are around 160–180 tonnes of nitrogen (without retention) and 45 tonnes of phosphorus (without retention) to the Gulf of Finland.
The estimated inputs from the forest-product industry within the catch-ment area of the Baltic Proper are around 6 tonnes of nitrogen (2008) and 0.5–2 tonnes of phosphorus. This assumes that the existing two pulp and paper mills in Kaliningrad have closed down their sulphite pulp production.
HOW?
Most of the pulp mills are rather small and old. The only reasonable way to reduce the discharges would for the old small mills be a radical renovation and modernization. For the small old mills a change in production pattern towards paper production could be reasonable combined with better treat-ment of the waste water.
It is roughly estimated that a reduction is possible for phosphorus with 7–10 tonnes for the plants situated downstream of Lake Ladoga to the Gulf of Finland. The two plants upstream of Lake Ladoga a reduction is possible with around 15–18 tonnes of phosphorus (without retention) to the Gulf of Finland.
Reductions in nitrogen and phosphorus to the Baltic Proper are not sig-nificant.
With the adopted discharge figures upstream and downstream Lake Ladoga the following analysis of the incremental impact of treatment facilities and retention factor are presented:
Table 4. Potential reduction of nutrient from forest-product industry
Initial amounts Reduction Retention To Gulf of
Finland
Location ton
n/year ton P/year ton n/year ton P/year ton n/year ton P/year ton n/year ton P/year
Upstream Ladoga 170 45 15–18 51 19–21 119 8–9 Downstream Ladoga 58 14 32 7–10 0 0 26 4–6 Baltic Proper 6–30 0.5–2 0 0 6–30 0.5–2 WHO?
The chemical and metal industries
WHY?
There are two chemical industries which are producing base chemicals, pet-rochemicals and fertilizers which lie within the decided catchment area of Gulf of Finland. Two chemical industries and one chemical and metal indus-try upstream of Lake Ladoga have been investigated. The inputs are around 130–140 tonnes of nitrogen and 21 tonnes of phosphorus from the industries downstream of Lake Ladoga and 600 tonnes of nitrogen (without retention) and 160 tonnes of phosphorus (without retention) upstream of Lake Ladoga.
HOW?
A potential to reduce discharges by internal measures and wastewater treat-ment exist. The measures within the industries situated downstream of Lake Ladoga could reduce the discharges of phosphorus by 10 tonnes a year and a potential for nitrogen with 130–140 tonnes yearly and upstream of Lake Ladoga with a potential of 400 tonnes of nitrogen (without retention) and 100 tonnes of phosphorus (without retention).
With the adopted discharge figures upstream and downstream Lake Ladoga the following analysis of the incremental impact of treatment facilities and retention factor are presented:
Table 5. Potential reduction of nutrients from chemical and metal industries
Initial amounts Reduction Retention To Gulf of
Finland
Location ton
n/year ton P/year ton n/year ton P/year ton n/year ton P/year ton n/year ton P/year
Upstream
Ladoga ~600 ~160 ~400 100 60 42 140 18
Downstream
Ladoga 130–140 21 90–100 10 0 0 ~40 11
WHO?
The Ministry of Natural Resources and Environment of the Russian Federation, the chemical and metal industries.
The Economics of nutrient load reduction
Finding the cost effective measuresThe cost-effective measures are those measures that reach the target at lowest socio-economic cost to the society. In order to determine what are cost effec-tive and not cost effeceffec-tive measures a formulated target is therefore needed, which we have from the Baltic Sea Action Plan (BSAP). Thereafter the cost of all possible measures towards the target has to be estimated, not only costs at waste water treatment plants and industry. Figure 1 below illustrates the meaning of cost-effectiveness. Costs are reflected in the y-axis while reduction
in nitrogen or phosphorus is given in the x-axis. The marginal cost curve in the figure indicates that for low reduction targets relatively cheap measures can be implemented, but as the reduction target increases more and more expansive measures have to be implemented in order to reach the target. Since the target is expressed as a certain load to the recipient, being either the Gulf of Finland, the Gulf of Riga or the Baltic proper, the marginal cost curve describes the cost of reducing an additional unit of load to the recipient of concern and not the cost at source.
To obtain a marginal abatement cost curve one need to know each measures: • socio-economic cost, • capacity, • effect on target. Load reduction kg nutrient Cost Marginal cost Target
Cost effective measures Not cost effective measures Figure 1. Determining cost-effective measures.
The socio-economic cost is the opportunity cost of all the resources, such as capital, labour, land etc., required to get the abatement measure implemented. The market price of a resource can in most cases be used as a good proxy for the opportunity cost of the same. However, transfers of money (taxes, sub-sidies, fees, grants) are merely a reallocation of resources and should not be included as a socioeconomic cost.
The uncertainty related to the obtained estimate as well as any positive or negative synergies effects of the measure is also information that might be included in the analysis. In order to determine the cost to the recipient the cost at source needs to be divided by the proportion of the discharge that actually reaches the recipient of concern. In order to do this the retention of nutrients between source and the recipient of concern need to be determined. However, in this context it will be enough to obtain the marginal cost at source in order to do a ranking, especially due to the large degree of uncertainties regarding these costs as well as the retention data.
Due to the limited time and problem with obtaining all the necessary data regarding the reduction potential and cost of different measures it was not possible to do a complete cost-effectiveness analysis with regard to point sources. Due to this, a number of assumptions and generalisations had to
According the decisions taken at the WG 1,WG 2 and WG 3 meetings meas-ures taken at industrial sources was considered to be not cost-effective in reaching the BSAP targets neither was measures taken by waste water treat-ment plants upstream Lake Ladoga and Lake Pepsi due to their high retention level (70% P, 30–40% N) to the final recipients of concern. That is, they are considered to be to the right of the target in Figure 1.
Annex 3 gives the estimated costs per kg N and P reduced for each plant and thereby information regarding which abatement measures are cost effec-tive for a certain target. However, in order to reach over all cost-effeceffec-tiveness these abatement costs have to be compared to the cost of abatement measures within other sectors than waste water treatment plants as well.
Finding the optimal policy instrument
Having identified the cost effective measures for reaching the target, the next step will be to determine the optimal policy instrument in order to get those measures implemented. Dealing with point sources make the search for an efficient policy instrument a little bit easier compared to instruments towards non-point sources. Setting a price on the pollution, by a tax, fee, tradable permit, has proven to be the most cost-effective policy instruments that also generates the largest incentives for technological improvements. Figure 2 below illustrates the cost-effectiveness of a price signal. Suppose that a tax or fee is implemented so that each kg reaching the recipient is taxed at the level depicted in the picture. All measures with a marginal cost below the tax will be implemented since the cost of reduction is less than the tax/fee. In that way all cost-effective measures left of the target in Figure 2 is implemented while all measures to the right of the target, which are not cost effective will not be implemented since it is cheaper for the plants to pay the tax/fee. However, since it is the load to the recipient that is the target such a price must differ with different retention rates in order to be cost-efficient at the recipient, i.e. it will be uniform at the recipient. Any geographically uniform price will only be cost-effective at source and not to the recipient.
Load reduction kg nutrient Cost Marginal cost Target
Cost effective measures Not cost effective measures
Tax/ Fee
However, what is a theoretical optimal policy instrument might not always be politically feasible to implement due to existing policies, distributional effects etc. In Russia, there seems to already exist policy instruments, in the forms of water tariffs, that has the potential to generate the cost effective measures required. However, there seems to have been some barriers preventing them from generating any significant reduction of nutrient discharges.
Financing required investments
The total cost of meeting the target by cost effective measures are illustrated by the area under the marginal cost curve left of the target, denoted A in figure 3 below. This area consists of fixed incremental cost as well as running costs (i.e. operation and maintenance costs). Since abatement measures at waste water treatment plants are characterised by great investment costs and lower running costs, some kind of external financing (e.g. loans, funds) might be required initially. Operational and maintenance costs, however, must be financed by either public sources or users tariffs/fees. And in the case of loans, also the repayments of these needs to be financed over time. Some kind of tariff or fee are therefore necessary in the long run in order to ensure full cost recovery of these costs.
Cost recovery of financial and environmental
costs at Russian Sewage treatment plants
Financial and environmental costsThe operation of sewage treatment plants generates financial as well as envi-ronmental costs. Financial are defined as those costs necessary to construct, manage and maintain a sewage treatment plant. The deprecation of capital must be considered a financial cost since money must be set a side towards investments needed in the future Discharges of environmentally harmful sub-stances into the water by these plants generate environmental costs, in terms of the value of the environmental degradation caused. Full cost recovery implies that the financial and environmental costs of this water use is fully reflected in the price paid by the and that the fees reflecting the financial costs shall go to the municipalities as owners of the plants. In order to assess the level of cost recovery, one has to know the total production and environ-mental costs and the way these costs are paid for by the different users of the water service through existing pricing and financing mechanisms.
Recovery of financial costs
It seems like it is hard for Russian sewage treatment plants to maintain the performance and standard of their sewage treatment plants. The revenue from collected fees is not sufficient to meet the required reinvestments in order to maintain the services of the plant, with regard to water supply to households
recovered by the water fees, since fully recovered financial costs would give enough financial revenue from the water fees for needed investments. Due to this, the depreciation of capital leads to reduced quality of the water supply performance well as reduced nutrient abatement capacity.
Recovery of environmental costs
In order to have full recovery of environmental costs, the damage costs of discharges must be internalised into the water fee paid by the consumers. As mentioned, some kind of evaluation of these damages is necessary in order to determine to correct charge.
While there exists a possibility to charge the water consumers in Russia for the environmental damage caused by their consumption, the revenues from these charges cannot be used to reinvest in the plant but must go towards fed-eral funds for environmental purposes.
Since the plants do not cover their financial costs, necessary investments for operation and sewage treatment cannot be done. This might lead to even higher environmental costs since discharges are likely to increase due to decreased phosphorous and nitrogen abatement capacity and possible leakage from old and unmaintained pipes.
conclusion
The lack of full financial cost recovery of Russian sewage treatment plants appears to be a more serious problem than their lack of environmental cost recovery. Since the performance of the plant decreases over time, financial as well as environmental costs that are not covered by the water charges tends to increase. If financial costs were fully covered by the charges initially, required investments for maintaining the performance could have been made, which would have avoided the degradation of the plants and avoided further increased discharges.
Introducing charges that better cover the financial costs of a sewage treat-ment plant might therefore be a better policy instrutreat-ment towards reducing nutrient discharges than only focusing on fees targeted towards covering envi-ronmental costs. Full recovery of financial costs would make it possible for the plants to do the necessary reinvestments in capital so that the performance of the plant is maintained. It would also reduce the dependency of financing from external investors.
Economic and financial analysis
The objective of annex 5 is to make a crib on how to present investment projects for different financiers. The document goes through in a pedagogical way, point by point, how to carry out economic and financial analyses which rank different investment options.
The analyses which are presented are “Least Cost analysis and Cost-effective analysis. Some assumptions and information must be present in order to per-form the analyses.
Economic analysis
In the economical analysis the document explains three methods for ranking investments projects:
• Net present value method • Internal Rate of Return method • Equivalent annual cost method
Financial analysis
In the financial analysis there are some criteria’s which must be fulfilled in order to ask for external financing through loans.
Among other things a feasibility study must be performed. There is a dis-cussion about how the low degree of cost-recovery in Russian sewage treat-ment plants involve risks for external financiers. For the financiers it is also important that there exists a good analysis of the company/municipality which will operate the sewage treatment plant and be responsible for the investment.
The document advocates that the majority of the investments in Russian sewage treatment plants shall be through national/municipal budgets due to:
• Big external loans means a financial burden for the Russian economy. • Waste water treatment services only gives revenues in local currency. • International financing institutions give loan in foreign currency and
rubels.
Finally the document goes through what information that is absolutely needed in a financial analysis in the feasibility study. The document presents and explains different conceptions and gives examples of how an investment and financial plan could look like.
Annex 1
Plants within St. Petersburg V
odokanal, Leningrad Oblast
priorities and Kaliningrad Oblast
Plants withinW
ithout measures
ton P/year
Reduced amount ton P/year Operation and and maintain cost rubel/kg P
W
ithout measures
ton
n
/year
Reduced amount ton
n
/year
Operation and maintain cost rubel/kg
n
c
omments
St. Petersburg Vodokanal St. Petersburg City South W
est 522 460 3,300 2,100 In operation after 2000 North 900 720 285 4,818 2,800 80 Improvement underway Central 625 440 4,400 730 Improvement underway Kolpino 82 71 2,094 368 264 563 Improvement underway Petrodvorets 59 53 1,485 285 200 197 Improvement underway Metallostroy 30 24 3,279 237 152 518 Improvement underway 1,768 6,246
W
ithout measures
ton P/year
Reduced amount ton P/year Operation and and maintain cost rubel/kg P
W
ithout measures
ton
n
/year
Reduced amount ton
n
/year
Operation and maintain cost rubel/kg
n c omments 57 47 1,639 254 166 384 Improvement planned 80 71 1,385 372 285 325
Feasibility study ready
47 22 885 213 128 236 Improvement planned 55 49 1,535 263 184 409 64 58 1,527 307 215 412 Improvement planned 247 978 219 280 1,732 1,916 1,358 223 Improvement underway 36,5 33 1,782 175 140 430 38 35 1,782 184 145 430 14 13 1,560 66 53 383 361 1,696
Annex 2
Appropriate technologies
for municipal wastewater
treatment plants
Pre
Pre--treatmenttreatment
Primary
Primarysedimentation sedimentation
Anoxic reactor Anoxic reactor Final Final sedimentation sedimentation Sludge
Sludgerere--aerationaeration
Aerobic reactor Aerobic reactor Anaerobic Anaerobic reactor reactor
UCT PROCESS FOR ENHANCED BIOLOGICAL
UCT PROCESS FOR ENHANCED BIOLOGICAL
P AND N REMOVAL
P AND N REMOVAL
Primary
Primarysludgesludgeto treatmentto treatment
Waste
Wasteactivatedactivatedsludgesludgeto treatmentto treatment
Stig Morling Veronika Tarbaeva
SWECO Environment AB Deputy of Head of Neva-Ladoga
Water Basin Administration
Christian Nilsson Vorobyeva Ekaterina
SWECO Environment AB SPb PO “Ecology and Business”
Contents – Annex 2
SummARy 28
1 BAcKGROunD 30
2 BASIc cOnSIDERATIOnS FOR TEchnIcAL AnALySIS 31
3 TEchnIcAL OPTIOnS 35
3.1 Biological nutrient removal by the UCT process 35 3.2 Biological nutrient removal by the Oxidation Ditch process 37 3.3 Biological nutrient removal by the Sequencing Batch Reactor (SBR) process 38
4 OuTLInES OF PLAnT SELEcTIOnS 40
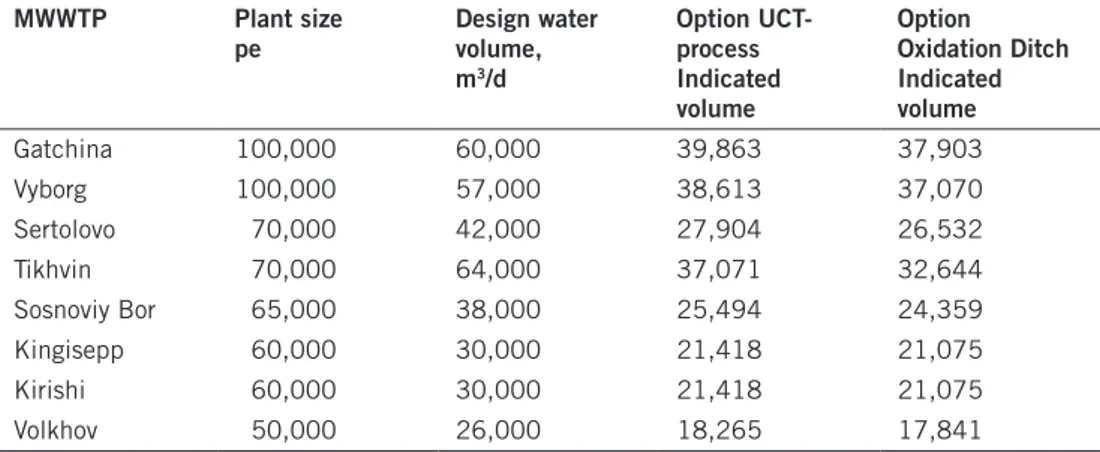
5 mAjOR PLAnTS WIThIn ST. PETERSBuRG VODOKAnAL 42
5.1 Plants sized > 100,000 and down to 50,000 pe 42
6 OuTLInES OF PLAnT SELEcTIOnS WIThIn LEnInGRAD OBLAST 47
6.1 Plants sized > 50,000 pe 47 6.2 Plants sized > 30,000 pe to <50,000 pe 53 6.3 Plants sized < 30,000 pe 56
7 OuTLInES OF PLAnT SELEcTIOnS WIThIn KALInInGRAD OBLAST 61
7.1 Plants sized > 50,000 pe 61 7.2 Plants sized > 30,000 pe to <50,000 pe 62 7.3 Plants sized < 30,000 pe 64
8 SummARy On POTEnTIAL ImPAcT OF mODERn WWTP:S
WIThIn ThE AREA 66
9 InDIcATIVE InVESTmEnT AnD OPERATIOn cOSTS FOR nEW OR
uPGRADED WWTP:S WIThIn ThE AREAS IncLuDED In ThE STuDy 68
9.1 St. Petersburg Vodokanal 68 9.2 Sosnoviy Bor 69 9.2.1 Investment costs 69 9.3 Kingisepp WWTP – 60,000 pe 70 9.3.1 Investment costs 70 9.3.2 Operating costs 70 9.4 Kaliningrad WWTP 72 9.5 Chernjahovsk WWTP – 42,000 ep 72 9.5.1 Investment costs 72 9.5.2 Operating costs 73 9.6 Gvardejsk WWTP – 15,000 pe 75 9.6.1 Investment costs 75 9.6.2 Operating costs 75
TABLE OF FIGuRES
Figure 1-1. Map over Leningrad Oblast with the presented towns
located 30
Figure 3-1. Simplified flow scheme of an UCT-process for biological
nutrient removal 35
Figure 3-2. Typical lay out of a modern Oxidation Ditch system: 37
Figure 3-3. Illustration of a SBR-cycle. 38
Figure 3-4. The Ölmanäs SBR plant in Kungsbacka on
the Swedish West coast, sized for 15,000 pe 39 Figure 6-1. Schematic lay-out of the Kingisepp WWTP for biological
and chemical nutrient removal 51
Figure 7-1. Map of Kaliningrad Oblast, from Preparatory Work on Kaliningrad Waste Water Sector Action Programme 61 Figure 7-2. Simplified lay-out for the Chernyakhovsk WWTP,
Kaliningrad Oblast 63
Figure 7-3. Schematic lay-out for the Gvardejsk WWTP
Summary
The municipal wastewater sector in Leningrad and Kaliningrad regions are analysed in light of the new agreement Baltic Sea Action Plan (BSAP). The task adopted by the Russian side includes a reduction of nitrogen and phos-phorus in accordance with the agreed levels in the Cracow meeting 2007. The given reductions are related to the discharge figures in year 2000. The agreed reduction of nitrogen inputs is 6,970 tonnes per year and its phosphorus inputs is 2,500 tonnes.
A number of actions to improve the municipal discharges in Leningrad Oblast are already underway, especially within St. Petersburg. By improving the situation in St. Petersburg the Gulf of Finland will be unloaded substantially.
Another aspect in this study is the retention of nitrogen and phosphorus in Lake Ladoga and Lake Pepsi. The anticipated retention levels for nitrogen and phosphorus are assumed to be 30 and 70% respectively.
Based on these considerations and the fact that the major discharges from St. Petersburg are either already handled (South West WWTP), or under-way for improvements (Central and North WWTP:s). The focus on needed improvement in this area are defined from other aspects than the BSAP obli-gations. Already decided improvements within St. Petersburg Vodokanal are based on a number of motives. The important matter in the BSAP perspective is that the requiements will be met, and thus contribute to the P and N remno-val impacts in the Gulf of Finland Improved sanitation and or regional/local improvement for plants larger than 10,000 of the water environment have been the decisive factors to select the following plants as suitable for “priority projects” based on treatment plants (sized for more than 10,000 inhabitants) located near the coast line of Gulf of Finland :
Kingisepp WWTP: It is aimed to serve 60,000 inhabitants. The
poten-tial efficiency with respect to N and P reduction will be 184 tons N/year and 49 tons P/year. The indicated investment needs for a new WWTP is around 640 M Rubel, and an annual cost of 75.2 M Rubel.
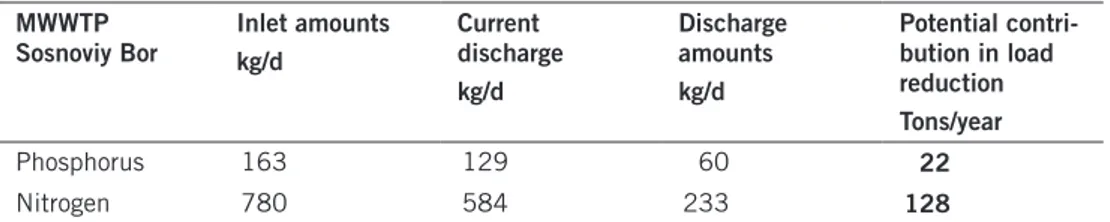
Sosnoviy Bor WWTP: It is aimed to serve 75,000 inhabitants. The
poten-tial efficiency with respect to N and P reduction will be 199 tons N/year and 22 tons P/year. Chemical precipitation is already arranged, but actions for nitrogen removal are to be fulfilled. The indicated investment needs for a new WWTP is around 210 M Rubel, and an annual cost of 47 M Rubel.
Vyborg WWTP: It is aimed to serve 100,000 inhabitants. The potential
efficiency with respect to N and P reduction will be 285 tons N/year and 71 tons P/year. A feasibility study has been performed, and a new WWTP is underway. This plant will however serve only around 35% of the popula-tion and meet the stipultated standards for nitrogen but not for phospho-rus. According to the recent study this limited improvement will call for an investment of around 400 MRubel. The indicated investment needs for a new WWTP, covering the total needs in Vyborg is around 1,006 M Rubel, and an
Gatchina WWTP: It is aimed to serve 100,000 inhabitants. The potential
effi-ciency with respect to N and P reduction will be 166 tons N/year and 47 tons P/year. A feasibility study has been performed, and an upgrade for improved treatment is underway. The indicated investment needs for a new WWTP is around 1,300 M Rubel, and an annual cost of 135 M Rubel.
Sertolovo WWTP is located north of St. Petersburg, within Leningrad
Oblast. The city hosts aroung 70,000 inhabitants. No detailed cific data have been delivered regarding the status of the present plant. It is assumed that a new plant following the HELCOM recommendations will provide potential reduction of phosphorus with 57 tons/year and around 215 tonnes of nitrogen.
In the Kaliningrad Oblast the following plants are defined as priority projects within the BSAP perspective. This covers all sewage treatment plants with a size more than 10,000 inhabitants.
Kaliningrad WWTP: It is aimed to serve around 475,000 inhabitants. The
potential efficiency with respect to N and P reduction will be 1,358 tons N/ year and 280 tons P/year. The indicated investment needs for a new WWTP is around 3,120 M Rubel, and an annual cost of 341 M Rubel. Decisions on financing have been taken, and work is underway for implementation of the upgrade.
Zaostrovje (OKOS): It is aimed to serve 40,000 inhabitants. The
poten-tial efficiency with respect to N and P reduction will be 140 tons N/year and 33 tons P/year. The indicated investment needs for a new WWTP is around 532 M Rubel, and an annual cost of 61 M Rubel.
Chernjahovsk WWTP: It is aimed to serve 42,000 inhabitants. The
poten-tial efficiency with respect to N and P reduction will be 145 tons N/year and 35 tons P/year. The indicated investment needs for a new WWTP is around 545 M Rubel, and an annual cost of 63 M Rubel.
Gvardejsk WWTP: It is aimed to serve 15,000 inhabitants. The
poten-tial efficiency with respect to N and P reduction will be 53 tons N/year and 13 tons P/year. The indicated investment needs for a new WWTP is around 173 M Rubel, and an annual cost of 21 M Rubel.
1 Background
The following tentative technical presentation of relevant treatment methods for a number of treatment plants within St. Petersburg area (operated by St. Petersburg Oblast), Leningrad Oblast and Kaliningrad Oblast are based on a number of basic assumptions of pollution amounts and concentrations espe-cially defined as nitrogen and discharges from anthropogenic origin. In all have 32 different plants been considered. The locations of the different towns and cities in St. Petersburg area and Leningrad Oblast are found in Figure 1-1.
Figure 1-1. Map over Leningrad Oblast with the presented towns located.
As found in the following presentation are not all towns included in the dif-ferent lists. The selection of the towns included has been made by the Russian side. The basis for inclusion in the list has been the size of the towns. Towns with less than 10,000 inhabitants are excluded.
2 Basic considerations for
technical analysis
A number of points are given to identify whether a specific treatment plant is to be included in a priority list:
1. First of all it should be underlined that a more precise definition of “hot spots” ”is used in the following. In the following the sensitive discharge point will be labelled “priority projects”, and be defined by the impact with respect to nitrogen and phosphorus discharges to the Gulf of Finland and Baltic Proper. A large number of treatment plants are in a way covered by the HELCOM recommendations included in a general priority project list, covering the Gulf of Finland and the Kaliningrad area (Baltic Proper). On the other hand are a number of these plants already under upgrade or rehabilitation with the objective to reach the Helcom standards in the recommen-dations. A number of plants remain that will suit the criteria for “BSAP priority projects”. These are identified in the following and presented as “suitable objects for a project list with reference to the RusNIP project.
2. Plant size is a second criteria: Plants with less than 10,000 person equivalents (pe) are to be excluded, plants with a size between 10,001 and 100,000 person equivalents will have one effluent stand-ard level defined below and plants with a size > 100,000 will have the most stringent standards;
3. Discharge criteria according to the HELCOM recommendations taken by the environmental ministers in Cracow 2007 are given as follows Table 2-1;
Table 2-1: Summary of effluent demands in relation to the cracow agreement:
Plant size > 10,000 < 100,000 pe > 100,000 pe
N removal rate > 70% > 80%
N discharge level < 15 ppm < 10 ppm
P removal rate > 90% > 90%
P discharge level < 0.5 ppm < 0.5 ppm
These demands have been used in the following as follows: Two different criteria are given for the nutrient effluents:
• Either a maximum permissible level, for instance < 0.5 mg P/l, or a minimum percentage removal > 90% P-removal.
• As a consequence it is assumed that both criteria must be satis-fied. This in turn means that if the inlet concentration is very dilute, for instance for P = 4 mg/l the 90% removal results in a discharge level of 0.4 mg P/l
4. Assessment of potential amounts of BOD5, phosphorus (P) and nitrogen (N) are based on the following assumptions regarding specific pollution rates defined as person equivalent (pe): BOD5 = 60 g/ pe/d;
P = 2.5 g/ pe/d; N = 12 g/pe/d.
In some cases other specific pollution figures are known. Then these fig-ures are used. This is indicated in the description of each plant below. 5. For the plants in the following analysis the given design population
has been presented by the Russian side. The chosen design horizon for the presented plants is in all cases year 2015, unless other infor-mation is given. In this context it should be observed that some of the currently presented studies, ie for a number of plants within Leningrad Oblast, only presents the current population and outlines more limited treatment objectives. For the sake of simplicity this document uses the design population for year 2015, as presented from the Russian side. Furthermore the calculation of a possible positive impact of nitrogen and phosphorus removal is based on the assumptions presented above. This in turn means that the potential contribution of plant upgrades presented in this document may in some cases be higher than found in other studies, presenting similar treatment objectives.
6. In order to simplify the calculations the following assumptions are made: • Unless reliable information on the plant status is given it is assumed that a new facility will be built for wastewater treatment;
• For plants located upstream either lake Ladoga or lake Pepsi it has been assumed that the retentions of Phosphorus and Nitrogen are 70 and 30% respectively.
7. Generally speaking are the assumed pollution concentrations in the incoming wastewater low. Normally this would be attributed to poor conditions in the sewer system (substantial leakage of ground water and storm water into the sewers). This in turn may limit the number of feasible technical alternatives to be addressed in this study. In a future work within the catchment areas for the different plants the question of sewer system rehabilitation must be addressed and evaluated. 8. The by far dominating treatment concept in the Russian Federation
is mechanical treatment with primary sedimentation + a conven-tional activated sludge step. The list identifies even when other biological treatment methods are used – normally trickling filters (or biological filters);
9. A classical treatment for municipal wastewater as used in the
Russian Federation would result in the following removal efficiencies of nutrients, provided that no chemical precipitation takes place, or special anoxic or anaerobic reactors are included:
N removal 25–30% of incoming amounts; P removal 20–30% of incoming amounts
10. In the following some basic assumptions regarding the needs for upgraded treatment plants have been made.
• The needs for new technical solutions are apparent, but they will all be based on well-known technologies, with a worldwide accept-ance.
• Thus the outlines are based on different updated activated sludge models. The classic activated sludge model is by far the dominating treatment model within Leningrad and Kaliningrad Oblast.
• For the plants within St. Petersburg area somewhat different conditions are apparent: Some of the plants have already been upgraded, such as the large South Western WWTP, or actions are underway such as in the cases of the Central WWTP and the North, WWTP. Together these three plans are serving virtually the whole St. Petersburg. According to St. Petersburg Vodokanal, all plants within the jurisdiction are to be built or are already in compliance with the Helcom recommendations. The plants are presented in chapter 5. • At this very preliminary stage, and in the light of the substantial needs for upgrade of the plants, it is foreseen that in most cases entirely new plants are replacing the old ones.
• At a later stage, when technical-financial feasibility studies are done it is relevant to scrutinize whether parts of the existing plants may be used also in the future.
• The presented calculations of investment needs are strictly limited to the WWTP:s. No costs for upgrading or extensions of the sewer systems have been addressed.
11. Ten different plants will be discussed more in detail:
• The main Kaliningrad WWTP, sized for around 475,000 pe. • The North plant in St. Petersburg, sized for around 2,000,000 pe. • The Central plant in St. Petersburg, sized for 2,000,000 pe. • The South West plant in St. Petersburg, sized for 700,000 pe. • The Sosnoviy Bor WWTP operated with chemical precipitation and sized for around 66,000 pe.
• The Kingisepp WWTP, sized for around 60,000 pe. • The Sertolovo WWTP with a potential connection of around 70,000 pe. • Zaostrovje (OKOS): It is aimed to serve 40,000 inhabitants. • The Chernyakhovsk WWTP, sized for around 40,000 pe. • The Gvardejsk WWTP, sized for around 15,000 pe.
12. The following basic documents have been used for this report: • “Explanatory Note to the “Hotspot” list of Saint-Petersburg, Leningrad and Kaliningrad Regions; October 2009.
• “NEFCO, Preparatory Work on Kaliningrad Waste Water Sector Action Programme; Kaliningrad Waste Water Investments Phase II (KWWIP II) Consolidated Summary Plan for the 20 Project Towns, August 2008”, prepared by Cowi Consultants, Denmark.
• “NEFCO, Preparatory Work on Kaliningrad Waste Water Sector Action Programme; Kaliningrad Waste Water Investments Phase II (KWWIP II), Addendum No.1 Environmental Assessment of Priority Projects, February 2009”, prepared by Cowi consultants, Denmark. • Russian Federation, Government of the Kaliningrad Region, Resolution January 30, 2009 No 46.
• “List of WWTPs in the Russian Federation, for the Leningrad, Kaliningrad and Pskov Oblasts (as for 31.12.2006, reported to HELCOM in October 2007).
• “Business Plan, Municipality Unitary Enterprise “Vodokanal” of Sosnovyi Bor, dated 31.03.2008.
• “Leningrad Oblast Environmental Investment Program, Second Phase, Programme Implementation Plan, Participating Cities: Mga, Tosno,Volosovo, Vyborg, Gatchina, Thihkvin, Saint Petersburg XXXXXXXX 2010” Draft version.
3 Technical options
In the following three different models of enhanced nutrient removing acti-vated sludge models are presented and discussed. As the Russian experience to a very large extent is based on activated sludge we have chosen to limit the following presentation to this concept.
According to the present knowledge the untreated wastewater would be characterised as diluted. The most likely reason for the wastewater dilution is referred to a very bad technical standard of the sewer system. This in turn will limit the possible and feasible treatment methods. It is also likely that the per-centage requirements, rather than the effluent concentrations will become the main criteria for the plant design.
3.1 Biological nutrient removal by the UCT
process
One of the most acknowledged continuously working activated sludge proc-esses aimed for biological nutrient removal based on activated sludge process is labelled the University Cape Town process – in the following UCT process. The process is already accepted for the North St. Petersburg plant. A simpli-fied process scheme is shown in Figure 3-1.
Pre
Pre--treatmenttreatment
Primary
Primarysedimentation sedimentation
Anoxic reactor Anoxic reactor Final Final sedimentation sedimentation Sludge
Sludgerere--aerationaeration
Aerobic reactor Aerobic reactor Anaerobic Anaerobic reactor reactor
UCT PROCESS FOR ENHANCED BIOLOGICAL
UCT PROCESS FOR ENHANCED BIOLOGICAL
P AND N REMOVAL
P AND N REMOVAL
Primary
Primarysludgesludgeto treatmentto treatment
Waste
Wasteactivatedactivatedsludgesludgeto treatmentto treatment
Figure 3-1. Simplified flow scheme of an UCT-process for biological nutrient removal.
The system is developed from the activated sludge process and contains a number of biological reactors arranged in a continuously working treatment chain:
• From a conventional pre-treatment the wastewater will pass into a primary sedimentation. In the case of the Russian plants the primary sedimentation may be excluded, due to the diluted wastewater. • The wastewater enters an anaerobic reactor where the wastewater is
mixed with a denitrified sludge stream from the outlet end of the downstream anoxic reactor. This anaerobic reactor has multipurpose functions:
1. To release phosphorus from the activated sludge – in the anaero-bic environment the bacteria will use volatile fatty acids as the energy source rather than phosphates.
2. To operate as a “sludge selector” by suppressing filamentous bacteria growth.
3. The hydraulic retention time is normally short – in the range 0.5 to 1.0 hours at design flow conditions.
• The mixed liquor (wastewater and return activated sludge) then passes into an anoxic reactor where the water is mixed with nitrified sludge from the final sedimentation and from the outlet of the aero-bic reactor. The anoxic reactor will reduce the nitrates into nitrogen gas biologically by the work of heterotrophic bacteria (denitrifica-tion). It is essential that this reactor is kept at low or zero dissolved oxygen levels, in order to make the denitrification as efficient as possible.
• Finally the mixed liquor passes into the aerobic reactor, where remaining organics are oxidised and synthesized by the activated slugged. At the same time the ammonia nitrogen is oxidised into nitrates.
• The mixed liquor passes into the final sedimentation tanks. The settled activated sludge is recycled into the anoxic reactor, or to a sludge re-aeration basin.
• The sludge re-aeration basin may be used as an intermittently aer-ated tank controlled by the dissolved oxygen level in the reactor. • The biological reactor system is normally designed for a means solids
residence time (SRT) of 12 to 20 days, related to the prevailing water temperatures. For the plants within the Leningrad Oblast it is more than likely that the higher SRT would be used for design, as the water temperature would be found in the range 7–12 oC during winter and spring conditions.
This treatment scheme is likely well suited for the large plants in the region, such as Kaliningrad and Vyborg.
3.2 Biological nutrient removal by the Oxidation
Ditch process
The following main characteristics define the Oxidation Ditch configuration from the hydraulic, process and construction viewpoints. A modern variant, but basically the same system is sometimes labelled “Carousel System”.
• The Oxidation Ditch belongs principally to the family of low-loaded activated sludge systems, often labelled “extended aeration”.
• The Ditch is constructed like a horse track, with long straight sec-tions and steep half circular curves. The cross section was initially a typical trapezoid. In modern systems the cross section is rectangular, and the reactor depth has increased from 1.5 m to 5–6 m.
• The operation of the Ditch is typically an integrated, totally mixed system where aerated and anoxic conditions take place in one single reactor.
• The reactor is equipped with both mixers and bottom aeration devices.
• In modern plants a separate anaerobic reactor is located upstream the main Oxidation Ditch system.
• Return activated sludge from the final sedimentation tank is intro-duced into the main Oxidation Ditch reactor.
• The Oxidation Ditch is arranged in such a way that the “horse track” includes both anoxic and aerobic parts.
• From the anoxic section of the Ditch a limited stream of mixed liquor is pumped back to the anaerobic reactor.
• The discharge of the mixed liquor from the Ditch passes into a final sedimentation tank, as shown in Figure 3-2.
• The Oxidation Ditch would preferably be designed and operated without a primary sedimentation, and the system is designed for an “built in” aerobic stabilisation in the main aerobic/anoxic reactor. • The design SRT is consequently chosen in the range 15–25 days. AIR AIR INFLUENT 4 3 R BOD BODR N NO3 N CLARIFIER RAS EFFLUENT
Figure 3-2. Typical lay out of a modern Oxidation Ditch system.
The Oxidation Ditch system may be found suitable for mid sized plants, such as Chernyakhovsk or Kingisepp WWTP:s.
3.3 Biological nutrient removal by the
Sequencing Batch Reactor (SBR) process
Sequencing Batch Reactor (SBR) is as a matter of fact the original activated sludge configuration, developed in England in the second decade of the last century. The disappearance and “rebirth” of the SBR is a long story that will not be presented here. In this context it is relevant and sufficient to state that the SBR technology is widely spread today, not the least as a system for bio-logical nutrient removal. The process is based on altering the process in a single reactor. A modern process configuration is presented in Figure 3-3.
SBR cycle
SBR cycle
Fill + mixing Fill + mixing Fill + aerate Fill + aerate Aerate Aerate Mixing Mixing Settle Settle Decant DecantFigure 3-3. Illustration of a SBR-cycle.
The SBR system has been used extensively during the last three decades for treatment industrial and municipal wastewater, especially when biological nutrient removal is a demand. A large number of small and medium sized plants have been built in North America, in Europe, Japan and in Australia.