V¨
aster˚
as, Sweden
Thesis for the Degree of Master of Science in Engineering - Robotics
30.0 credits
DESIGN AND DEVELOPMENT OF A
WIRELESS MULTIPOINT E-STOP SYSTEM
FOR AUTONOMOUS HAULERS
Alexander Karlsson
akn13013@student.mdh.se
Examiner: Martin Ekstr¨
om
M¨
alardalen University, V¨
aster˚
as, Sweden
Supervisor: Svetlana Girs
M¨
alardalen University, V¨
aster˚
as, Sweden
Company
Supervisor: Jimmie Wiklander
Volvo Construction Equipment, Eskilstuna
June 26, 2018
Abstract
Safety-related functions are important in autonomous industrial applications and are featured in an extensive body of work contained within the standards. The implementation of safety-related systems is commonly done by an external company at a great cost and with limited flexibility. Thus, the objective of this thesis was to develop and implement a safety-related system using off-the-shelf products and to analyse how well it can comply with the established standards of safety-related functions. This work has sought to review the current standards for safety-functions, the effects of harsh radio environments on safety-related systems, and how to validate the safety-function. The system development process was used to gain knowledge by first building the concept based on a pre-study. After the pre-study was finished, the process moved to the development of software, designed to maintain a wireless heartbeat as well as to prevent collisions between the autonomous and manual-driven vehicles at a quarry, and implementation of the system in real hardware. Fi-nally, a set of software (simulations) and hardware (measurements in an open-pit mine) tests were performed to test the functionality of the system. The wireless tests showed that the system ad-hered to the functional requirements set by the company, however, the evaluated performance level according to ISO 13849-1 resulted in performance level B which is insufficient for a safety-related function. This work demonstrates that it is not possible to develop a safety-related system using the off-the-shelf products chosen, without hardware redundancy.
Table of Contents
1 Introduction 3
1.1 Problem Formulation . . . 3
1.2 Use Case . . . 4
1.3 Requirements and Limitations . . . 4
1.4 Thesis Outline . . . 5
2 Method 6 3 The Emergency Stop Function 7 3.1 Standards for Actuators and Placement . . . 7
3.2 Wireless Industrial standards . . . 7
3.3 Wireless interference . . . 8
3.4 Wireless redundancy . . . 9
3.5 Reliability Analysis and Standards . . . 10
4 System Specification 12 4.1 Software . . . 13
4.1.1 Base-Station . . . 13
4.1.2 Autonomous Machine Client . . . 14
4.1.3 Manual Machine Client . . . 15
4.1.4 Axiomatic Framework . . . 15
4.2 Hardware . . . 16
4.2.1 Emergency Stop Actuator . . . 17
4.2.2 Radio Modem - SATELLAR XT 5RC QAM . . . 18
4.2.3 Axiomatic CAN/ETH Converter . . . 18
4.2.4 Raspberry Pi 3 Model B . . . 18 5 Experimental Setup 19 5.1 Hardware Specification . . . 19 5.2 Testing Environment . . . 19 5.3 Software Testing . . . 19 6 Results 21 6.1 Hardware test . . . 21 6.2 Software Tests . . . 22
6.3 Performance level ISO13849-1 . . . 23
7 Discussion 26
8 Conclusion 29
1
Introduction
Today, automation is receiving increased interest from vehicle manufacturers and new ideas, as well as products, are being developed to provide more competitive solutions. C. Wong et. al. presents a study that highlights the growing need for autonomous robots in other areas than manufacturing
plants, such as transportation [1]. These products have advantages in comparison to manually
operated machines in terms of higher productivity and the ability to work in harsh conditions. This was demonstrated at a coal mine in Korea by S. Huh et. al. where unmanned coal mining
robots worked autonomously under human supervision [2]. However, there is a need for oversight
because people are often involved in the process. In fact, according to Balbir S. Dhillon around 41% of accidents in quarries are related to vehicles [3]. Thus, a safety system is needed in order to keep people in the area safe, in addition to a complementary safety function. In general, this complementary function is a kill-switch with a wireless trigger, which is more commonly referred to as a remote emergency stop (e-stop). Dedicated radio units are used to send the stop signal, and several e-stop triggers are often available at specific positions in the field. Although it is considered a safety function, the e-stop system is not to be confused with a safeguard such as autonomous
object avoidance. Instead, it is regarded as a complementary protective measure [4] that should
only be used in the event of an emergency to prevent the machine from causing additional hazards. The main challenge for a remote e-stop system is that the signal must arrive at its destination, and in a timely fashion. When the e-stop push button is pressed by an operator, the machine is expected to stop its operation and failure to do this might cause damage to company property or even endanger humans in the field. A remote multipoint e-stop system was developed by D. Garca, R. Barber, and M. A. Salichs, where radio frequency modules and microcontrollers were used, to establish bi-directional communication between the receivers and transmitters [5]. This enabled the robot to ensure connectivity, by sending a signal to each e-stop device and trigger the emergency stop function, if a response is not received within a reasonable time frame. In this case, a vacuuming robot was used as a testing platform, which meant dealing with small forces. Larger platforms deal with larger forces that need to be handled in order to avoid causing additional hazards during the stopping procedure. A solution was proposed by S. Sato et. al. to dampen the e-stop process in elevators, where the large impact could cause injuries and even loss of life [6]. Damage to the machine itself should also be avoided if possible because of the loss of production.
This is why an algorithm was developed by M. Morisawa et al. [7] in order to stop a humanoid
robot quickly without falling over, avoiding damage to the equipment.
The wireless signal of an e-stop is required to be as reliable as a wired signal, thus error handling of the connectivity is key. It is equally important to limit the effects of the most common
wireless disturbances that are present at the site. Several tests were performed by P. ¨Angskog
et. al. in an industrial environment to pinpoint the sources of this interference [8]. This work highlights the significance of the effects of impulsive radio disturbance, which is mostly caused by electromechanical machinery in the vicinity. The overcrowding of the ISM frequency bands in the industry is also a problem factor, where 434 MHz was the most likely candidate for high interference.
The aim of this thesis is to develop a safety-related system with remote e-stop functionality, designed for automated vehicles operating in a quarry (i.e. an open-pit mine built for the extraction of crushed stone). This is considered a harsh radio environment because of the abundance of hills, rocks, and piles of gravel that may absorb or propagate a wireless signal.
1.1
Problem Formulation
The majority of e-stop systems currently available use point-to-point communication where data is sent using a single transmitter and receiver configuration. Because the system is dependent on the uplink, a timer is often used to determine if the communication is down and trigger the e-stop to minimise the risk of hazard. Since the wireless connection has a range limitation, some systems add signal repeaters to increase the working distance of the e-stop transmitter. These solutions are generally proprietary and it is difficult to assess their value without prior experience of developing such a system in its entirety. The main goal of this thesis work was to gain a better understanding of the requirements to a remote e-stop system and deliver a working prototype in the process,
using off-the-shelf products.
All commercially available emergency stops need to adhere to certain standards and directives, regarding general design principles, requirements, and validation, thus the first research question is:
RQ1 What are the current requirements and industry standards for a wireless emergency stop
system?
This dictated the design of the system, in regards to e.g. hardware architecture and stopping procedure.
However, it is intended for the system to operate in a quarry which is a harsh environment for wireless signals. It is of high interest to understand how coexisting signals and other sources of interference will affect the system, which is targeted by the second research question:
RQ2 What are the most prevalent wireless sources of interference in a quarry and how does
this interference affect the functionality of an e-stop?
The system is also required to handle multiple point-to-point connections, one for each autonomous vehicle. These links are established using radio modems acting as either a client or a base station. After developing a prototype system it is of vital importance to test it in action in order to validate its performance or redesign the system and gain a higher understanding of the requirements in the process. However, this raised another question on what the important parameters to test in a remote e-stop are, in addition to what variables that need to be controlled in the experiment.
RQ3 How can the functionality and robustness of a wireless emergency stop system be
vali-dated?
Studying the defined research questions provided increased knowledge on the scope of developing a safety-related system, in regards to both software and hardware components.
1.2
Use Case
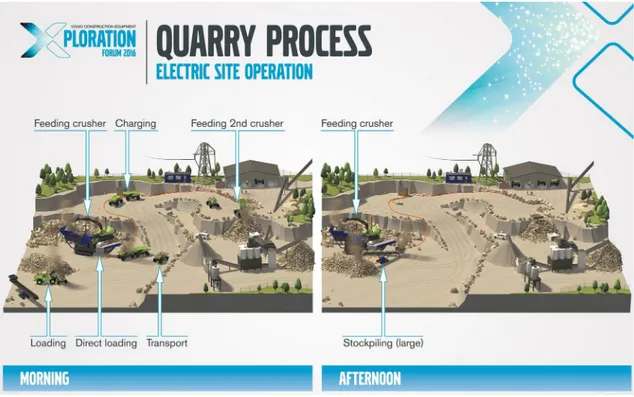
The safety-related function is designed for automated vehicles that are operating in an open-pit mine, which is a concept currently being explored by Volvo CE. The company in question has
presented an example of how such an operation would entail shown in Figure1, where automated
haulers are used to transport crushed rock between different locations. The source of this crushed rock comes in part from a crusher and the other part from a wheel-loader which is manually operated. Because of this, the wheel-loader is working closely with the autonomous machines that are fitted with an existing collision avoidance system to safeguard the operator. This system is dependent on a wireless system of communication which is not expected to have a 100% up-time, thus enabling a single-point-of-failure. An additional safety-system was implemented in this thesis to mend this problem in order to prevent failures from causing a hazardous situation. The new wireless system was expected to cover a minimum distance of 400m and to be able to handle multiple wireless connections to many autonomous machines and a few manually operated machines. The harsh radio environment provides challenges to the reliability of wireless communication on site. Beds of rock, piles of crushed rock, sand, gravel, and machinery cause wireless signals to be absorbed or propagated. The machines are also in motion which may cause multipath fading or distortion of the signal. Thus, the reliability of the wireless communication needs to be validated.
1.3
Requirements and Limitations
This thesis work is contracted by Volvo Construction Equipment AB and comes with limitations on specific parts of the implementation. This is primarily on the choice of hardware which was predetermined before the start of the thesis and needed be able to coexist with a number of systems already integrated on the prototype machine. More specifically, the radio modem [9] from Satellar was chosen to build a system around as well as to test in the field. This system is used in public transportation, emergency vehicles, and automatic traffic lights to improve the flow of traffic. The advantage of this modem is that it uses an unlicensed frequency band at 430-440 MHz which in turn is far away from the coexisting radio systems. In addition, it supports redundancy
Figure 1: Graphical representation of the day-to-day operation at a quarry.
Equip-mentworld, M. G. Doyle. (2016). ”How Volvo CE is engineering a quarry run
by electric loaders and haulers for big cuts to costs and emissions.” [image]
Avail-able at:
https://www.equipmentworld.com/how-volvo-ce-is-engineering-a-quarry-run-by-electric-loaders-and-haulers-for-big-cuts-to-costs-and-emissions/ [Accessed 4 Feb. 2018].
as well as adding signal repeaters to increase the range of the system. This ability as well as the over-the-air reconfiguration makes the system very modular and well suited for a prototype system. A drawback of working on this frequency range is the increased transmission time of the
two-way communication due to having a lower bandwidth than e.g. Wifi [10]. Thus, this system
needed to be evaluated to see if it met all the requirements which included: being able to handle up to 10 autonomous machines as well as a few manually driven machines. Another requirement was to utilise Raspberry Pi’s [11] to build a prototype system that may be tested in a simulated environment and to collect data in the field.
1.4
Thesis Outline
The thesis is structured as follows; beginning with a description of the methodology used during
the thesis in Section2 and continuing with background on the emergency stop and safety-related
functions in Section 3. The prototype, both software and hardware components of the
safety-related system is described in detail under Section4 and the method of testing the reliability of different parts of the system is presented in Section5. The results of the tests are presented in
Section6and analysed more thoroughly under Section7, where future improvements are proposed.
2
Method
The research methodology that was used in this thesis is the Systems Development process [12]
introduced by Nunamaker and Chen. This is a versatile method that is well suited for software development. It is divided into stages of development where one stage can lead to any other stage in the process. The first step involves building a conceptual framework. This framework is greatly influenced by the chosen components for the system and their interfaces. A literature study was performed to make sure that the system provides a significant enough contribution to the field. The literature study was expected to provide insight into current industry standards and state of art which directly shaped the design of the system, in addition to redefining the research questions. The next steps are design and implementation of the system which consists of Raspberry Pi‘s [11] communicating with each other wirelessly using long-range radio modems, as well as an experiment in a real-world scenario. The focus of this experiment was to validate the health of the wireless communication by analysing round-trip time, packet loss, jitter, and uptime which then affected the redesign phase of the thesis work. Finally, the system is evaluated, firstly by applying theoretical models, secondly by testing the software in simulation, and thirdly by performing field-tests on both the wireless hardware components and the software functionality. The steps of this thesis
process is shown graphically in Figure 2. The idea behind this method is to build a system and
Construct a Conceptual Framework Develop a System Architecture Analyse and Design the System Build the System Observe and Evaluate the system
Figure 2: Graphical representation of the process of systems development [12].
gain knowledge about the research area in the process. Another motivation to use the Systems Development method is that it allowed for design choices to be made by request of the collaborator, which is Volvo CE in this case.
3
The Emergency Stop Function
Not all systems need an emergency stop, in fact, the standardsindicate as such by defining the
e-stop as acomplementaryprotective measure [4, 13]. The purpose of it is to prevent injuries to persons or things in an emergency situation. Therefore, a risk assessment is used to determine when and where to implement emergency stop functionality in a system.
3.1
Standards for Actuators and Placement
There are strict guidelines regarding the design of e-stop triggers listed under EN ISO 13850:2015 [13] to be clearly identifiable, visible, and accessible to the operator. This is achieved by colouring the actuator in red and using a yellow background. These actuators need to be placed nearby any control station that is able to initiate automatic motion of the system, except in situations where the e-stop would not reduce risk. It is necessary for the emergency stop to be activated using one human action alone, in addition, it must not be possible for the machine to start by resetting the trigger. Furthermore, the actuation needs to induce a mechanical latch, and thus be reset by twisting or pulling the push button. If the risk assessment warrants it, the actuator may need to be reset by a key-pad or by releasing a key. In the event that multiple e-stop buttons have been activated, each actuator must be reset before the target system is allowed to start. Depending on the machine and risks associated with its operation, the stopping process is divided into 3 categories.
• Category 0: Remove power to the machine.
• Category 1: Perform a controlled stop followed by cutting power to the machine. • Category 2: Perform a controlled stop and leave the machine powered on.
Regardless of the choice of category, the machine is required to stop in an ”appropriate manner”, i.e., without causing a hazard. What is appropriate for a system is dependent on the target machine or work-cell. In some cases, it is also important for the e-stop to be guarded against being activated in a hazardous manner. This could cause disruptions in production and even damages to property as well as the machine itself. It is however emphasised that the safeguard should not limit the accessibility of the actuator. It is common for an e-stop to follow the IEC 60947-5-5 [14] standard that enforces additional requirements on emergency stop devices with mechanical latching. These requirements are related to the mechanical and environmental forces that the device needs to be able to withstand, such as exposure to saltwater, and a temperature of negative 40 degrees to 70 degrees positive in dry and humid conditions. It also needs to endure a 113 N force on all three axes as well as a shock test of 15g, an impact test using a 1.6 kg hammer, and a vibration
test where acceleration is up to 50 m/s2. Furthermore, the standard IEC 60204-1 [15] applies
additional requirements if the stop signal is sent without a cable where the control station must be protected from unauthorised use, in addition to requirements on the operation of the machine in question. The stop signal is only allowed to affect the intended machine(s) and each machine needs a separate way of stopping automatically if a fault in the signal is detected or if a valid signal has not been received ”within a specified period of time”. However, the latter has an exception if the machine is performing a pre-programmed action outside of the range of the e-stop signal if and only if it can be asserted that nothing hazardous can occur.
3.2
Wireless Industrial standards
Ideally, a complementary protective measure uses wiring to send the signal that triggers an emer-gency stop. However, this is not always possible, for instance, if the machine is mobile such as in this case, in addition to having a non-deterministic route during production. A number of standards and technologies are being used in industry to solve this problem using wireless communication. There are various wireless technologies built on various standards and they can be divided into long, medium, and short-range communication. Satellite and cellular are examples of long-range, IEEE 802.11 [10] (Wifi), IEEE 802.15.1 [16] (Bluetooth) and 802.15.4 [17] (LR-WPAN) are mostly included in the medium range category, and RFID, as well as infrared signals, are referred to as
being short range. These short-range technologies, in addition to the cellular networks, cannot guarantee coverage on a large site. It is possible for satellite, however, it is not appropriate be-cause of the high latency. The medium range offers a wide range of solutions operating at different frequency ranges. LR-WPAN technologies are most commonly used for sensor-networks, where high data-rate is not necessary and because of the low power usage. A mesh network is built to cover larger areas, but the ever-changing environment of a quarry may make this task too complex and time-consuming in the long run. An alternative that could provide the range of a cellular network and the coverage of Wifi is Digital Professional Mobile Radio (DPMR) [18]. Historically, it has been used for transmission of speech by police and the fire brigades during emergencies. Nowadays, it is used in manufacturing plants, mines, airports, and many other places in the indus-try because of its reliability and low cost to coverage ratio. It offers efficient and flexible two-way communication, that can be customised to fit specific needs and reprogrammed over a wireless link. The operating range of DPMR is 30-1000 MHz which enables high signal penetration but lower data-rates. System ownership is also safeguarded by end-to-end data encryption which is
important for a safety system. A DPMR system must adhere to ETSI EN 300 113-1 [19] which
guides the design, testing, and EMC for transmitters and receivers. It is required to be robust to interference which is the main reason for it being the primary choice in this thesis.
ISO 13849-1 [4] provides aid in determining the degree of reliability for a safety-related control
system by the use of Performance Level (PL), Mean Time to Dangerous Failure (MTTFD), and
Diagnostic Coverage (DCavg). PL defines the average probability of dangerous failure per hour, for the safety function and is divided into five ranges from A-E, where A is the highest average prob-ability. MTTFD is often difficult to measure and ranges from low to high as depicted in Table 1.
DCavgis a representation of how much the communication is monitored and diagnosed to prevent
Reliability MTTFD
(years)
Low 3 - 10
Medium 10 - 30
High 30 - 100
Table 1: This is a recreation of a Table [4, Tab. 4], depicting the endurance of the channel based on its MTTFD.
faults. More specifically, it is the percentage of detectable faults in the safety-related system:
DCavg=
µdd µdd+ µdu
, (1)
where µdd is the amount of detectable dangerous faults and µud is the amount of undetectable
dangerous faults that lead to a loss of the safety function. These parameters can be used as a tool to define the requirements for a safety function using up to two channels of communication. In Figure3 this tool is presented, which depicts levels of performance on the y-axis and architectural
categories on the x-axis. These categories are the resulting basic requirements for the safety
function, increasing with higher category. Following the standard EN ISO 13850:2015 [13] requires
emergency stops to achieve a minimum of PLC and in order to reach this goal the system needs
to adhere to either of the categories 1-3, as can be viewed on the figure. However, category 3 is difficult to achieve because it requires dual channels of communication. The other two categories require that the components are up to standard and the use of well-tried safety principles. The difference is that the level of diagnostic coverage is higher for category 2, in addition to the need for periodic testing of the safety function.
3.3
Wireless interference
This is where the wireless communication becomes relevant as it is less reliable than the con-ventional wiring, especially in harsh radio environments. In a quarry environment, the expected wireless disturbances include non-line-of-sight (NLOS) from piles of gravel, dust steered up by mov-ing parts, as well as high amounts of electromagnetic interference from active machinery. A study
Figure 3: This graph is from [4, Fig. 5] and describes the relationship between categories, DCavg,
MTTFD of each channel and PL. The categories represent the increasing requirements of the
safety-related function, depending on the probability of dangerous failure per hour, and mean time to dangerous failure in years.
was conducted on short-range communication in a quarry by S. Vernersson, E. Kalpaxidou, and D. Rylander [20] where three different wireless technologies - operating at three different frequency bands were evaluated. Packet Reception Ratio (PRR) was used to measure the performance of Zigbee RF (868 MHz), IEEE 802.11g (2.4 GHz), and IEEE 802.11p (5.9 GHz) at different dis-tances and elevation. It was concluded that frequency influenced the reliability the most where the Zigbee RF was the best on average, only losing 0.3% of packets while testing in the lowest part of the quarry. The high amounts of rocks and hills in the quarry was detrimental to the 802-11g system that performed the worst on average with a packet loss of over 70%, with the performance of 802.11p on second place losing 32.2% of all packets. The results are theorised to be caused by the increased signal penetration of the 800 MHz band ignoring most of the obstacles and the 2.4 GHz system having less signal propagation than the 5.9 GHz system. This shows that choosing the correct wireless technology for an e-stop may result in a low or even no requirement of diag-nostic coverage for the communication. However, this comes with an increased need to validate the reliability of the wireless signal by empirical measurements.
3.4
Wireless redundancy
One way of decreasing the probability of system failure is by implementing redundancy in the system in order to avoid single-point-failures. In regards to wireless communication, this may be divided into information and hardware redundancy, where the former relates more to the reliability of transmissions over the network, while the latter also includes sustainability of the system over-all. The international standard IEC 61508-3 [21] contains guidelines on the software-concepts of redundancy that are recommended for a safety-related function. An example of this is to include
error correcting codes such as ARQ (Automatic Repeat Request) [22] and FEC (Forward Error
of acknowledgements sent from the receiver of a message, indicating whether or not a packet was correct. In addition, if the sender does not receive an acknowledgement after a specified period of time, the message is resent. This method relies on a limited round-trip-time and is less appropriate for e.g. satellite applications. FEC instead adds redundant information to the packet enabling the correction of a certain amount of bits depending on the specific scheme. Being able to correct bit-errors caused by noise in the channel is advantageous but comes with the cost of bandwidth. This is due to the general idea behind FEC of adding redundant information to the data thus increasing its size and transmission delay.
A common approach to increase reliability is to introduce redundant hardware components to
a system as emphasised by IEC 61508-2 [24]. This is recommended in all systems with a chance
of single-point-failures, e.g., the master device in a network. Reliability may be increased either by monitoring triggering signals using another hardware component or by two or more compo-nents working in parallel. This is often referred to as standby redundancy and there exist multiple approaches divided into cold, warm, and hot standby depending on how active the redundant component is while being idle, which affects its longevity. Moreover, parallel redundancy schemes, such as dual modular redundancy, are examples of schemes being able to distribute the load over devices. This also requires synchronisation between them where a decision is made on which device that processes each new input. While this would increase robustness and avoid the common mode failure, the devices will have very similar failure rates thus not increasing the sustainability of the system. This could be mended by diversifying the hardware where two components perform similar tasks but with different hardware architectures. In addition, the standby redundancy schemes in-crease longevity depending on the demands of switch-over rate and MTTF. A cold standby system will have a dormant component which introduces a long delay during the switch whereas a hot standby component may have a switch-over rate competing with parallel systems. This, however, comes with reduced MTTF because the hot standby component, while not processing the same load as the main component, still needs to be powered on and actively monitor the system. The hot standby solution is common for a lot of routing protocols used in wireless networks such as the
VRRP (Virtual Router Redundancy Protocol) [25]. It is a standardised protocol described in RFC
3768 by R. M. Hinden and the IETF (Internet Engineering Task Force) that enables alternative first hop routers if the master would become unavailable. It increases availability and lowers the chance of a single-point-of-failure by dynamically assigning one of the VRRP routers to forward the message. Typically, two redundant routers are used in this protocol where one of the routing paths is preferred to reduce the chance of both routers being equally prioritised thus causing duplicate packets to be transmitted.
3.5
Reliability Analysis and Standards
To simplify the problem when performing a component-wise reliability analysis, each component is considered to be either in a failed or a functional state. The reliability of the system is then defined as the probability that it will successfully perform a predefined task during a specified period of time. For a coherent system, it is then vital to compute the probability that an individual component is functional during this period if that component will cause the system to fail. The reliability of the system can then be defined based on the probability that the respective devices remain functional over a period of time most commonly referred to as mission-time. For each device, the reliability is calculated as defined in [26] by A. Myers using the exponential distribution:
R(γ, t) = e−γt, (2)
where γ is the rate of failure or M T T F1 and t is the operational time needed for a successful mission. Moreover, the reliability of N devices connected in series may be computed as:
Rs=
N Y
i=1
Ri, (3)
where Riis the individual reliability of each device. When considering more complex systems using N identical components, connected in parallel for redundancy, the reliability function is calculated
as: Rp= 1 − N Y i=1 (1 − Ri). (4)
Performing a system-wide reliability analysis is not a trivial task because it requires knowledge
about the MTTF of each component in the system. In the work by B. C¸ ekyay and S. ¨Ozekici
[27], the MTTF was derived by modelling it as an optimisation problem. The reliability or the
performance of the system is optimised as a function of each components individual failure rate. However, this failure rate is not always known and measuring it may prove costly. Assuming the system consists of two identical devices and an imperfect switch, S. Fujii and H. Sandoh [28] presented a method for assessing the reliability of the system using Bayes inference. Using this method, where the failure rates of each independent component were considered unknown, the model could predict the time of the first failure of a component.
The standard ISO 13849-1 [4] contains guidelines on the estimation of MTTF for pneumatic,
mechanical and electromechanical components. The method is based on the number of operations
done before a tenth of the manufactured components fail B10d and the number of operations
performed during the course of a year nop where:
M T T F = B10d
0.1 ∗ nop
. (5)
The amount of diagnostic coverage needed for a safety-related function is often hard to quantify
as well. This type of analysis is known as FMEA (Failure Mode and Effects Analysis) [29] when
performed on individual components in the system. It involves constructing a worksheet on the item, its potential failure mode, cause, severity, and the probability of it occurring. An alternative is the FTA (Fault Tree Analysis) [30] method which is used in the aerospace industry. It maps the relationship between different faults by constructing a diagram with the undesired outcome at the top of the tree. The diagram most commonly consists of logic gates where the inputs are events that cause the undesired outcome or other failures. Using this diagram, the system can be analysed to find common cause and common mode failures. A common cause failure represents an event that causes several components to fail simultaneously while common mode failure indicates that different components failed in the same exact way, causing an identical fault. After constructing a list of faults for the system they can be divided into safe, detectable, and undetectable dangerous failures. This enables the quantification of the amount of diagnostic coverage needed which is required to handle all detectable dangerous faults in the system. These methods were used by
Suwoong Lee and Yoji Yamada [31] during the risk assessment of a power assist system. Here,
they used FTA to trace the failures and FMEA to find potential safety measures in order to prevent hazards.
4
System Specification
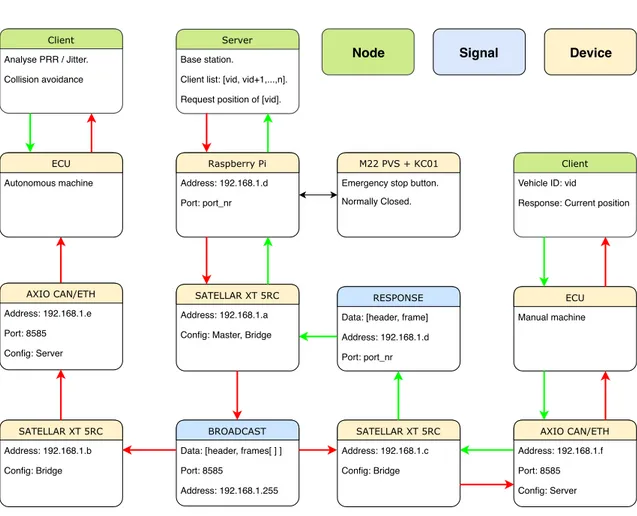
The system is comprised of a number of different hardware components communicating using a shared framework that was developed for this thesis. All devices, nodes, messages, and their
relation to each other are presented in Figure 4. The server of the safety system runs on a
Raspberry Pi and the clients run on dedicated ECUs (Electronic Control Unit) in each machine. The purpose of this system is to make the positions of all manually driven machines known to the autonomous machines, in order to avoid collisions and prevent hazardous situations. In addition, a complementary protective measure was implemented where all the autonomous machines can be stopped by pressing on a mushroom-style pushbutton. The pushbutton is located in a control room and is used to enable the autonomous machines to run autonomously by twisting the button. This functionality is protected by a key to prevent unauthorised access to the system, however, it is always possible to stop the machines from the control room. It is designed to be used several times a day, to enable the machines to run autonomously as well as to disable them at the end of a cycle of operation.
The autonomous machines need to be connected to the safety-related wireless system in order
to remain active. The server enables this connection by broadcasting commands regularly to
all machines and the status of the wireless link is diagnosed on the client-side, by utilising the command as a heartbeat. The motivation for this is to avoid losing the safety-related function of collision avoidance, by stopping the machines on an individual basis if the wireless link becomes unstable or is lost entirely.
Raspberry Pi
Address: 192.168.1.d Port: port_nr
M22 PVS + KC01
Emergency stop button. Normally Closed.
Server
Base station.
Client list: [vid, vid+1,...,n]. Request position of [vid].
Client
Vehicle ID: vid
Response: Current position
AXIO CAN/ETH Address: 192.168.1.e Port: 8585 Config: Server SATELLAR XT 5RC Address: 192.168.1.b Config: Bridge ECU Autonomous machine BROADCAST
Data: [header, frames[ ] ] Port: 8585 Address: 192.168.1.255 Client Analyse PRR / Jitter. Collision avoidance RESPONSE
Data: [header, frame] Address: 192.168.1.d Port: port_nr AXIO CAN/ETH Address: 192.168.1.f Port: 8585 Config: Server ECU Manual machine SATELLAR XT 5RC Address: 192.168.1.c Config: Bridge SATELLAR XT 5RC Address: 192.168.1.a Config: Master, Bridge
Node Signal Device
Safety System Overview
4.1
Software
There are three types of nodes running in the network: the master, the autonomous machine client,
and the manual machine client as shown in Figure5. There is only one master active at one time
Base Station Poll Manual Client Autonomous Client Response e-stop activated? Wireless Link Active? Wireless Link Active? Collision Avoidance Command
Figure 5: The graphical representation of the nodes that are active in the system. The poll to the manual client and the command sent to the autonomous client is a part of the same broadcasted message.
but several clients can be part of the network up to a certain limit. This limit is determined by the timing constraints of polling all manual machines that are active in the site. A large part of the e-stop functionality is decentralised, where each autonomous machine determines whether to emergency stop by analysing the network health and positions of the manual machines. All
nodes were written in C++ using ROS [32] (Robot Operating System) to decrease development
time, ease visualisation and logging of data, as well as to enable the control of nodes over Ethernet by utilising ROS services. A service in ROS is a function that can be called by a user in the command-line or by other nodes in the network. These acted as push-buttons for the activation and stopping of machines during development.
4.1.1 Base-Station
The base station is the master of the system and whose job is to poll each manually driven machine for its position and broadcast this information to all autonomous machines. All messages are broadcasted to all other devices in the network at all times indicated by the red arrow in
Figure4. The messages contain a minimum of one CAN frame with the current command to all
autonomous machines, in addition to other frames containing the positions of each manual machine
as illustrated in Figure8as Master Broadcast and Machine Response respectively. The command
consists of a timestamp, a control signal, and a response ID (identification) number. The master determines which device that gets to transmit its position back by setting the ID number in the broadcasted message. If a machine with the wrong ID responds to the request, the server moves to an error state and triggers the emergency stop. In this state, the server needs to be reset manually by an operator using a specific booting sequence. While resetting the server is necessary, it does not restart the autonomous machines that were emergency stopped by this error.
The IP addresses of the devices are arbitrary and unknown before the first broadcast. Thus, the system is easily reconfigured, only needing to edit the number of manual machines expected to be active in the network. The general cycle of the base-station is to iterate over all known ID’s of the manual machines, using this ID to poll and thus updating a position, while broadcasting all previously known positions on the network. This runs at a rate of 5 Hz, giving the manual machine with the correct ID 200 − T x ms, where Tx is the transmission time of the broadcast, to respond with an updated position. The server keeps a list of the positions of the manual machines in addition to whether they are active on the site or not. The position is included in the broadcast to the autonomous machines together with a timestamp that is related to when the position was received. However, it is only included if the manual machine in question indicates that it is actively working on the site through its message response.
4.1.2 Autonomous Machine Client
This node that runs on an ECU in the autonomous machine is a silent listener on the network. The purpose of this node is to avoid colliding with the manual machines working in close proximity, in addition to stopping safely when prompted. This is accomplished by listening for broadcasted messages containing commands regarding if autonomous driving is permitted and the status of the emergency stop. The health of the network connectivity is determined by analysing the time deviation, jitter and PRR, where the time deviation is computed using the timestamp of the packet. The jitter is computed as:
Ji= |ET xi− ET xi−1|, (6)
where ET xi is the value of the estimated transmission time at time-step i, determined by the
periodicity of the task. The jitter is computed if and only if a packet was received in the previous time-step i − 1 because the transmission of data is in real-time. In addition, by synchronising the local time based on the timestamp as described in Figure6, it is possible to estimate the frequency of the packets and compare this value to the expected frequency in order to detect dropped frames. This is possible by setting a baseline based on the timestamp of the first packet that arrives. Next,
T0 Tx T1 Period Timer Deviation Baseline Offset Updated Baseline Estimated Arrival Timestamp 0 Timestamp 1
Figure 6: This image describes the relations between the different variables used in the clock synchronisation algorithm used to estimate the frequency of the received packets.
a timer with a cyclic rate of 200 Hz is used to measure the time until the next packet arrives. The updated local time may now be compared to the next timestamp in order to measure the error of the current baseline. This, in turn, provides an opportunity to update the baseline based on the deviation between the estimated arrival time and our current local time as:
Baselinet= Baselinet−1+ deviation ∗ α, (7)
where α is a constant and α ∈ (0, 1]. The time-deviation is also used to check if the packet has arrived within the expected time-frame thus being valid. This helps to filter out duplicate messages caused by scattering of the wireless signal. By synchronising the local time to the server time, the precision of the jitter measurements increases as well as the ability to detect when a packet has been missed. This information is used to compute the PRR over a period T.
A number of conditions are used in the safety algorithm to assess whether the machine is permitted to move. The most important indicator used is the PRR of the system where the ratio cannot be allowed to fall below a certain limit LCL (lower control limit) as displayed in Figure7. In addition to this, the system may be permitted a maximum number of consecutively lost packets before being considered dangerous. If either condition triggers the e-stop, the machine cannot be restarted manually until the PRR reaches the upper limit UCL (upper control limit).
LCL UCL STOP PRR Time RESET 0 1
Figure 7: This is a graph showcasing how Packet Reception Ratio of the system is used to stop and reset the machine. The machine is stopped when the PRR moves under the lower control limit LCL and not permitted to be restarted before the ratio moves above the upper control limit UCL.
The wireless link is regarded as unstable based on the following criteria: • No messages have been received for a duration of one second.
• Less than half of the messages have been received over a period of 4 seconds.
• The current stopping distance is longer than the minimum possible distance to the human-operated machine.
The collision avoidance is done by comparing the position of the manual machines with its own, in addition to the stopping distance based on current speed. A radius around the manual machine based on the uncertainty of its position is computed. This uncertainty increases with the time-stamp (indicating when the position was last updated) that is provided in the CAN frame and contains the position. In addition, a radius around the autonomous machine is computed with the length of the current stopping distance padded by the average response time of the wireless communication. The autonomous machines are able to detect a dangerous situation by using these two circles. This is done by checking if the two circles intersect, indicating that the current stopping distance of the machine is longer than the shortest possible distance to the manually driven machine. However, the manually operated machine is assumed to be inactive if the received packet does not contain information on its current position.
4.1.3 Manual Machine Client
This node listens to the broadcasted messages and responds with the current position of the human-operated machine if the response ID of the message matches its own. The machine updates its current position by utilising a GPS and transmits it over a CAN bus to the ECU. This information
is then transmitted as a response to the server as shown by the green arrows in Figure 4. The
driver has the option to be a part of the safety system using a switch giving the person a more flexible role. This is needed because of the many different tasks the operator of the human-driven machine performs that are not directly impacting the autonomous machines. This, in turn, puts the responsibility on the operator to make sure that the system is active while working in an area where the autonomous vehicles are present. Similarly to the client of the autonomous machines, the health of the network connectivity is monitored by this node as well. The driver is warned using a LED if its position is old or if the connection is unstable enough to warrant caution.
4.1.4 Axiomatic Framework
Because the ECU’s are unable to receive messages over Ethernet, a CAN/ETH converter is used that comes with its own message protocol. A C++ framework was built around this protocol to make the device easier to use for communication purposes. The core functionality of the framework
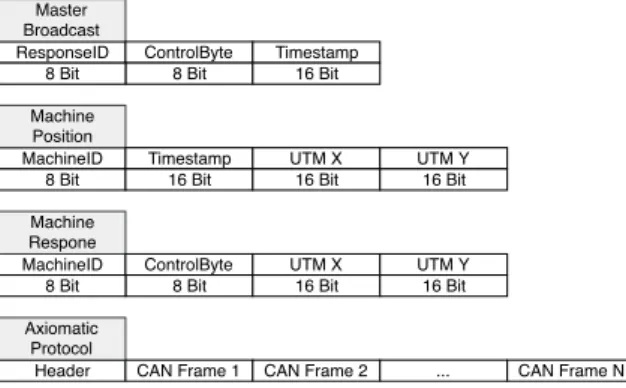
is to parse CAN database files, process CAN data bytes/bits using the database, as well as building the Ethernet message according to the Axiomatic guidelines. The message consists of a maximum
ResponseID Master Broadcast ControlByte 8 Bit Timestamp 16 Bit MachineID Machine Respone
ControlByte UTM X UTM Y
MachineID Machine Position
Timestamp UTM X UTM Y
8 Bit
8 Bit 8 Bit
8 Bit
16 Bit 16 Bit
16 Bit 16 Bit 16 Bit
Header CAN Frame 1 CAN Frame 2 ... CAN Frame N
Axiomatic Protocol
Figure 8: This image describes the structure of the CAN message used in the system as well as how they are used in the Axiomatic protocol. The protocol is simplified for a more clear illustration. of 256 Bytes with 11 Bytes dedicated to the header, while the other 245 Bytes may be filled with
multiple CAN frames as shown on Figure8 or other information for network diagnostic purposes.
There are three CAN messages that are currently defined for the system, one for the e-stop related commands and two for the position of the manually driven machine. This is to separate the broadcasted update of positions done by the server and the response by the manual machine to update its individual position. The Master Broadcast message is used to as a heartbeat in the safety system in addition to sending commands to the autonomous machines using the control byte. It is also used to poll for the position of a manually driven machine using the Response ID which is received in the form of the Machine Response message. The information from the response is extracted and forms the Machine Position message that is sent along with the Master Broadcast message.
4.2
Hardware
To communicate over the air, Satel XPRS [9] radio modems are used on both the mobile clients and the base station. Gainflex 4 dB 50 ohm 440-470 MHz antennas from Satel were used to increase the gain and BPF 70/3 [33] band-pass-filters were installed to reduce noise. On the mobile clients, two antennas were installed and shared using an RF power-splitter. On the wheel-loader, the antennas were placed circa 5m apart horizontally for spatial diversity which is around 5 times the
recommended distance of λ/2 > [34], where λ is the wavelength of the antenna. The antennas
were also tilted away from each-other roughly 15 degrees for the sake of angular diversity. For the antennas on the automated vehicle, only spatial diversity is used where the antennas were placed approximately 2m apart in addition to being shielded from each-other by the machine’s metallic body. The EIRP (Effective Isotropic Radiated Power) can be calculated as:
EIRP = P owerT x+ GainT x− cableloss − insertionloss = 27 + 4 − 0.367 − 1.4 = 29.233dBm, (8)
where the output power of 500 mW is equivalent to 27 dBm, the gain of the antenna is 4 dBm, the cable loss of a RG58 coaxial cable is approximately 36.7 dBm per 100m giving in this case, cableloss = 36.7∗1100 , and lastly the insertionloss caused by the band-pass-filter BPF 70/3 of 1.4 dBm. The messages are sent using the UDP protocol over Ethernet with a speed of 30.2 kbps. Since the ECU’s on the client side can only communicate by a CAN interface a device is used to convert Ethernet messages into CAN frames called an Axiomatic CAN/ETH converter as shown in Figure
4.
The base station, demonstrated in Figure9, consisting of a RPi (Raspberry Pi), an emergency
stop actuator, an Ethernet cable, a micro USB-B cable for the RPi power supply, is mounted in a metal casing certified up to IP54. A hole was drilled on top of the case to leave room for the emergency stop mushroom style pushbutton and two holes on the side of the case for the Ethernet and micro USB-B cables. For the sake of modularity, there is room available to increase the number of RPi’s in the future.
Figure 9: The base-station for the safety-related function equipped with a emergency stop push-button [35] and a Raspberry Pi [11].
4.2.1 Emergency Stop Actuator
The chosen actuator for the e-stop is a red mushroom type pushbutton Eaton m22-PVS [36], an
m22-kc01 contact block [37], and a yellow and black IP67, 69K certified housing. It adheres to
IEC 60947-5-5 [14] which means that it follows the aforementioned ISO 13850 [13] in addition
to regulations on the electrical and mechanical requirements. The contact block contains wiring terminals and is normally closed during operation thus letting the signal pass through the wire. The e-stop is triggered by a single action of pushing the button which presses down onto the contact block thus breaking the connection of the signal and latches in an opened state. To reset the e-stop a key needs to be turned which unlatches the device. This safety measure is required for wireless e-stop systems to prevent unauthorised access. The circuit is simple where a 3.3 V source from the RPi is connected to the contact block as displayed on Figure10, using a 1K resistor to protect the input pin from being damaged, and a 10K resistor to ensure that a small amount of current is drawn by the circuit. The MTTF of this component can be estimated based on the information
NC
1K
10K
3.3V
GPIO IN
Figure 10: This image describes the circuit connecting the Raspberry Pi to the contact block contained in the housing of the emergency stop pushbutton.
Since the pushbutton is estimated to be used up to ten times a day, where the total number of
uses during a full year is at most 2200. The value of MTTF can then be computed using Eq. 5to
be 0.1∗22002e6 = 909 years.
4.2.2 Radio Modem - SATELLAR XT 5RC QAM
The SATELLAR XT 5RC QAM [9] is an IP radio router capable of transmitting a signalover
a distance of tens of kilometres with direct LOS (Line-Of-Sight). It may function either as a
router or a bridge in a network and it adheres to ITSE EN 300 113-1 [19]. The modem utilises
a central processing unit to provide routing functionality and it can operate in between 400-445 MHz with an output power of 0.1-5 W as well as a specified data-rate of up to 121 kbps. This frequency band is chosen to ensure coverage is maintained from the increase in range compared to a 2.4 GHz system. An alternative would be working in the 900 Mhz band. However, this is not possible since a coexisting, high output power system used for teleoperation would cause too much interference. The main advantage of this router is its flexibility where the router can be reconfigured over-the-air or through Ethernet and serial interfaces. In addition, it provides the heightened level of security that is valued for applications in industry such as data encryption
according to the Advanced Encryption Standard [38]. The modem is also capable of VRRP which
enables the implementation of hardware redundancy in the system. For the purpose of this thesis, the modem has been configured to produce an output power of 500 mW on the 439.75 MHz band with a 25 kHz channel width. It is configured to use 4QAM modulation which enables a data speed of 30.25 kbps. This component is used as a router in the base-station and as a bridge in the mobile machines in the network. The base-station is prioritised to communicate first and a handshaking algorithm is used to avoid wireless collisions.
4.2.3 Axiomatic CAN/ETH Converter
The CAN to Ethernet converter [39] from Axiomatic is a simple data converter that can receive
an Ethernet message, e.g., IEEE 802.3, TCP, UDP, etc. and transmit the data to a CAN bus. It can also receive a CAN message with standard or extended CAN Id, in addition to a maximum of 8 data-bytes, and transmit it over Ethernet. The device is configured to use UDP and act as a server, thus idly waiting for a message to get the correct address and port of the base station. To ensure connectivity over Ethernet, the converter sends heartbeat messages which include network information. For the purpose of this thesis work, these types of messages needed to be filtered from entering the network in order to prevent it from causing any delays in communication.
4.2.4 Raspberry Pi 3 Model B
For testing purposes, the server runs on a Raspberry Pi [11] dedicated to controlling the commu-nication in the network. It is a single-board computer with an ARM-compatible processor that supports many Linux-based, in addition to a few non-Linux-based operating systems. The main advantage is its flexibility and ease of use, low cost, as well as the multitude of GPIO and pe-ripherals available. For this thesis, the Raspberry Pi 3 Model B is used that has a quad-core 1.2
GHz 64bit CPU and needs a micro SD card to store the operating system Raspbian [40]. There
are currently no numbers on the failure rate of the Raspberry Pi, however, an MTTFDof 10 years
may be used when the exact figure is unknown [4].
The RPi is configured to start its respective application at boot, either as a base-station, autonomous client, or a manual vehicle client. This is made possible by a ROS package called robot upstart [41], that enables the creation of a Linux service based on a ROS launch-file. How-ever, the package does not work on the RPi as is but instead requires a few modifications to the filesystem.
5
Experimental Setup
During this thesis work, experiments were used to validate the functionality of hardware and software, thus two main tests were conducted. The first test is on the wireless hardware that is proposed for the system. The purpose of this is to see if the proposed system meets the re-quirements, as well as to gain knowledge on the types of wireless interference that affects the 400 MHz band. This was done separately for a wheel-loader and a small rigid hauler to compare the radio properties of the machines. Another key factor to be tested was the modulation type of the radio modem. In this experiment, 4QAM and 16QAM (Quadrature Amplitude Modulation) were compared in regards to stability and to find the limitations of the radio system. The system was originally designed using 4QAM, but the timing constraints could possibly be increased if 16QAM is used. Thus, when testing with 4QAM enabled, packets are sent at a rate of 5 Hz and during the tests where 16QAM is enabled, packets are sent at a rate of 10 Hz, because the theoretical data-rate is twice that of the 4QAM configuration. These tests were conducted at a quarry located in Sweden. The results of the preliminary tests affected the design of the emergency stop system, which was validated in the final software test.
5.1
Hardware Specification
The system is set up with a SATELLAR XT 5RC QAM Radio Modem [9] on both the base station
and mobile machine. To amplify the wireless signal, a Gainflex 1/2 Wave Antenna YA103 was chosen because of its operating frequency band of 440-470 MHz and limit of 20W output power.
The antenna is connected to the radio modem using an RG58 coaxial cable and a BPF 70/3 [33]
band-pass filter, in order to provide more precise filtering.
The tests were conducted using a modified version of the software developed during this thesis work, where PRR was logged on the server-side as well for testing purposes. One of the radio antennas was placed on the roof of a service vehicle and two antennas were placed on the prototype hauler, connected to an RF-splitter. The test was comprised of a series of measurements on the round-trip-time and packet loss of the signal, depending on the modulation type used by the radio modem. The antenna on the roof is static and acts as a master in the network, while the machine is teleoperated and acts as a client. For the purpose of debugging a desktop computer was used as
a base station to send 64B messages to the Raspberry Pi [11] that was installed in the machine.
The RPi logged PRR and responded to the messages it received. This log was compared with the PRR on the desktop to analyse where the packets were lost.
5.2
Testing Environment
It is vital to investigate how the system functions in ideal conditions as well as in its intended environment, thus the hardware specific test begun in a place with good LOS at the top of the quarry. The machine was then driven along a predefined path containing a few NLOS (Non-Line-Of-Sight) segments. The path begins at the top of the quarry, moves down a ramp into the pit where it circles a large pile of rock which impedes LOS. The distance between the base station and machine varies between 50-400m and is considered negligible since the maximum range of the radio modem is several kilometres with LOS. A number of signal disturbing elements were active in the area such as dump-trucks, crushers, wheel-loaders, rigid haulers, in addition to the sand and piles of aggregate that is distributed by these machines. The entire area is also surrounded by hills of rock that may cause the signal to propagate. The area was not quarantined, thus the tests have been subjected to interference caused by the daily operation in the vicinity.
5.3
Software Testing
A system was programmed to provide diagnostic coverage of the wireless technology, in addition
to providing the means of stopping a machine remotely if an emergency occurs. The system
needed to adhere to the standards and regulations discussed in Section3 and is expected to stop
the machine every time the e-stop push button is pressed. A number of tests were conducted to validate the functionality of this system at rest, where monitors and other signals were used to visually inspect the results. The first and most important test is pressing the emergency stop
button. When pressed, the base station sends a signal to the autonomous client that indicates a successful transmission with a LED. At this point the status of the client should indicate an e-stop, else the test has failed. The client will still have power available to all systems, but cannot be activated until the e-stop has been reset, by twisting the push button. This should put the client into a manual control state where the operator may reactivate it, using a command. The second test involved the fail-safe that should be built into the diagnostic coverage. This fail-safe should initiate an emergency stop if too many packages are lost in the wireless communication, indicating that the signal is lost or too unstable. This function was manually triggered, by commanding the base-station to drop packets using a service in ROS.
Furthermore, the estimated jitter of the system needed to be validated which was performed by simulating the transmission times between the base-station and client using randomisation. As illustrated in figure 6, the initial baseline contains an error based on the jitter of the first
transmission which needs to be minimised. If the clock synchronisation algorithm is working
correctly, the estimated jitter on the client side will improve over time and trace the actual jitter of the transmission. However, it is not currently possible to extract the actual transfer time on the radio-system. This was the motivation for only testing the clock synchronisation algorithm using simulated delays in the transmission.
Another important aspect of the system to be tested was the collision avoidance algorithm. The most significant factor of the algorithm is to stop the machine if it is moving too fast near or around the wheel-loader. It is also intended to stop if the age of the position of manually-driven machine is too old and the client is in close enough proximity to warrant caution. A less safety-critical but equally important test is to be able to approach the wheel-loader at a slow pace without falsely triggering the e-stop, since the two types of machines will work closely during operation. All parts of the software were tested in a simulated environment first to ensure that the algorithm works in an ideal setting. The collision avoidance algorithm was the only part of the system that was not tested in the field.
6
Results
This section presents the gathered data from testing the hardware used for communication in the context of the goals as well as the software regarding functionality and diagnostic coverage.
6.1
Hardware test
A number of tests were performed at a quarry to evaluate the radio system chosen for this thesis. The first controlled parameter was the machine type, either rigid hauler or wheel-loader, where the shapes of these differ greatly in addition to the placements of the antennas. The second parameter was the level of QAM used, which affects the bandwidth and stability of the communication
significantly. Figures11a and 11b show the resulting PRR and RTT when communicating using
the wheel-loader as client, while Figures12aand12bpresent the result of using the rigid hauler as a client. The PRR is calculated based on the number of packets received within a sliding window spanning 4 seconds. This is one of the parameters used for the algorithm that monitors the health of the wireless link.
0 2000 4000 6000 8000 0 20 40 60 80 100 Samples time-step: 200ms %
Packet Reception Ratio
(a) Each data-point represents the PRR of a sliding window spanning the last 20 packets.
0 2000 4000 6000 8000 0 50 100 150 200 Samples time-step: 200ms ms Round-trip-time Raw data Moving average (WS: 10) (b)
Figure 11: (a) Packet Reception Ratio and (b) Round-trip-time when the wheel-loader acts as receiver and 4QAM is used. 7662 packets were sent in total.
0 2000 4000 6000 8000 10000 12000 14000 0 20 40 60 80 100 Samples time-step: 200ms %
Packet Reception Ratio
(a) Each data-point represents the PRR of a sliding window spanning the last 20 packets.
0 2000 4000 6000 8000 10000 12000 14000 0 50 100 150 200 Samples time-step: 200ms ms Round-trip-time Raw data Moving average (WS: 10) (b)
Figure 12: (a) Packet Reception Ratio and (b) Round-trip-time when the rigid hauler acts as receiver and 4QAM is used. 12007 packets were sent in total.
Furthermore, the tests were redone for both machines using 16QAM to increase bandwidth, where
14b show the resulting PRR and RTT when the rigid hauler acts as client with 16QAM. An interesting parameter to investigate as well is the number of packets lost consecutively and the respective frequency of these errors which is presented in Figure15.
A final summary of the tests regarding the total PRR and information about the RTT can be viewed in Table2. 0 2000 4000 6000 8000 10000 12000 14000 0 20 40 60 80 100 Samples time-step: 100ms %
Packet Reception Ratio
(a) Each data-point represents the PRR of a sliding window spanning the last 20 packets.
0 2000 4000 6000 8000 10000 12000 0 20 40 60 80 100 Samples time-step: 100ms ms Round-trip-time Raw data Moving average (WS: 10) (b)
Figure 13: (a) Packet Reception Ratio and (b) Round-trip-time when the wheel-loader acts as receiver and 16QAM is used. 11867 packets were sent in total.
0 2000 4000 6000 8000 0 20 40 60 80 100 Samples time-step: 100ms %
Packet Reception Ratio
(a) Each data-point represents the PRR of a sliding window spanning the last 20 packets.
0 2000 4000 6000 8000 0 20 40 60 80 100 Samples time-step: 100ms ms Round-trip-time Raw data Moving average (WS: 10) (b)
Figure 14: (a) Packet Reception Ratio and (b) Round-trip-time when the rigid hauler acts as receiver and 16QAM is used. 7076 packets were sent in total.
6.2
Software Tests
Before the field-test, the algorithm was tested by simulation on a desktop computer. The transfer time of the message was randomly distributed where T x ∈ (50, 100] ms resulting in an average transmission of approximately 75 ms. The purpose of this simulation was to validate the clock synchronisation performed on the client-side based on the received timestamps. The results of this
test is presented in Figures16 and 17 where the estimated jitter is expected to trace the actual
jitter, in addition, the error should converge towards zero. The second set of tests were performed indoors with the machine at rest to validate that the algorithm to diagnose the wireless link worked as expected. A laptop computer was used as a base-station and two LED’s were installed on the client, one indicating a received packet and the other showed the status of the wireless link. Missed packets were manually triggered on the end of the base-station using a service in ROS
0 2 4 6 8 10 12 0 100 200 300 400 500 Consecutive Errors Number of Occurences Wheel-Loader 4QAM Rigid Hauler 4QAM Wheel-Loader 16QAM Rigid Hauler 16QAM
Figure 15: A graph representing the frequency of a certain amount of consecutively missed packets. Table 2: Summary of radio-tests
Machine & Modulation PRR(%) Avg. RTT Min RTT Max RTT Tot. Packets
wheel-loader 4QAM 98.52 107 96 168 7662
rigid hauler 4QAM 99.57 106 96 194 12007
wheel-loader 16QAM 95.2 77 65 100 11867
rigid hauler 16QAM 98.65 76 66 98 7076
which prompted the master to skip a number of transmissions. Firstly, five packets were skipped consecutively providing a delay of more than one second on the end of the client which should trigger the e-stop. This test was successful and indicated by shutting down a LED connected to the RPi. In addition, the link is expected to recover when the PRR reaches the upper control limit which was indicated by lighting the LED again. The status of the wireless link versus the PRR of
the test is presented in Figure18 to corroborate the results. Next, the master was prompted to
skip every other packet providing the client with a lowered PRR, however, above the lower control limit. This did not trigger the e-stop and the results were validated by analysing the client’s log. The jitter calculations were sampled over a period of 8 minutes during normal operation as shown in Figure19. This was to validate that the algorithm for synchronising the clock using the timestamp of the master was working as expected.
6.3
Performance level ISO13849-1
After developing an emergency stop system it is vital to evaluate its performance in relation to the requirements set by the local and international standards, in addition to the requirements set by Volvo CE and the company supervisor. This section compares the system, as is, with the standards and requirements, using the results of the experiments to motivate its performance level based on the tools made available in ISO13849-1 [4]. First and foremost, the MTTFD is difficult
to estimate based on data-sheets alone. In Table3 the collected MTTFD of each component is
presented1, derived from data-sheets and product information. One of the more robust components
regarding MTTFD is the Satellar Radio Modem XT 5RC QAM [9] with 60 years and the weakest
is considered the Raspberry Pi 3 model B [11] with an MTTFD of 10 years. For determining the
reliability of the system, the components can be considered as connected in series, where if one fails, all fail. From Eq. (2), using a mission time of 20 years which is assumed for all machinery based on ISO 13849-1 [4], the reliability of the Raspberry Pi can be calculated to be 0.135. Using
1The MTTF
Dof these components are based on their respective product information and was not tested during
0 50 100 150 200 250 300 0 5 10 15 20 25 30 35 Samples time-step: 200ms ms
Estimated versus Actual Jitter
Estimated Jitter Actual Jitter
Figure 16: The estimated jitter plotted along the actual jitter for a visual comparison.
0 50 100 150 200 250 300 0 5 10 15 20 Samples time-step: 200ms ms Error of Jitter Raw Moving Average (WS: 10)
Figure 17: Error of the estimated jitter over time during the simulated test.
the same equation, the reliability function for the radio modem may be calculated as 0.716 and from Eq. (3), a final reliability of the base-station is 0.0533. This indicates that the probability
of avoiding a dangerous failure for the duration of 20 years is 5.33%. The MTTFD of the entire
channel can be derived from Eq. (2) as:
M T T FD= −
t ln(Rt)
= 6.824 years, (9)
which is low for a safety-related system as defined in Table1. This is due to the limited knowledge
on the actual MTTFD of the RPi being the weak link in the equation.
Analysing the current state of the system in relation to PL and using Figure 3, it can be
extracted that with a lower Mean Time to Dangerous Failure, the performance level can be B-C
depending on the average diagnostic coverage. Considering that the DCavg of the overall system
Hardware Component MTTFD
(years)
Satellar XT 5RC QAM 60
Raspberry Pi Model B 10
Axiomatic CAN/ETH converter 50
Eaton m22-PVS 909
BPF 70/30 114
0 200 400 600 800 0 0.25 0.5 0.75 0.951 Samples time-step: 200ms Ratio Link Status PRR
Figure 18: The Packet Reception Ratio plotted alongside the status of the wireless link. The red x marks the sample where the link status flips to zero and the green x indicates where the link moves over the UCL. As the graph shows, a PRR of 0.75 is equivalent to 5 consecutively lost messages.
0 500 1000 1500 2000 2500 0 2 4 6 8 Samples time-step: 200ms ms
Transmission Jitter at rest
Figure 19: Transmission Jitter while testing the Satel radio modem indoors with the machine at rest.
is high, it may be eligible for PLC if it adheres to the requirements of category 3. This, in turn, requires that the system follows the guidelines of the categories B-2 as well. In its current state, the components in the system are built to the relevant standards in relation to category B and with ”well-tried safety principles” according to category 1. However, if the RPi is to be considered ”well tested” as referred to by category 1 may be disputed in an industrial setting even though it is used in many general applications all over the world. Periodic testing on the other hand, as referenced by category 2 is built into the system which is intended to be used up to ten times per day. The system cannot currently be approved under category 3 since it requires a dual channel system in addition to the avoidance of a single fault causing loss of the safety function. This results in a performance level B which is not sufficient for a safety-related function that needs to be at least
PLC. To achieve this level of performance with the Raspberry Pi, hardware redundancy needs
to be implemented into the system. In its current state, the lifespan of the safety-related system cannot be guaranteed to reach the required mission-time of 20 years.
![Figure 2: Graphical representation of the process of systems development [12].](https://thumb-eu.123doks.com/thumbv2/5dokorg/4440514.107535/7.892.392.508.465.969/figure-graphical-representation-process-systems-development.webp)
![Table 1: This is a recreation of a Table [4, Tab. 4], depicting the endurance of the channel based on its MTTF D .](https://thumb-eu.123doks.com/thumbv2/5dokorg/4440514.107535/9.892.367.527.559.654/table-recreation-table-depicting-endurance-channel-based-mttf.webp)
![Figure 3: This graph is from [4, Fig. 5] and describes the relationship between categories, DCavg, MTTF D of each channel and PL](https://thumb-eu.123doks.com/thumbv2/5dokorg/4440514.107535/10.892.195.688.123.479/figure-graph-describes-relationship-categories-dcavg-mttf-channel.webp)


![Figure 9: The base-station for the safety-related function equipped with a emergency stop push- push-button [35] and a Raspberry Pi [11].](https://thumb-eu.123doks.com/thumbv2/5dokorg/4440514.107535/18.892.221.672.125.531/figure-station-safety-related-function-equipped-emergency-raspberry.webp)
