Assessment of Ixia BreakingPoint
Virtual Edition: Evolved Packet
Gateway
Adidamu Naga Shruti
Faculty of Computing
Blekinge Institute of Technology SE–371 79 Karlskrona, Sweden
Engineering with emphasis on Telecommunication Systems. The thesis is equivalent to 20 weeks of full time studies.
Contact Information: Author:
Adidamu Naga Shruti
E-mail: shruti.adidamu@gmail.com
University Advisor: Prof. Dr. Kurt Tutshku
Department of Computer Science and En-gineering (DIDD)
External Advisors:
Rohit Guliani and Adam Bengtsson Ericsson AB, Gothenburg
Faculty of Computing Internet : www.bth.se Blekinge Institute of Technology Phone : +46 455 38 50 00 SE–371 79 Karlskrona, Sweden Fax : +46 455 38 50 57
Context: Internet service quality today is heavily challenged by the exponential increase in the number of mobile users. 5G evolution aims at providing faster internet services and meet new use cases such as Software Defined Cloud Networks and Internet of Things Networks. Core Network is one important element of 5G network, which along with LTE constitutes Evolved Packet System. Ericsson’s Evolved Packet Gateway (EPG) is a vital component of the Evolved Packet Core which forms Ericsson’s solution for rapid deployment of a reliable LTE network. Testing of EPG by emulating traffic close to real time has a significant role in successful deployment of a mobile communication network.
Objectives: In this research, assessment of a virtual traffic emulator is done and the trade-offs involved between using a hardware-based and a virtual traffic emulator are identified by testing Ericsson’s virtual EPG (vEPG). Ixia’s Breaking Point (BPS) and Breaking Point VE (BPS VE) are the hardware-based and virtual traffic emulators respectively used in this thesis. Ease of automation of testing using BPS VE is also investigated.
Method: The method followed for assessing the performance of a virtual traffic emulator and identifying the trade-offs is quantitative. A set of test-cases are designed and run through an iterative methodology until satisfactory results are obtained using the virtual traffic emulator. These results are then used to in-vestigate the trade-offs between virtual and hardware-based traffic emulator as well.
Results: Tests that have been designed are executed and their results are doc-umented. Outcomes of analysis on non-functional aspects that include ease of automation and return on investment are also documented.
Conclusions: Based on the results obtained and their analysis, it is proved that the virtual traffic emulator used in this thesis, BPS VE is a dynamic tool that can be used for real-world traffic emulation to test the vEPG. The trade-offs between the Ixia BPS and BPS VE in the aspects of capacity and ROI are analyzed. It is also concluded that despite having a great usability, there still are some aspects that can be improved in the current version of the BPS VE to make it a more efficient traffic emulator to test the EPG.
Keywords: Automation, LTE, Mobile Communication, Testing, Virtualization
I would like to express my gratitude to my supervisor and mentor, Mr. Kurt Tutschkufor motivating and supporting me throughout the thesis. I would also like to thank him for his constructive feedback.
I would like to thank my supervisors at Ericsson, Rohit Guliani and Adam Bengtssonfor their support and guidance at every stage. They have valued my work a lot and responded to every question or query I had without any hesitation. I feel extremely lucky to have my closest friend Shanmukha Sai Bheemisetty as my thesis partner. He has always been a huge support to me and I believe it would not be possible either to stay so happy and peaceful or to complete this thesis without him.
I would also like to thank Ronny Gahns from Ixia for clarifying all my doubts and supporting me whenever required.
I shall forever be indebted to my parents, Sasi Kumar Adidamu, Sarada Adidamu and my brother, Anant Saurabh Adidamu who are my strength and are always with me giving immense emotional support.
Finally, a huge thanks to all my friends for helping me stay happy and complete this thesis.
Abstract i
Acknowledgments ii
Contents iii
List of Figures v
List of Tables vii
List of Abbreviations viii
1 Introduction 1
1.1 Motivation and Problem Statement . . . 2
1.2 Aim . . . 3 1.3 Research Questions . . . 3 1.4 Contribution . . . 3 1.5 Research Methodology . . . 4 1.6 Split of Work . . . 5 1.7 Thesis outline . . . 6 2 Related works 7 3 Background 9 3.1 Evolved Packet System . . . 9
3.1.1 GPRS tunneling protocol . . . 11
3.1.2 Control plane (GTPv2-C) . . . 11
3.1.3 User plane (GTPv1-U) . . . 12
3.1.4 Evolved Packet Gateway . . . 13
3.2 Ixia BreakingPoint VE . . . 17
4 Methodology and Test Setup 23 4.1 Research Methodology . . . 23
4.2 Test setup . . . 24
4.3 Test Procedure . . . 27 iii
4.4.2 Throughput vs vController Resources . . . 32
4.4.3 Throughput vs vBlade Resources . . . 33
4.4.4 Stability of Throughput . . . 34
4.4.5 Robustness of BPS VE Performance . . . 34
4.4.6 Robustness of vEPG using BPS VE . . . 35
4.4.7 Accuracy in terms of Quantity of Data . . . 37
4.4.8 Non-Functional Aspects . . . 37
5 Results and Analysis 38 5.1 BPS VE 10G Port Maximum Throughput Test . . . 38
5.2 BPS VE Throughput vs vController Resources . . . 43
5.3 BPS VE Throughput vs vBlade Resources . . . 44
5.4 Stability of BPS VE Throughput . . . 47
5.5 Robustness of BPS VE Performance . . . 49
5.6 Robustness of vEPG using BPS VE . . . 53
5.7 Accuracy in terms of Quantity of Data . . . 54
5.8 Non-Functional Aspects . . . 56
6 Conclusion and Future Work 58 6.1 Answers to Research Questions . . . 58
6.2 Future Work . . . 61
7 References 62
1 GPP Architecture Domains . . . 10
2 Basic EPC architecture for LTE . . . 10
3 GTPv2-C protocol stack . . . 12
4 GTP-U protocol stack . . . 13
5 End to End GTP protocol stack . . . 13
6 Attach sequence for LTE radio . . . 16
7 UE initiated detach sequence . . . 17
8 BreakingPoint VE component setup . . . 18
9 HTTP Superflow . . . 20
10 Skype Superflow . . . 20
11 Types of Load Profiles . . . 21
12 Step Load Profile . . . 22
13 Test Bed Setup . . . 25
14 Back to Back Test Environment . . . 26
15 vEPG Test Environment . . . 27
16 Test Interfaces in Network Neighbourhood . . . 27
17 Single User configuration . . . 28
18 Multi User configuration . . . 28
19 Real Time Statistics . . . 29
20 Data Rate Configuration . . . 30
21 Session/Super Flow Configuration . . . 31
22 HTTP Superflow Configuration . . . 32
23 Real-Time traffic superflow . . . 32
24 Card information on vEPG node during the reload phase . . . 35
25 Card information on vEPG node after the reload phase . . . 35
26 Stack Scrambler configuration . . . 36
27 Single User - Simple HTTP - B2B Test Environment . . . 39
28 10k Users - Simpe HTTP - B2B Test Environment . . . 40
29 Single User - Simple HTTP - vEPG as SUT Test Environment . . 41
30 10000 users - Simple HTTP - vEPG as SUT Test Environment . . 42
31 10000 users - Real-Time Traffic - vEPG as SUT Test Environment 43 32 Maximum throughput vs vcontroller RAM graph . . . 44
35 BPS VE Throughput vs vBlade vcpus . . . 46
36 CPU layout on the host . . . 46
37 10 vcpus mapped to NUMA 0 . . . 47
38 Maximum throughput vs vCPU - With and Without vCPU Pinning 47 39 Throughput vs time(seconds) - 4 hours . . . 48
40 Throughput vs time(seconds) - 24 hours . . . 49
41 Reload of PP card in use . . . 50
42 Reload of backup PP card . . . 50
43 One of the PP cards up and running. . . 51
44 Overall PP card Reload . . . 51
45 Overall SC card Reload . . . 52
46 vEPG Restart . . . 53
47 Throughput vs time (seconds) . . . 54
48 IP summary from BPS VE results . . . 54
49 PGW statistics on the vEPG node . . . 55
50 Measurement Points . . . 55 51 vController - 8GB RAM . . . 68 52 vController - 10GB . . . 69 53 vController - 12GB . . . 70 54 vController - 8 vcpus . . . 71 55 vController - 12 vcpus . . . 72 56 vController - 16 vcpus . . . 73 57 vBlade - 8GB RAM . . . 74 58 vBlade - 10GB RAM . . . 75 59 vBlade - 12GB RAM . . . 76 60 vBlade - 4vcpus . . . 77 61 vBlade - 8vcpus . . . 78 62 vBlade - 10vcpus . . . 79 63 vBlade - 12vcpus . . . 80 64 vBlade - 14vcpus . . . 81 vi
Table 1 Split of Work
Table 2 vController RAM Values Table 3 vController vCPU values Table 4 vBlade RAM values Table 5 vBlade vCPU values
Table 6 Fuzzing introduced by Stack Scrambler Table 7 Accuracy Calculations
Table 8 ROI calculations
Table 9 Capacity Summary - BPS and BPS VE
3G 3rd Generation
3GPP 3rd Generation Partnership Project 5G 5th Generation
APN Access Point Name B2B Back to Back
BPS BreakingPoint System (Physical Edition) BPS VE BreakingPoint System Virtual Edition CDMA Code Division Multiple Access
CPU Central Processing Unit CSV Comma Separated Values
DHCP Dynamic Host Configuration Protocol DNS Domain Name Service
DUT Device Under Test
eHRPD Evolved High Rate Packet Data eNB E-UTRAN Node B
EPC Evolved Packet Core EPG Evolved Packet Gateway EPS Evolved Packet System
E-UTRAN Evolved UMTS Terrestrial Radio Access GB Giga Byte
GPRS General Packet Radio Service GSM Global System for Mobile GTP GPRS Transport Protocol
GTPC GPRS Transport Protocol – Control GTP-U GPRS Transport Protocol – User Plane HDD Hard Disk Drive
HSS Home Subscriber Service HTML Hyper Text Markup Language HTTP Hyper Text Transfer Protocol ICMP Internet Control Message Protocol
ICT Information and Communications Technology
IoT Internet of Things IP Internet Protocol
KPI Key Performance Indicator L1 Layer 1
L2 Layer 2 L7 Layer 7
LAN Local Area Network LTE Long-Term Evolution Mbps Mega Bits Per Second ME Mobile Entity
MME Mobility Management Entity MTC Machine Type Communication NFV Network Function Virtualization NIC Network Interface Card
NUMA Non-uniform Memory Access OSI Open Systems Interconnection
PCEF Policy and Charging Enforcement Function pCPU Physical CPU
PCRF Policy and Charging Rules Function PDF Packet Data Function
PDN Packet Data Network PGW PDN Gateway
PISC Packet Inspection and Service Classification PP Payload Processor
QoS Quality of Service
RAM Random Access Memory RAN Radio Access Network RAT Radio Access Technology RRC Radio Resource Control
SAE System Architecture Evolution SC Session Controller
SCTP Stream Control Transport Protocol SDN Software Defined Networking SGSN Serving GPRS Support Node SGW Serving Gateway
SUT System Under Test
TCP Transport Control Protocol TEID Tunnel Endpoint Identifier
TEID-C Tunnel Endpoint Identifier – Control Plane TLS Transport Layer Security
UDP User Datagram Protocol UE User Equipment
WCDMA Wideband CDMA vCPU Virtual CPU
vEPG Virtual Evolved Packet Gateway
WIFI ¨Wireless Fidelity¨ Wireless network technology VLAN Virtual LAN
WLAN Wireless LAN VM Virtual Machine VOIP Voice Over IP
XLS Microsoft Excel Spreadsheet
Introduction
The exponential proliferation of wireless data services driven by mobile Internet and smart devices has triggered the investigation of the 5th Generation (5G) cellular network. Around 2020, the new 5G mobile networks are expected to be deployed which must support multimedia applications with a wide variety of requirements such as higher capacity rates, reduced latency, improved energy efficiency [1]. Also, over the last few years, cloud, and virtualization technolo-gies, Software Defined Networking (SDN), Internet of Things (IoT), Machine Type Communication (MTC) and Network Functions Virtualization (NFV) have gained great momentum among mobile operators. These technologies are leading into a networked society with billions of connected devices, lots of applications and services. To be able to deliver the wide variety of network performance characteristics that these future services are demanding is one of the primary technical challenges. To overcome this challenge, a dynamic core network is vital. The core network comprises of the Evolved Packet Core (EPC). EPC, along with Long Term Evolution (LTE) constitutes the Evolved Packet System (EPS) which fully supports the packet-switched data services.
Ericsson, a world class eminent company in the telecommunication sector provides global telecom services, communication networks and multimedia solutions. Its services, software, and infrastructure - especially in mobility and broadband are enabling the communications industry to increase efficiency and improve user experience. Ericsson EPG, together with Serving GPRS Support Node-Mobility Management Entity (SGSN-MME), is a critical component of EPC. It is part of the Ericsson’s end-to-end solution for rapid deployment of a highly scalable and reliable LTE network [2]. As packet data being generated and consumed is increasing rapidly, Ericsson deploys suitable equipment that is stable, supports more functionality in their EPG. To guarantee the quality of this equipment, testing plays a vital role.
Ixia is the leading provider of IP performance test systems across the globe, with its products and solutions. Ixia BreakingPoint Virtual Edition (BPS VE) is a vir-tualized Application and Security Test Solution. It provides scalable real-world
application and threat simulation in an elastic deployment model by leveraging virtualization on industry-standard hardware platforms [3]. Its flexible test func-tionality allows to emulate the network components needed to test a product. Ericsson provides the vitrual EPG (vEPG), virtualized version of the EPG, en-vironment and the focus of this thesis work is to assess the Ixia BPS VE on the provided environment by emulating corresponding traffic, required components and interfaces. Ixia BreakingPoint (BPS), the hardware-based version of BPS VE is the tool considered in this thesis to observe the trade-offs in deploying a physical test setup versus a virtual test setup. There are two main reasons to go for Ixia virtual traffic tool. First one is the stateful traffic it emulates which means the addresses it uses for the emulated traffic are as if they exist in real-world and they are pingable. Second is the level of customization it offers on the L7 application traffic.
1.1
Motivation and Problem Statement
vEPG comprises of the serving gateway (SGW) and the packet data network gateway (PGW), which are critical components for the mobile core network, EPC. Ericsson, being a multinational networking and telecom equipment and services company offers services, software, and infrastructure in ICT for telecom operators. Their EPC solutions must provide reliability, flexibility, scalability and should optimize the massive IoT growth as well. vEPG plays a crucial role in achieving this. Testing of the product is imperative to acquire the required standards and quality.
To test the vEPG, an effective method is to transmit the application traffic which is sent onto the actual network through the EPG and evaluate its performance. However, it is difficult in terms of cost to get a complete set of necessary appli-cations to carry out the evaluation tests. For this reason, a traffic emulator is employed for emulating pseudo-traffic which is obtained by imitating the traffic generated by an arbitrary application. A good user plane test tool should have support for multiple protocols and applications, especially layer 7, both stan-dardized and proprietary. Having this will make it possible for the system under test to be fully tested, especially the deep packet inspection ability and heuristics functionaries. With the elevation of virtualization in network functions, concept of a virtual traffic emulator has emerged. This leads to the need for assessing the performance of a virtual test tool and analyzing the trade-offs that exist between a physical and a virtual traffic emulator.
1.2
Aim
This master thesis aims to assess the performance and accuracy of the Ixia BPS VE in the Ericsson vEPG environment by designing a set of test cases; to analyze the trade-offs that exist between BPS and BPS VE in terms of capacity and Return on Investment (ROI) aspects; to find a feasible solution for the automation of the designed test cases and to obtain and suggest practical improvements in BPS VE to test the Ericsson vEPG more effectively and efficiently.
1.3
Research Questions
The aim of this thesis is to answer the research questions listed below. These questions are regarding the performance of the virtual traffic emulator, BPS VE in the Ericsson EPG environment. These questions are answered based on the experimental results obtained.
1. While testing Ericsson vEPG, are there any differences in the test results obtained using a virtual test environment from those using a native physical test environment?
2. How can one characterize Ixia Breaking Point’s performance and accuracy in a virtual test setup and a physical test setup?
3. How can the Ixia BPS VE tool be improved for a better testing of Ericsson vEPG?
1.4
Contribution
The main contributions or the outcomes of this thesis work are summarized as follows:
1. Test cases that analyse the performance and capabilities of a test tool are designed and run using the virtual traffic emulator, Ixia BPS VE. A set of KPIs are observed.
2. Results of the same tests run using the hardware-based traffic emulator,Ixia BPS are examined to obtain selected KPIs.
3. Study of the obtained KPIs help to inspect the trade-offs between Ixia BPS VE and Ixia BPS in terms of capacity to test the vEPG. Here, capacity implies with regard to throughput obtained.
4. These KPIs also characterize Ixia Breaking Point’s performance and accu-racy in a virtual test setup and a physical test setup.
5. Once the tests are run, the ease of automation and feasibility of deployment of these tests in vEPG environment is investigated and ROI for both the tools is summarized.
6. Running the designed test cases will help in concluding about the improvi-sations that can be included in the Ixia BPS VE tool for better and efficient testing of vEPG.
1.5
Research Methodology
The research methodology adopted for this thesis work is as follows:
1. Literature Review and Study: In this stage, a literature study of pre-vious works on virtual traffic emulators and Ixia BPS VE in specific will be done. Documentation provided by Ixia on BPS VE will be studied (In-stallation guides and Data sheets). Study of research papers, journals and previous thesis work related to EPG and vEPG will be done. The archi-tecture and deployment of vEPG at Ericsson will be studied. Various Test Objects for vEPG are defined that include capacity tests, stability tests, robustness tests and accuracy tests. Test cases are designed to run using Ixia BPS VE with respect to these test objects and to test BPS VE’s ability to test.
2. Deploying and Performing Tests: In this phase, Ixia BPS VE will be deployed in the Ericsson lab and designed test cases are run on the vEPG through an iterative methodology until satisfactory results are obtained. For each test case, the different stages of this iterative methodology are as follows:
• Designing the new test case. • Running the test case.
• Analysing the selected KPIs from obtained results.
• Discussion on obtained KPIs with supervisors at Ericsson and BTH University.
• Modifying the designed test case.
Once the test cases and results are ready, a set of KPIs selected for com-parison between Ixia BPS and Ixia BPS VE are studied.
3. Results and Analysis: Results of every test run are finalized and anal-ysed. In this stage, the capacity trade-off between Ixia BPS VE and Ixia BPS is analysed. ROI aspects are also investigated for both the traffic emulators.
4. Documentation: Every stage of this thesis is documented simultaneously.
1.6
Split of Work
This master thesis is done as a collaborative research leading to a joint thesis work done as a project at Ericsson, Lindholmen by Naga Shruti Adidamu and Shanmukha Sai Bheemisetty. Table 1 explains the split of work between the two students.
1.7
Thesis outline
Chapter 1, the current chapter gives an introduction about the present-day tech-nologies and trends in the mobile communications. It also describes the motiva-tion for performing this thesis and the issue at hand. Aim of the thesis, Research Questions that will be answered in the thesis, Research Methodology adapted to answer the research questions are also made clear in this chapter. Contribution of the this is also included in this chapter. Chapter 2 describes the related work in the areas of test tool assessment, Ixia products, role of automation. Chapter 3 outlines the EPS elements, LTE architecture, protocols used for communication, EPG and Ixia BPS VE. Chapter 4 describes the methodology, test setup, test procedure and the tests designed in this thesis. Chapter 5 covers the results and analysis of the tests performed and non functional aspects studied. Chapter 6 concludes the work done in the thesis, incldes answers to the research questions and suggests the possible future work.
Related works
• Paper [1] "A Survey of 5G Network: Architecture and Emerging Technologies"gives a detailed survey on performance requirements of 5G wireless cellular communication systems that have been defined in terms of capacity, data rate and Quality of Service. It also discusses some key emerging technologies that can be used in 5G wireless systems to fulfill the probable performance desires.
• The authors of "Criteria for evaluating next generation test tools for Evolved Packet Gateway" [4] conveys the importance of new so-phisticated ways of testing to provide the best up-to-date products possible for the mobile operators and network equipment providers. They consid-ered one network component, Ericsson’s Eevolved Packet Gateway (EPG) which is the interface between the mobile network and the internet to test. They did an initial research of the increasing data traffic in the mobile network and defined a set of criterion which a test tool for EPG need to fulfil to meet the future’s demands. They also evaluated three test tools, FireStorm, Ixload and Landslide with respect to the criteria. According to them, to test packet gateways such as EPG, the test tools which emulate the surrounding interfaces and make sure that the device under test meets its requirements are used.
• In paper [5], "Performance analysis of LTE networks in varying spectral bands" performance of LTE network is analyzed by stimulating it in varying bands. Parameters like throughput and average throughput have been focussed in this paper.
• Paper [7], "Assessment of IxLoad in an MPG Environment" deals with a real-world traffic emulator designed by the test solution provider Ixia, IxLoad. Mobile Packet Gateway (MPG), developed by Ericsson was utilized to assess the capacity and LTE functionality of IxLoad. Maximum simulated users supported by IxLoad and maximum throughput IxLoad can achieve with a particular number of users are verified. Features such as Track Area Update and Handover, Busy Hour Functionality, Deep Packet Inspection, Multiple Access Point Names (APNs) and Dynamic Quality
of Service Enforcement are also covered in the functionality assessment. Suggestions are proposed in relation to improvements for IxLoad and MPG. • Impact of workload type, partial background CPU load, and CPU pin-ning configuration on performance interference between pairs of colocated computationally-intensive workloads is presented in paper [9], "Analyzing the Impact of CPU Pinning and Partial CPU Loads on Perfor-mance and Energy Efficiency". It suggests that CPU pinning can be used in a dynamic fashion in response to system utilization. On a system with light background loads, the ’per-thread’ pinning configuration enables more efficient utilization of resources, leading to better performance. • Authors of Paper[13], "Evaluating and Optimizing I/O Virtualization
in Kernel-based Virtual Machine (KVM)" deal with the important problem of I/O virtualization performance in KVM. They evaluate KVM I/O performance and propose several optimizations for improvement. They reduced VM Exits by merging successive I/O instructions and decreased the frequency of timer, simplified the Guest OS by removing redundant operations when the guest OS operates in a virtual environment, eliminated the operations that are useless in the virtual environment and bypassed the I/O scheduling in the Guest OS whose results will be rescheduled in the Host OS and changed NIC driver’s configuration in Guest OS to adapt the virtual environment for better performance.
Background
3.1
Evolved Packet System
This section gives a brief introduction to EPS architecture defined by 3rd Gen-eration Partnership Project (3GPP) System Architecture Evolution (SAE) work item. Figure 1 shows the network implemented using 3GPP specifications de-scribing the position of Packet Core. The four clouds in the left half of this figure define the Radio Access Networks (RAN) domains that can be connected to Packet Core domain. These include the second and third generation networks defined by 3GPP, the latest mobile broadband - LTE and the Non-3GPP access networks. LTE radio access network consists of only evolved Node BS (eNB) and the absence of central controller in its core makes it a flat architecture [5]. Non-3GPP domain consists of any packet data access network that is not defined by 3GPP standards (example: Evolved High Rate Packet Data (eHRPD), Wireless LAN (WLAN), fixed network accesses or any combination of those) [6].
The Core network can be divided into circuit core, packet core and IP Multi Media Subsystem (IMS) domain. Circuit core domain provides support for cir-cuit switched services over Global System for Mobile (GSM) and Wideband Code Division Multiple Access (WCDMA). The IMS domain provides support for the multimedia sessions based on Session Initiation Protocol (SIP) and utilizes IP connectivity provided by packet core domain. Packet core domain provides sup-port for packet switched services over GSM, WCDMA, Non-3GPP and LTE. It also provides functions for management and enforcement of service-level and bearer-level policies such as Quality of Service (QoS).
Figure 1: GPP Architecture Domains
The concentration here is on the EPC architecture. At the core of the EPC archi-tecture is the function required to support basic IP connectivity over LTE access. Basic architecture of the EPC, which is vital in deploying LTE is illustrated in the figure 2.
Figure 2: Basic EPC architecture for LTE
Terrestrial Radio Access Node B (eNBs), many of which may be interconnected via the X2 interface to allow efficient handovers. Every eNB is connected to at least one MME over the S1-MME interface. MME is connected to Home Subscriber Service (HSS) over S6a interface. MME performs all the control plane signalling including mobility and security functions for devices and terminals. MME relies on HSS subscriber-related data to establish IP connectivity over LTE. User data payload - IP packets, are handled by two logical nodes called the SGW and the PGW. SGW and PGW together are known as the Evolved Packet Gateway. These are connected over the interface S5/S8 depending upon the roaming status.
SGW is connected to eNB over S1-U interface. It acts as an anchor point for inter eNB handover. Its functions include lawful interception, packet routing and forwarding, charging (offline). PGW is the point of interconnection to the external IP network over SGi interface. After passing through SGW, the next interface terminates at PGW for further packet processing and then the packets are routed to an external PDN. GPRS Tunneling Protocol (GTP) protocol is supported over LTE interfaces to provide IP connectivity. In this thesis, virtual EPG (SGW+ PGW) developed by Ericsson is the System Under Test (SUT).
3.1.1
GPRS tunneling protocol
The GTP protocol was developed for mobility and bearer management; tunneling of user data traffic for General Packet Radio Service (GPRS). The two main components of GTP are the control-plane part (GTP-C) and user-plane part (GTP-U). GTP-C is used for the control and management of the tunnels attaching individual terminals to transfer user data. GTP-U uses a tunnel mechanism to carry the user specific data traffic. GTPv2-C and GTPv1-U are used exclusively in the EPS.
3.1.2
Control plane (GTPv2-C)
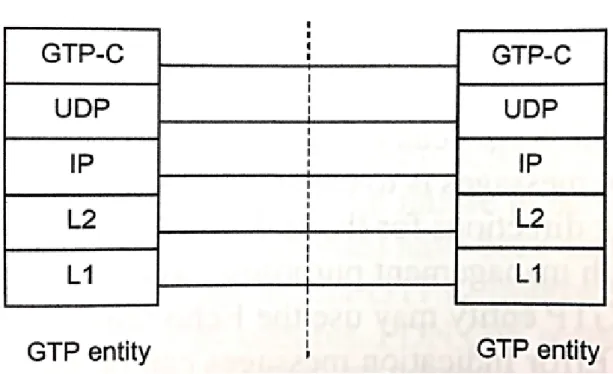
GTP defines a set of messages between two entities to establish, use, manage and release tunnels. A path may be maintained by keep-alive echo messages. Figure 3 illustrates the GTPv2-C protocol stack. To specify the source and destination of the GTP tunnel, each endpoint of the GTP tunnel is identified with Tunnel Endpoint Identifier (TEID), IP address and a User Datagram Protocol (UDP) port number [7]. The scope of the GTP tunnel and TEID-C depends on the interface and its functions.
Figure 3: GTPv2-C protocol stack
3.1.3
User plane (GTPv1-U)
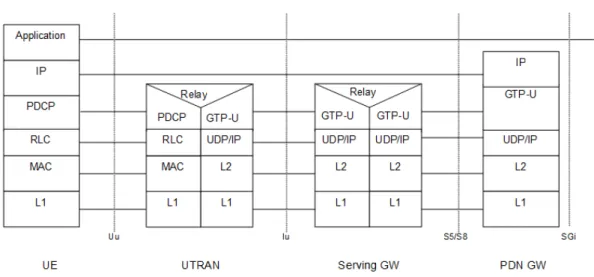
GTP-U tunnels are used to carry encapsulated payload and signalling messages between a given pair of GTP-U Tunnel Endpoints. The TEID-U that is present in the GTP header indicates which tunnel particular payload belongs to. GTP-U tunnels are established using S1-MME or GTP-C. GTP-GTP-U protocol stack is as shown in figure 4. The GTP-U are used to carry encapsulated payload and signalling messages and the figure 5 describes this end to end protocol stack for user data traffic exchange.
Figure 4: GTP-U protocol stack
Figure 5: End to End GTP protocol stack
3.1.4
Evolved Packet Gateway
This part of the chapter will concentrate on describing SGW, PGW, Bearers, UE attach and detach procedures in an LTE network.
Serving Gateway:
The position of the SGW in the EPS is introduced in section 3.1. A UE is connected to EPS through eNB and SGW terminates the interface towards eNB in an LTE network. Every UE that is attached to EPS is connected to a single SGW. The SGW is selected for the UE based on the network topology and the UE location. The Domain Name Service (DNS) may be used to resolve a DNS string of possible SGW addresses that the UE should be attached to. Apart from this, SGW selection can be based on two other factors i.e., based on the necessity to change the SGW later and based on the need for load balancing between different SGWs. SGW handles the forwarding of the end user data packets and acts as an anchor point when an inter-eNB handover is required. It also supports Inter-Radio Access Terminal (RAT) handover for other 3GPP access technologies. These store relevant information of a UE such as parameters of the IP bearer service or internal network routing information. It also handles the UE idle state by terminating downlink path and triggering of paging towards UE when packets arrive. SGW interfaces are terminated towards PGW.
PDN Gateway:
For a UE, PGW provides connectivity to external Packet Data Networks (PDN). A UE can be connected to more than one PGW if it must access more than one PDN. The PDN GW allocates an IP address to a UE. Acting as a gateway, PGW performs DPI or packet filtering on a user basis. It also performs service-level gating control and rate enforcement through rate policing and shaping. Another key role of PGW is to act as anchor point for the mobility between 3GPP and non-3GPP technologies such as Wi-Fi and CDMA. PGW also provides scope to perform online charging on a user basis.
Bearers:
Providing PDN connectivity is not just about allocating an IP address to the UE. It is also about transporting the IP Packets between the UE and the PDN with good quality of service (QoS). EPS adopts a tool called bearers to handle the QoS aspects. A bearer provides a logical channel to transport the IP packets between a UE and the PDN. QoS depends on the type of the bearer and all the packets conforming to a bearer receive same treatment with respect to QoS. To provide different QoS to two different packets, they should be sent over different bearers. In general, there is one default bearer and several dedicated bearers. The QoS differs from default bearer to a dedicated bearer. Dedicated bearers are given special treatment over the network. For example, if any application requires a specific amount of guaranteed bit rate or prioritized scheduling, it can use one of the dedicated bearers to achieve it.
S1, S11 & Sgi Interfaces:
S1-U is the user-plane interface carrying user data traffic between the eNB and SGW. S11 interface is defined between the MME and the SGW. This interface uses GTPv2-C and exclusively used for LTE. SGi is the interface between the PGW and the external hosts. In this thesis, traffic on the client side is emulated over S1, S11 interfaces and traffic on the server side is emulated over SGi Interface. Attach and Detach Procedure of a UE in LTE:
A UE needs to register with the network to receive services that require regis-tration. This registration is known as the network attachment. IP connectivity for UE is enabled after establishing a default EPS bearer during the network at-tachment procedure. The systematic procedure for a UE atat-tachment is shown in figure 6 and is described below:
• The UE sends an Attach Request message to the eNB. The eNB checks the MME ID transferred in the Radio Response Control (RRC) layer. If the eNB has the link to the identified MME it forwards the Attach Request to that MME. If not, the eNB selects a new MME and forwards the Attach Request.
• Authentication and Security procedures are performed at this stage. The Mobile Equipment Identity is also retrieved in conjunction from the HSS. • The default bearer is established between Serving GW and PDN GW and
an IP is allocated to the UE.
• The default bearer is established over the radio interface and the Attach Accept is sent to the UE.
• MME informs the SGW about the eNB TEID, which completes the setup of the default bearer as it can now be used in both uplink and downlink.
Figure 6: Attach sequence for LTE radio
The systematic procedure for UE initiated detachment is as shown in figure 7 and is describe below:
• The UE sends a Detach Request to the MME because it is turned off. • The MME instructs the SGW and PGW to delete any bearers for the UE
and PGW removes the bearers after necessary processing.
• The MME may confirm the detachment with a Detach Accept message and remove the signaling connection.
Apart from the UE initiated detach procedure, MME initiated detachment is also possible. When the UE has not communicated with the network for a long time, the MME may initiate the detachment procedure. In that case, the MME will inform the UE with a Detach Request message and the UE follows the UE initiated detachment procedure.
Figure 7: UE initiated detach sequence
3.2
Ixia BreakingPoint VE
Ixia BPS VE provides real-world application simulation for performance testing alongside achieving scalability and flexibility. BreakingPoint devices consist of the chassis and the user interface called the Control Center. Both components work together to create a comprehensive solution for all network devices. These devices can concurrently simulate Transport Control Protocol (TCP) sessions, UDP sessions, application traffic, and live security attacks through the network devices. BPS VE is a software-based test platform that runs a BreakingPoint virtual Controller (vController) and traffic generation virtual Blades (vBlades) comprising a virtual chassis [8]. It provides real-world application for perfor-mance testing and its elastic deployment model helps in achieving scalability and flexibility.
The component setup of BPS VE is shown in figure 8. BPS VE establishes two networks to operate: Management network (control plane) and Test network (data plane). Management network is required to access the vContoller from a HTML browser (BPS user interface) as well as for the communicate between the
vController and vBlades. The vController receives an IP address from a Dynamic Host Control Protocol (DHCP) server via Network Interface Card (NIC0) in its hypervisor or the IP address can be manually configured. A vBlade can also optionally receive an IP address from a DHCP server. The NIC0 cards in both hypervisors are connected to the Local Area Network (LAN). Test Network is required for the communicate within vPorts (port-to-port test) or to communicate with the SUT (port-to-SUT test).
A vController has two management interfaces:
1. External Management - To access the vController through web.
2. Internal Management - For communication between vController and vBlades. vBlades have one management interface used for communication between vCon-troller and vBlades.
Figure 8: BreakingPoint VE component setup
Creation of a test in BPS VE involves multiple steps: Selecting the Network Neighborhood, Adding a test component, Configuring the test component and Running the test.
A Network Neighborhood contains the addressing rules available for each test interface. Each test interface has a set of subnets to define the addressing rules for test traffic originating from each test interface. It defines the possible addresses the system can use for its generated test traffic and determines how the system
will allocate those addresses for use. All addresses used in test traffic generated by BPS VE must follow the protocol rules as though the addresses were a real host existing within a real subnet on the network. When a test is created, a component tag which is a pointer is assigned to each test interface used by a test component. For each test component, the component tag assigned will determine the client and server addresses. When the system starts emulating the test traffic, it will derive the source and destination addresses from the component tag. In BPS VE, Application Profiles and Super Flows provide control over the appli-cation protocols that are on the wire by giving a scope to define the individual flows for each protocol, and combine them in various ways for use in tests. Few important terms used in creating application traffic flow and their description is as follows:
1. Application Profile: A container for the set of flow specifications (Super Flows) that Application Simulator uses to generate test traffic.
2. Super Flow: A container for all the individual flows and the specifications for the flows.
3. Flow: A flow establishes the protocol, server, and client.
4. Protocol Parameters: A set of parameters that is unique to each proto-col. These parameters will typically define the ports and addressing for the server and client.
5. Actions: The events that will occur in a Super Flow. The actions that are available for each flow depends on the protocol on which the flow is based; each protocol has its own set of actions.
6. Action Parameters: A set of parameters that is unique to each action. Each action parameter allows you to control the data used within the action. 7. % Bandwidth: It is the percentage of bandwidth consumed by the Super Flow. This value is affected by the weight that is assigned to the Super Flow; the larger the weight, in comparison to the other Super Flow weight assignments, the higher the % Bandwidth will be.
Figure 9 shows an example of HTTP super flow that sends a request for a simple PDF file and figure 10 shows an example of a Skype super flow that represents a 1-minute audio call.
Figure 9: HTTP Superflow
Figure 10: Skype Superflow
Test components are virtual devices that enable to test how well a device will operate at different network layers. Each test component comes with a set of parameters; which can be used to create the required type of traffic. There are multiple test components that the BPS VE system provides. In this these, we mainly make use of the Application Simulator.
When an Application Simulator test runs, it will first look at the Application Profile selected for the test and then at the Super Flows that exist within the Application Profile. Each Super Flow contains the protocols that should be used
to set up flows, server and client configurations, and the sequence of actions that will occur between the server and the client. Once the clients and servers are created, the actions for the Super Flow must be set up. These actions dictate the sequence of client requests and server responses, and the data that is sent during these sequences.
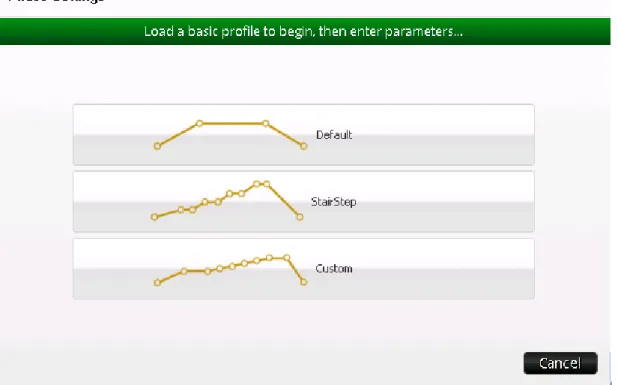
Customization of the behavior of sessions during the different phases of a test is done using the Load Profile settings in BPS VE. Each phase is based on a phase type; represents a period, and determines the behavior of the sessions that are opening and/or closing during that period. Each phase can be configured by setting the maximum number of sessions, the session rate, and the data rate. Each Load Profile must have one ramp up phase, one ramp-down phase, and at least one steady-state phase. The controllable attributes for the phases include the following: phase duration, data rate, session behavior, number of sessions per second, and maximum number of sessions. There are three types of Load Profiles as shown is figure 11.
Figure 11: Types of Load Profiles
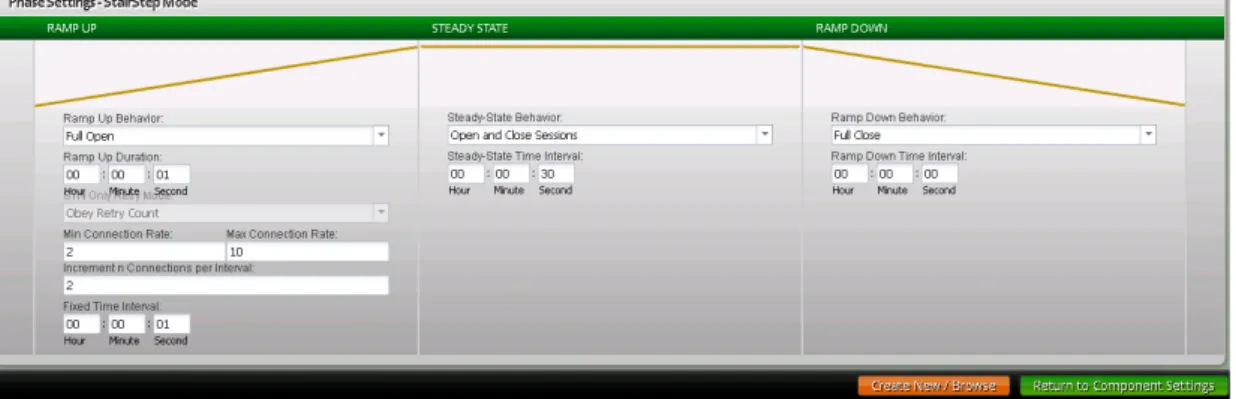
Application Simulator test component allows to generate application traffic flows. It uses an App Profile to determine what types of application flows to send to
the DUT. The App Profile contains a set of flow specifications that defines the protocol, client-type, and server-type the traffic will use. There are three phases within an Application Simulator test: ramp up, steady-state, and ramp down. Each phase dictates the behavior of the TCP flows. During the ramp up phase, the system will attempt to open as many TCP flows as possible in the time allotted to the ramp up phase; however, no data will be sent during this phase. This test component will use the value defined for Session/Super Flow Configuration -Maximum Simultaneous Super Flows as an upper-bound limit on the number of flows that can be open during the ramp up phase. This is shown in figure 12.
Figure 12: Step Load Profile
BPS VE system has a packet buffer that stores all transmitted and received traffic from the last test run. Each port has its own packet buffer with a buffer limit. The number of tests that can be run concurrently depends on the number of available ports in the BPS VE system. To run tests on BPS VE, port reserva-tions must be made. All the reserved ports belong to an Active Group, whose basic functionality is to enable running multiple tests simultaneously. Each test must be run under a different Active Group. The BPS VE system automatically maps ports to interfaces while port reservations. Port mappings are important because they link a port on the BPS VE system to an interface in the Network Neighborhood.
Usage of the features of BPS VE and their configuration in depth for executing the tests designed is described in sections 4.3 and 4.4
Methodology and Test Setup
This section of the document describes the research methodology adopted in carrying out the thesis work, test setup used, the working of the setup to evaluate the performance of BPS VE and the designed test cases.
4.1
Research Methodology
Research method is the systematic approach involved in carrying out the research work. It also involves a set of practices, procedures and rules which are used in the research.[14] The research method adopted to carry out the research work depends upon the nature of the research questions. In general, there are two approaches to research. They are:
1. Quantitative approach 2. Qualitative approach
The Quantitative approach involves the generation of data in the quantitative form, which can be subjected to quantitative analysis in a rigid fashion. The Qualitative approach to research deals with the subjective assessment of the opinions, attitudes, and behavior. This approach depends upon the subjective assessments.
The research methodology adopted to carry out the thesis involves both Quanti-tative and QualiQuanti-tative approach on a high level.
Research Question - 1is answered by adopting case study methodology. Case study method enables a researcher to closely examine the data within a specific context. It can be considered as a robust research method and this method in its true essence, explore and investigate contemporary real-life phenomenon through detailed contextual analysis of a limited number of events or conditions, and their relationships [15]. In this thesis, Ixia BPS and Ixia BPS VE are chosen to represent a hardware-based or physical test environment and a virtual test envi-ronment respectively. Inspite of having certain disadvantages that may include
lack of rigor, challenges associated with data analysis and very little basis for generalizations of findings and conclusions, case study method has its advantages of data collection and analysis within the context of phenomenon, integration of qualitative and quantitative data in data analysis, and the ability to capture com-plexities of real-life situations so that the phenomenon can be studied in greater levels of depth. Maximum throughput obtained per port is considered as the measurement point in this context.
Research Question - 2is answered by assessing the performance and accuracy of Ixia BPS VE in Ericsson vEPG environment and comparing maximum capacity and ROI aspects with Ixia BPS. Performance of BPS VE is assessed by designing test cases to verify maximum throughput, throughput variations with respect to resources allocate to BPS VE, stability of the throughput, robustness of BPS VE and ability of BPS VE to test robustness of the vEPG. Accuracy of BPS VE is assessed by designing a test case that checks the ability of BPS VE to transmit data accurately in terms of quantity. The results of these test cases are finalized through iterative methodology which includes designing of the test case, execution of the test case, analyzing the obtained results through discussions with experts on the vEPG product in Ericsson.
Research Question - 3 is answered by summarizing the difficulties and draw-backs that have arised while answering the second research question. A part of this question is also answered by adopting qualitative methodology, where ease of use is taken into consideration. This is obtained by collecting feedback from the employee of Ericsson that work with testing vEPG.
4.2
Test setup
In this section, description of the hardware and software setup used in this thesis are presented and the different test environments used are discussed. Installation of BPS VE, setting up of the vEPG node and connecting them to each other are the three main tasks to make the test setup ready.
Hardware used in this thesis to install BPS VE is a Dell R630 Rackserver with CPU: Intel(R) Xeon(R) CPU E5-2690 v4 @ 2.60GHz. Red Hat Enterprise Linux Server release 7.2 is installed on the hardware and KVM hypervisor is run over the operating system. BPS VE version 8.21 is used in this thesis for the analysis. vController and vBlades are installed on the host as separate virtual machines using their qcow2 images provided by Ixia. Two NICs are configured on the vCon-troller for external management and internal management. External management uses bridged networking mode so that the management IP of the vController is accessible to the users and internal management uses NAT networking mode.
Each vBlade is configured with one NIC for internal management in NAT net-working mode. Test ports on which BPS VE emulates traffic are configured on the vBlade in bridged networking mode to be able to access the physical NIC on the hardware.
Ericsson provides the vEPG node configured with a suitable Access Point Name (APN) as the SUT. Since BPS VE doesn’t support dual stack, the IPv6 addresses on the NICs of the vEPG node should be disabled. Based on the node name, VLAN IDs for RAN, Media and SGi interfaces are calculated and used in setting up the network neighborhood in BPS VE.
Figure 13 shows the test bed setup, by connecting the BPS VE system to the vEPG node.
Figure 13: Test Bed Setup
Two test environments will be used in this thesis which are explained further below in this section. They are back to back (B2B) and vEPG as SUT. To handle these two environments, two vBlades: vBlade_B2B and vBlade_vEPG are installed and a vController, to manage the vBlades is installed. Four virtual ports are deployed on vBlade_B2B (only two are shown in the figure 13). The first and second ports are connected back to back; third and fourth ports are connected back to back (p1p1-p1p2, p3p1-p3p2). Two ports are deployed on the vBlade_vEPG (em1, em2) which are connected to the vEPG node in the Ericsson’s lab environment.
In this setup, the management network is divided into external and internal management networks. External management network, indicated in red color in the figure 13, is used to access the BPS VE GUI to control and manage BPS VE sessions. Internal Management Network, indicated in blue color in the fig-ure, is used by vController to control and manage the vBlades (vBlade_B2B & vBlade_vEPG). The test ports and their connections are indicated in green color. The description of the two test environments used in this thesis is as follows:
1. Back to Back Test Environment: In the back to back (B2B) test en-vironment, two ports of BPS VE are interconnected. One port simulates subscribers (UEs), eNBs as well as the MME and the other port simu-lates SGW, PGW and PDN. Both the ports exchange traffic via GTP-C and GTP-U protocols. In BPS VE, these components are emulated on the client side and the server side as shown in the figure 14. While running a test in the B2B environment, either first or second pair of ports on the vBlade_B2B are reserved.
Figure 14: Back to Back Test Environment
2. vEPG Test Environment: In vEPG test environment, vEPG is the SUT. BPS VE simulates subscribers (UEs), eNBs and MME on one port and PDN on the other. In BPS VE, these components are emulated on the client and server side as shown in figure 15. While creating the network neighborhood for this test environment, it is important to configure the eNBs, MME, SGW and PGW with correct IP. Three VLANs, two on the client side and one on the server side are introduced with VLAN IDs based on the vEPG node chosen. Suitable APN, suggested by Ericsson is also included in the Mobility Session Information section of the Network Neighborhood. While running a test in the vEPG environment, pair of ports on the vBlade_vEPG is reserved.
Figure 15: vEPG Test Environment
4.3
Test Procedure
Running a test using BPS VE involves the following steps: Selecting the Network Neighborhood, Adding a test component, Configuring the test component and Running the test.
In the Network Neighborhood, the addressing rules are set for each test inter-face. Each test interface has a set of subnets to define the addressing rules for test traffic originating the test interface. It defines the possible addresses the system can use for its generated test traffic and determines how the system will allocate those addresses for use. All addresses used in test traffic generated by BPS VE follow the protocol rules as though the addresses were a real host ex-isting within a real subnet on the network. Network Neighborhood comprises of elements, like various types of network devices. Each element belongs to an element group. Elements of our interest in this thesis are those that represent infrastructure in the LTE core network like eNB/MME, eNB/MME/SGW, eNB, SGW/PGW, MME/SGW/PGW, PGW. We use these elements depending upon the test environment being used in each test. A combination of interfaces is se-lected to act as the server and the client. Network traffic will be transmitted from the interface designated as the client and received on the interface designated as the server. Figure shows the test interfaces section in the network neighborhood.
Figure 16: Test Interfaces in Network Neighbourhood
Test cases are designed either with single user configuration or multiple user con-figuration. Number of UE signifies the number of users or subscribers. This value is modified in the network neighborhood under the HSS/UE Database section and Count parameter. Figure 16 and figure 17 show the configuration in case of
single user and multiple users respectively.
Figure 17: Single User configuration
Figure 18: Multi User configuration
The BPS VE system automatically maps ports to interfaces while port reserva-tions. Port mappings link a port on the BPS VE system to an interface defined in the network neighborhood. Once a test is created, a component tag which is a pointer is assigned to each test interface used by a test component. For each test component, the component tag assigned will determine the client and server addresses. When the system starts emulating the test traffic, it will derive the source and destination addresses from the component tag.
As mentioned in section 3.2, we mainly use Application Simulator as the test component. In the application simulator, we make use of the App Profile to determine what type of application flows to send to the SUT. The protocol, client-type traffic, and server-client-type traffic is defined using a set of flow specifications. An upper-bound limit on the number of flows that can be open during the ramp up phase is defined using the Maximum Simultaneous Super Flows in Session/Super Flow Configuration.
Once a test is ready to be run with all the parameters defined, it is verified that the test has not exceeded the available bandwidth limitations and hardware resources using the Test Status option. This automatically updates each time the test is modified. If the icon is green, then the test is ready to run; if the icon is yellow, there is an issue with the test configuration but the test can run with the existing configuration; if the icon is red, there is an issue with the configuration that is preventing the test from running. In case of yellow or red, clicking on the Test Status link displays the issues with the test configuration. The test is run using the ‘Start Test’ option whenever the test status is green/yellow.
Any settings specific to a test are described in section 4.4.
While the test is running, Real-Time Statistics instantly show the progress at any given point in time as shown in figure 18. This also gives interactive graphs that dynamically update as the test progresses.
Figure 19: Real Time Statistics
When the test finishes, reports that provide detailed information about the test, such as the components used in a test, the addressing information, the SUT profile configuration, the system versions, and the results of the test are studied to fetch values of the required parameters.
4.4
Tests Designed
To evaluate the performance of BPS VE, following test case are designed and executed.
4.4.1
10G Port Maximum Throughput Test
Throughput is a major key performance indicator for wideband services. This test case is to check the highest throughput a 10 Gigabit port of BPS VE can achieve for a certain application under the conditions involving a single user and 10k users, having the hardware and software configurations as mention in section 4.2. This test case is run in both, back to back and vEPG as SUT test envi-ronments. Ports are reserved on the chassis and the network neighborhood is
configured for each test correspondingly as mentioned in section 4.3. Application Simulator is selected as the test component and the Data Rate parameters are set as shown in figure 19.
These parameters define the maximum transmit data rate that the test will use. When specifying a rate in Megabits/second (Mbps), the ethernet inter-packet gap is included in the rate value. Therefore, the amount of usable data ’on the wire’ will be less than the rate value, depending on frame/packet size. Data Rate Scope defines whether the rate distribution number is treated as a per-interface limit or an aggregate limit on the traffic that this component generates. Because of the asymmetric nature of most application protocols, when per-interface limiting is enabled, client-side bandwidth is likely to be less than server-side bandwidth and the aggregate bandwidth used for some protocols will be less than the sum of the max allowed per interface. But, in this test case, a fixed amount of throughput is required to analyze the maximum possible throughput. Thus, the aggregate limit is selected.
Figure 20: Data Rate Configuration
Maximum Super Flows per second parameter in the Session/Super Flow Config-uration as shown in figure 21 defines the maximum number of Super Flows that will be instantiated per second. There must be adequate bandwidth allocated to a test via the Rate Distribution parameter to achieve certain number of sessions per second. Also, the ramp up duration generally should be 1 second or longer for high numbers of sessions per second. This ensures that the test has some phase where test bandwidth is exclusively dedicated to setting up sessions. Max-imum Simultaneous Super Flows define the maxMax-imum simultaneous super flows that will exist concurrently during the test duration. It defines a shared resource between different test components.
Figure 21: Session/Super Flow Configuration
Stair Step load profile with ramp up behaviour as ’Full Open + Data + Full Close’ for 20 seconds, Steady-State behaviour as ’Open and Close Sessions’ for 10 minutes and Ramp-Down behaviour with ’Full Close’ for 15 seconds are con-figured.
Two kinds of application profiles are used to analyze the maximum possible throughput. Their names, file size and details about the traffic mixes are as shown below in figure 22 and figure 23.
Figure 22: HTTP Superflow Configuration 2. Real-Time Mobile Traffic Superflow:
Figure 23: Real-Time traffic superflow
4.4.2
Throughput vs vController Resources
As seen in section 3.2, vController is the virtual system controller for controlling and managing the vBlades. The minimum hardware requirements of a vController are 8 GB RAM, 8 vCPUs and 100 GB HDD. The purpose of this test case is to
observe the impact of the change in resource configuration of the vController on the throughput of BPS VE and to obtain the most favorable configuration of the RAM allocation and number of vCPUs to yield maximum throughput.
While setting up the vController, the memory allocated to RAM and the number of vCPUs are changed. One of the parameters is set to its minimum requirement value and the second parameter is varied. Values of RAM memory and vCPUs used in this test case are as shown in Table 2 and Table 3.
Table 2 : vController RAM values vCPUs : 8
RAM(GB) 8 10 12
Table 3 : vController vCPU values RAM(GB) : 8
vCPUs 8 10 12
vBlade configuration is set to 10 vCPUs and 8 GB RAM as they yield the best throughput, which is seen in results and analysis of third test case in section 5.3. Back to back test setup is used for this test case and the test configuration remains as explained in section 4.4.1.
4.4.3
Throughput vs vBlade Resources
As seen in section 3.2, vBlade is responsible for the traffic emulation and its minimum hardware requirements for high performance and scalability are 8 GB RAM, 4 vCPUs and 10 GB HDD. The purpose of this test case is to observe the impact of the change in resource configuration of the vBlade on the throughput of BPS VE and to obtain the most favorable configuration of the RAM allocation and number vCPUs to yield maximum throughput. While setting up the vBlade, the memory allocated to RAM and the number of vCPUs are changed. One of the parameter is set to its minimum requirement value and the second parameter is varied. Various values of RAM memory and vCPUs used for this test are as shown in Table 4 and Table 5.
Table 4 : vBlade RAM values vCPUs : 4
Table 5 : vBlade vCPU values RAM(GB) : 8
vCPUs 4 8 10 12 14
Back to back test setup is used for this test case and the test configuration remains like the one in section 4.4.1.
4.4.4
Stability of Throughput
Stability testing is adopted to verify if the application can continuously perform well within the acceptable period. This test case is to verify the ability of BPS VE to emulate traffic consistently for longer periods of time and to see that the vEPG node stays stable in a situation that is close to the customer environment for a long period.
To verify the ability of BPS VE to emulate traffic consistently for longer periods of time, tests are performed using the vEPG as SUT setup. Application Simu-lator is selected as the test component and the data rate parameters, super flow configuration is set as in section 4.4.1, with minimum data rate being 4000 Mbps. A Stair Step load profile with ramp up behaviour as ’Full Open + Data + Full Close’ for 20 seconds, Steady-State behavior as ’Open and Close Sessions’ for 4 hours and Ramp-Down behaviour with ’Full Close’ for 15 seconds is configured. Two tests are run configuring the duration of steady state to be 4 hours and 24hrs. Http superflow and a single user test environment are used for these tests.
4.4.5
Robustness of BPS VE Performance
A robustness test shows the system’s resilience in the event of any failure [10]. BPS VE should have the capability to handle the emulated traffic when the SUT or the components of the SUT are shut down or re-started. Robustness of the tool BPS VE is tested in this test case. This test case has two sections:
Components of vEPG reloaded
Session controller (SC) cards and payload processor (PP) cards are the two major components of the SUT, vEPG. The node used in this thesis is configured with two SC cards and two PP cards; one for use and the other for resilience purpose. Robustness is tested by reloading these cards. In all the test cases, throughput is observed while the cards are reloading and once the cards are reloaded as shown in figures 4.12 and 4.13 respectively.
Figure 24: Card information on vEPG node during the reload phase
Figure 25: Card information on vEPG node after the reload phase vEPG restarted
In this case, the vEPG is restarted and the throughput is observed when the node is down and while it is back to running state after the shutdown.
4.4.6
Robustness of vEPG using BPS VE
This test case is designed to analyze the ability of BPS VE to verify the strength of the vEPG. Along with application simulator, stack scrambler is also used as a test component in this test. This allows to introduce fuzzing at a layer or pro-tocol level in a packet. This fuzzed traffic is passed through the vEPG to verify its strength. Figure 26 shows the configuration of the stack scrambler. These indicate the number of corruptions that are introduced as the percentage of the traffic emulated. 5 is the maximum number of simultaneous corruptions that can be introduced at a time.
4.4.7
Accuracy in terms of Quantity of Data
This test case concentrates on the accuracy of the quantity of data being trans-mitted between BPS VE and the vEPG. It is important to verify that the total traffic emulated by BPS VE is received by the vEPG and is re-directed to BPS VE server side accurately. For this test case, only application simulator is used as a test component with similar configuration as mentioned in section 4.4.1 but the data rate is kept low as the focus is on accuracy here. It is set to 2000 Mbps. The vEPG is configured with two SC cards and two PP cards.
4.4.8
Non-Functional Aspects
There are two non-functional aspects in which BPS VE is analyzed. They are the ease of automation and the ROI. The ROI part is also compared with the Ixia BPS to look at the trade-offs.
At present, there is an increased demand to achieve test automation in the telecommunication sector. Role of automation is high because of the advantages it provides which include reducing human intervention, increasing the speed of test execution and test reliability. Automated testing can be considered as a corner-stone in the modern software development process, where the use of test automation is increasing rapidly due to the introduction of methods such as test-driven development and continuous integration [11].
ROI is a performance measure used to evaluate the efficiency of an investment or to compare the efficiency of different investments. ROI measures the amount of return on an investment relative to the investment’s cost. In this thesis, we calculate and analyze the ROI for both, virtual and hardware-based BPS.
Results and Analysis
This section presents the results of the test cases described in section 4.4 and their analysis to assess the performance of Ixia BPS VE.
5.1
BPS VE 10G Port Maximum Throughput Test
When a single user or subscriber was allotted a maximum of 10 simultaneous super flows, 10 super flows per second, the CPU usage of the vEPG (SUT) was found to be lower than its maximum capacity. Thus, the simultaneous super flows and super flows per second were gradually increased and when both were configured to 20, the CPU usage of the vEPG was at its maximum. This resulted in the final configuration of single user scenario to have a maximum of 20 simultaneous super flows and super flows per second and multiple user scenario with 10k users to have a maximum of 20k simultaneous super flows and super flows per second. Stability of the obtained throughput is one of the major factors in deciding the maximum obtainable throughput from BPS VE. Minimum Data Rate parameter has been increased from 1000 Mbps to 7000 Mbps and the throughput on both the interfaces has been observed. It is seen that the throughput is not stable over 5500 Mbps, that is the fluctuations in the graph are too high. Upon investigating, the reason for throughput over 5500 Mbps not being stable is realized as the packet drops at the KVM Bridge. To handle this, Direct IO or DPDK methods can be used. Since BPS VE doesn’t support these methods currently, 5500 Mbps is concluded as the maximum obtainable throughput. Graph shown in figure 27 shows the throughput for a single user and figure 28 shows the throughput for 10k users, when testing using the B2B test environment.
Figure 28: 10k Users - Simpe HTTP - B2B Test Environment
When testing using the vEPG as SUT test environment, there is a reduction in maximum obtainable throughput due to some limitations on the SUT side. Stable throughput over 4700 Mbps can also be obtained but there is an enormous packet drop which is not acceptable. Thus, 4700 Mbps is concluded as the maximum obtainable throughput when a single user is emulated which is shown in figure 29.
Figure 29: Single User - Simple HTTP - vEPG as SUT Test Environment As a single subscriber using multiple applications simultaneously is considered impractical and rare, a real-time traffic case with single subscriber is not tested. For 10k users, figure 30 and figure 31 show the maximum throughput when simple HTTP traffic and real-time traffic are transmitted respectively.
Figure 31: 10000 users - Real-Time Traffic - vEPG as SUT Test Environment
5.2
BPS VE Throughput vs vController Resources
There is no change in the maximum throughput obtained when the resources, RAM allocation and vCPUs of the vController are varied. Individual graphs are shown in Appendix and the overall variation in throughput with respect to RAM is shown in figure 32 and with respect to vCPUs is shown in figure 33.
Figure 32: Maximum throughput vs vcontroller RAM graph
Figure 33: Throughput vs vController vCPU
5.3
BPS VE Throughput vs vBlade Resources
Varying the RAM allocation of the vBlade has not affected the maximum through-put obtained but the vCPUs allocated to the vBlade has shown a significant im-pact as vBlade is responsible for traffic emulation on the virtual chassis. Figure
34 shows the throughput vs RAM graph. Individual graphs are included in the Appendix.
Figure 34: Throughput vs vBlade RAM
As mentioned in section 4.4.2, vCPUs of the vBlade are varied from 4 to 14 and the throughput is observed. It is seen that the throughput increases with increase in vCPUs up to 10 and then decreases drastically. This variation is shown in figure 35 and the individual graphs are included in the Appendix.
Figure 35: BPS VE Throughput vs vBlade vcpus
Since vCPUs allocated to vBlade has highly affected the maximum throughput, an idea to observe the influence of method of vCPU allocation on this throughput has emerged. Pinning certain workloads to a subset of CPUs is an approach to increase the workload isolation, but its effect depends on workload type and system architecture [9]. Results shown above are acquired when the vCPUs are allowed to freely float across the host pCPUs. Idea is to set ‘dedicated’ such that these guest vCPUs are strictly pinned to a set of host pCPUs. Physical host used in the thesis has 28 pCPUs or cores hyperthreaded into 56 logical processors (0-55) and mapped to two NUMA nodes, NUMA 0 and NUMA 1. Each logical processor has a physical ID and a core ID, which indicate the NUMA and the core on which it is present. Since 28 pCPUs are hyperthreaded into 56 logical processors, there will be 2 logical processors present on each pCPU known as siblings. Figure 36 shows the arrangement of these logical processors. Each block in the figure shows the sibling processor numbers on the left and the physical ID, core ID on the right.
In the test setup used described in section 5.1, the two ports connected to vEPG, em1 and em2 are mapped to NUMA 0. Under NUMA, as a processor can access its own local memory faster than non-local memory, vCPUs of the vBlade are also mapped to NUMA 0. Thus, the vCPUs of the vBlade are mapped to NUMA 0 starting from the core 1. An example of mapping 10 vCPUs of the vBlade is shown in figure 37.
Figure 37: 10 vcpus mapped to NUMA 0
It is seen that the throughput has improved with pinning and this can be seen in the graph shown in figure 38. There is a major difference in the drastic decrease of throughput when vCPUs allotted are greater than 10.
Figure 38: Maximum throughput vs vCPU - With and Without vCPU Pinning
5.4
Stability of BPS VE Throughput
Throughput remains stable as expected for a duration of 4 hours and 24 hours except for minute fluctuations in between as shown in figure 39 and figure 40. respectively.