http://www.diva-portal.org
This is the published version of a paper published in International Journal of Behavioral
Nutrition and Physical Activity.
Citation for the original published paper (version of record):
Dohrn, I-M., Welmer, A-K., Hagströmer, M. (2019)
Accelerometry-assessed physical activity and sedentary time and associations with
chronic disease and hospital visits: a prospective cohort study with 15 years follow-up
International Journal of Behavioral Nutrition and Physical Activity, 16(1): 125
https://doi.org/10.1186/s12966-019-0878-2
Access to the published version may require subscription.
N.B. When citing this work, cite the original published paper.
License information: https://creativecommons.org/licenses/by/4.0/
Permanent link to this version:
R E S E A R C H
Open Access
Accelerometry-assessed physical activity
and sedentary time and associations with
chronic disease and hospital visits - a
prospective cohort study with 15 years
follow-up
Ing-Mari Dohrn
1*, Anna-Karin Welmer
1,2,3and Maria Hagströmer
1,2,4Abstract
Background: Associations of objectively assessed physical activity in different intensities and risk of developing chronic disease that requires hospital care have not yet been examined in long term population-based studies. Studies addressing the link between physical activity and sedentary time and subsequent hospital admissions are lacking.
Objective: To examine the prospective associations between physical activity and sedentary time with morbidity defined as: 1) a registered main diagnosis of cardiovascular disease, cancer, type-2 diabetes, dementia, obesity or depression; 2) number of in- and outpatient hospital visits; and 3) number of in-hospital days.
Methods: In total, 1220 women and men, 18–75 years, from the population-based Sweden Attitude Behaviour and Change study 2000–2001 were included. Time spent sedentary, in light-intensity physical activity and in moderate-to-vigorous physical activity, and total accelerometer counts were assessed using the ActiGraph 7164 accelerometer. Morbidity data were obtained 2016 from Swedish registers. Cox proportional hazards models estimated hazard ratios (HR) of morbidity with 95% confidence intervals (CI) and negative binomial regression estimated incidence rate ratio (IRR) with 95% CI for number of hospital visits, and length of hospital stay.
Results: Over a follow-up of 14.4 years (SD = 1.6), 342 persons had at least one registered hospital visit due to any of the included diagnoses. Higher moderate-to-vigorous physical activity was associated with significant risk reductions for combined morbidity (all included diagnoses) (HR: 0.65, 95% CI: 0.48–0.88) and cardiovascular disease (HR: 0.52, 95% CI: 0.33–0.82). Higher total counts showed similar results, and was also associated with fewer hospital visits (IRR = 0.56, 95% CI: 0.37–0.85). Higher sedentary time increased the risk of in-hospital days. (IRR = 2.38, 95% CI: 1.20–4.74).
Conclusion: This study supports the importance of moderate-to-vigorous physical activity for preventing chronic disease that requires hospital care, especially cardiovascular disease. High volumes of sedentary behavior may increase the risk of future hospitalization. Our results support the public health message“sit less and move more”. Keywords: Accelerometer, Cardiovascular disease, Chronic disease, Hospital admission, Moderate-to-vigorous physical activity, Morbidity, Objective assessment, Population-based, Sedentary behavior
© The Author(s). 2019 Open Access This article is distributed under the terms of the Creative Commons Attribution 4.0 International License (http://creativecommons.org/licenses/by/4.0/), which permits unrestricted use, distribution, and reproduction in any medium, provided you give appropriate credit to the original author(s) and the source, provide a link to the Creative Commons license, and indicate if changes were made. The Creative Commons Public Domain Dedication waiver (http://creativecommons.org/publicdomain/zero/1.0/) applies to the data made available in this article, unless otherwise stated.
* Correspondence:ing-mari.dohrn@ki.se
1Department of Neurobiology, Care Sciences and Society (NVS), Karolinska
Institutet, Aging Research Center, Tomtebodavägen 18A, SE-171 65 Solna, Sweden
Introduction
The benefits of physical activity (PA) are well established and include a reduced risk of many of the most common chronic diseases, such as cardio-vascular disease (CVD), cancer, type-2 diabetes, dementia, and depression [1], Additionally, increasing evidence suggests that high levels of sedentary time may increase the risk of CVD, type-2 diabetes and obesity [1–3], and that people with low levels of PA use significantly more healthcare ser-vices than active people [4–6].
However, the current evidence on the associations between PA or sedentary time and morbidity are mainly based on self-reported PA data, which are prone to reporting bias and have limited ability to identify light-intensity PA (activities of everyday living, such as house-hold chores) and sedentary behavior [2, 7, 8]. With recent advancements in movement sensor technologies, portable devices such as accelerometers, have become available in PA research, allowing objective assessments of PA [9, 10]. These devices provide a more accurate investigation of PA through the whole intensity spectra, including light-intensity PA and sedentary time. Due to this relatively new technology, the prospective studies that have examined the associations of objectively assessed PA in different intensities and the risk of devel-oping chronic disease are few and have mainly focused on CVD [11–14], and no previous population-based study has a follow-up time as long as 15 years. Further, studies addressing the link between PA and sedentary time and subsequent hospital admissions are lacking. By using accelerometry we can get more accurate know-ledge of the risk of morbidity in common diseases previously found to be related to self-reported PA or sedentary behavior. This could guide the design of effective health promotion efforts that may contribute to more healthy years for individuals and save societal costs through reduced use of hospital care.
In this study we used a nationally representative sam-ple of adult women and men to investigate the associa-tions of accelerometer assessed PA and sedentary time and morbidity during a 15-year follow-up period. Our specific aims were to examine the prospective associa-tions between PA and sedentary time with morbidity de-fined as: 1) a registered main diagnosis of CVD, cancer, type-2 diabetes, dementia, obesity or depression; 2) number of in- and outpatient hospital visits; and 3) number of in-hospital days.
Material and methods
Study population
This prospective cohort study used data from the Sweden Attitude Behaviour and Change (ABC) study collected from September 2000 to December 2001 [15,
16]. In the ABC study a random sample of 3300 adults
aged 18–75 years (52% women) were selected from the Swedish population register, 2262 were reached by phone and invited to participate and 1556 persons (69%) accepted to participate. In this study, we included the 1220 participants who provided valid physical activity data. This final sample was evenly distributed across Sweden, although the proportion of women were slightly higher, and proportions of participants under 24 years and over 65 years were slightly lower than in the general population [16].
Baseline data collection
Physical activity was assessed with the ActiGraph 7164 (Pensacola, FL, USA) accelerometer, a small, lightweight device measuring time-varying acceleration in the vertical axis recorded as activity“counts” that can be translated to intensity and duration of PA. The accelerometers, at-tached to an elastic belt, were delivered and returned by post together with a baseline questionnaire. Participants were instructed to wear the accelerometer on the lower back for seven consecutive days during waking hours, ex-cept during water-based activities. Days with > 10 h of ac-celerometer wear time were considered as valid and participants providing at least one valid day were included [7, 17]. Non-wear time was defined as an interval of at least 60 consecutive minutes of zero counts, with allow-ance for up to 2 min of 1–100 counts [18]. Cutoff points for PA intensities were < 100 cpm for sedentary time, 100–2019 cpm for light-intensity PA, and ≥ 2020 cpm for moderate-to-vigorous PA (MVPA) [7,19]. Tertiles of time (in min) spent sedentary, in light-intensity PA, and in MVPA, and tertiles of total activity counts [20] (reflecting total PA) were used as exposure variables.
The questionnaire provided information on age, sex, smoking status (never/former or current), length and weight, history of hypertension, heart disease, cancer, diabetes, or arthritis (yes/no), and education (less than high school, high school/equivalent diploma, or univer-sity degree). The ABC study has been described in detail elsewhere [15,16].
Follow-up data collection
Register data of morbidity 2002–2015 were obtained in 2016 from the National Patient Register in Sweden. The register includes all inpatient care in Sweden and also covers hospital outpatient visits including day surgery and psychiatric care from both private and public care-givers. (Primary health care visits are not included.) Information on all visits registered with the following six diagnoses, registered as main diagnosis, according to the International Classification of Disease (ICD-10) were retrieved: CVD including stroke, (I10-I15, I20-I25, I60-I79), cancer (C00-D48), diabetes (E10-E14), obesity (E65-E68), dementia (F00, F01, F03) and depression Dohrn et al. International Journal of Behavioral Nutrition and Physical Activity (2019) 16:125 Page 2 of 8
(F32-F39). Benign tumors, subarachnoid hemorrhage, type-1 diabetes, and essential hypertension were ex-cluded. Dates of admission and discharge were used for inpatient care and date of visit for outpatient care. Add-itional information on cancer diagnoses 2002–2014 was obtained from the Swedish Cancer Register. Information of deaths 2002–2015 was obtained from the Swedish Cause of Death Register for censoring purposes.
Data analyses and statistics
Time from baseline to the first registered main diagnosis of CVD, cancer, type-2 diabetes, dementia, obesity and depression respectively, were used as primary outcomes in separate time-to-event analyses. Follow-up extended from the first day of accelerometer assessment until the date of death or censoring on December 31, 2015. Indi-viduals that did not experience any of the included dis-eases were censored at their date of death or at end of follow-up.
Kaplan-Meier survival curves were calculated separately for all six diagnoses and for combined morbidity (i.e. events from any of all six diagnoses). Cox proportional-hazard models were applied to estimate proportional-hazard ratios (HR) with 95% confidence intervals (CI) of combined morbidity, excluding participants reporting heart disease, cancer, diabetes or with missing disease history at base-line. The outcome was defined as time from baseline to the date when the first of the above-mentioned diseases occurred, or censoring. Only two diagnoses, CVD and cancer, were analyzed separately with the Cox model, since the other diagnoses were too rare in the study popu-lation to provide enough power for the statistical analysis. For the CVD and cancer outcomes, participants with re-ported heart disease and cancer at baseline were excluded in the respective analysis. Time to first event was calcu-lated for each diagnosis separately, e.g. an individual cen-sored for a CVD event was still included in the cancer analyses. We examined a-priori selected covariates for confounding based on previous literature [21–23], and after assessment of the proportional-hazards assumption, the final adjusted models included age, sex, education, smoking (model 2) and additionally (model 3), diabetes, arthritis and hypertension at baseline. All models for sed-entary time were also adjusted for wear time. Participants with missing data for covariates (smoking, n = 5, educa-tion,n = 4, history of disease n = 13) were excluded in the adjusted models. Sensitivity analyses were computed to assess the association between the exposure variables and the outcome, using penalized spline functions, but the conclusions did not deviate from our main models. Add-itional sensitivity analyses were computed for: combined morbidity including only three diagnoses, i.e. CVD, cancer and type-2 diabetes; for CVD incidence excluding stroke; and with BMI as an additional confounder. To limit the
possibility of reversed causality, sensitivity analyses were also computed for all Cox proportional-hazard models, excluding participants with events registered during the first three years of follow-up.
Secondary outcomes of interest were number of hospital visits and number of in-hospital days. Number of in- and outpatient visits were merged into one vari-able, hospital visits. Number of in-hospital days was calculated from the day of admission to and including the day of discharge. If admission and discharge were registered on the same day, one day was included. Negative binomial regression was used to estimate inci-dence rate ratio (IRR) with 95% CI for number of hos-pital visits and number of in-hoshos-pital days for combined morbidity [24], including the same covariates as in the Cox proportional-hazard models.
Differences between participants without and with reg-istered diagnoses were examined using Student’s t-test or chi-2 test for background characteristics. Level of sig-nificance was set at p < 0.05 for all analyses. The statis-tical analyses were computed using the R software version 3.4.2 and STATA 15 (StataCorp, College Station, Texas).
Results
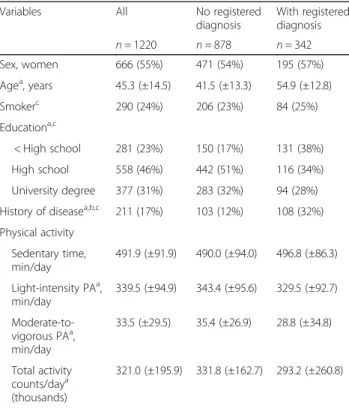
We followed 1220 adults over a mean of 14.4 years (SD = 1.6). During follow-up 342 persons (28%) had at least one diagnosis registered and 80 deaths (6.5%) occurred. Characteristics of the study population are presented in Table 1. Participants with registered diagnoses were older and less educated than those without diagnoses. There were no statistically significant differences in sed-entary time or light-intensity PA observed between par-ticipants with or without a registered diagnosis when adjusting for wear time, while those with a registered diagnosis had lower MVPA and total activity counts per day. The accelerometers were worn 14.4 (±1.3) h per day during 6 (±1) days, and 1168 participants (96%) had at least 4 valid days, with no differences in valid wear time between participants with or without registered diagno-ses. On average, 8 h 12 min were spent sedentary, 5 h 40 min in light-intensity PA, and 33 min in MVPA per day for the whole sample. Time spent sedentary, in light-intensity PA and in MVPA, and total activity counts are presented by tertiles in Table2.
In total, 451 hospital visits were registered with the following distribution of diagnoses: CVD, n = 187; can-cer, n = 176; type-2 diabetes, n = 34; dementia, n = 7: obesity, n = 16; and depression, n = 37. The Kaplan-Meyer analyses showed significant associations between MVPA and combined morbidity, CVD, cancer, obesity and dementia; and between total activity counts and combined morbidity, CVD, cancer, type-2 diabetes, and obesity (Additional file1: Figure S1).
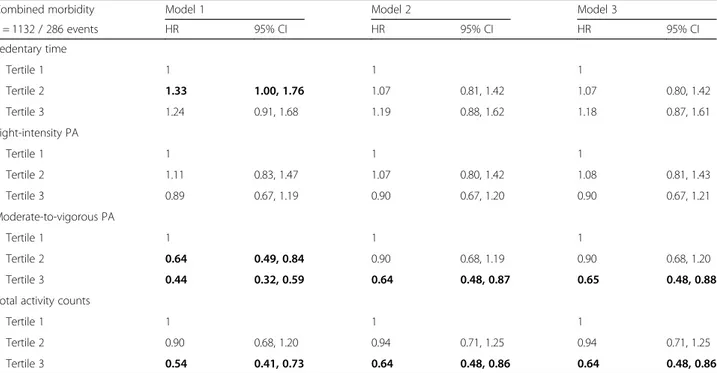
Table 3 shows HR for crude and adjusted models of combined morbidity by tertiles of sedentary time, light-intensity PA, MVPA, and total activity counts. Table 4
shows HR for crude and adjusted models of CVD and cancer morbidity. Inverse associations with combined morbidity and CVD were observed for MVPA. For cancer morbidity, the crude model showed a significant lower HR for those with the most time in MVPA and with highest number of total activity counts. In the adjusted models these associations were attenuated. Light-intensity PA and sedentary time were not associ-ated with either of combined morbidity, CVD or cancer. None of the sensitivity analyses changed the findings or main conclusions, except that in combined morbidity in-cluding only CVD, cancer and type-2 diabetes, the re-sults for MVPA and total counts were attenuated in the adjusted models (Additional file2: Table S1).
The IRR for hospital visits and in-hospital days from crude and adjusted models are shown in Table5. Partici-pants with a registered diagnosis had a median of 5 hos-pital visits, min-max: 1–109. Among the 214 individuals with registered in-hospital visits, median number of visits was 2, mmax: 1–17, and median number of in-hospital days was 10, min-max: 1–189. Higher total ac-tivity counts were inversely associated with hospital visits, while high sedentary time showed the strongest associations with more in-hospital days.
Discussion
The novel aspect of this study was the use of accelero-metry to investigate the prospective associations of daily PA and sedentary behavior with risk of chronic disease requiring hospital care in a population-based sample with a follow-up time of 15 years. Our results support what previously has been found in PA research using self-reported data, namely, that many of the most preva-lent chronic diseases and most expensive medical condi-tions are favorably influenced by higher levels of PA, and that the public health burden of sedentary behavior may be substantial [1, 4–6]. The investigated diagnoses are strongly associated with PA and sedentary behavior [1– 3], and by collecting data from hospital in- and out-patient care it is reasonable to believe that we included the most serious events, likely to have major conse-quences for the individual, as well as a high burden for the society. In addition to the reported diagnoses, we used number of hospital visits and number of in-hospital days as measures of morbidity. These outcomes do not only reflect the severity of a condition but also how PA habits contributes to health care costs [1,4].
We found that MVPA may lower the risks of morbid-ity, especially CVD morbidity. Individuals in the highest tertile of MVPA, median 54 min per day, had 35% lower risk of being diagnosed with any of the included diseases
Table 1 Baseline characteristics for the whole sample and by group of participants, without and with at least one registered diagnosis of cardiovascular disease, type-2 diabetes, obesity, stroke, cancer, dementia, or depression from an in- or outpatient hospital visit during the 15-year follow-up time
Variables All No registered diagnosis With registered diagnosis n = 1220 n = 878 n = 342 Sex, women 666 (55%) 471 (54%) 195 (57%) Agea, years 45.3 (±14.5) 41.5 (±13.3) 54.9 (±12.8) Smokerc 290 (24%) 206 (23%) 84 (25%) Educationa,c < High school 281 (23%) 150 (17%) 131 (38%) High school 558 (46%) 442 (51%) 116 (34%) University degree 377 (31%) 283 (32%) 94 (28%) History of diseasea,b,c 211 (17%) 103 (12%) 108 (32%) Physical activity Sedentary time, min/day 491.9 (±91.9) 490.0 (±94.0) 496.8 (±86.3) Light-intensity PAa, min/day 339.5 (±94.9) 343.4 (±95.6) 329.5 (±92.7) Moderate-to-vigorous PAa, min/day 33.5 (±29.5) 35.4 (±26.9) 28.8 (±34.8) Total activity counts/daya (thousands) 321.0 (±195.9) 331.8 (±162.7) 293.2 (±260.8)
Values presented are mean (±SD) or number (%).aDifference between participants without and with registered diagnose calculated using Student’s t-test and chi-2 test p < 0.05.b
Self-reported current or previous hypertension, cardiovascular disease, diabetes, cancer, arthritis or emphysema at baseline. c
Missing data: smoker, n = 5; education, n = 4; history of disease n = 13 PA physical activity
Table 2 Median (min-max) time/counts, number of participants and number of events for different PA intensities and total activity counts by tertiles (n = 1220)
Tertile 1 Tertile 2 Tertile 3 Sedentary time, min/day 402 (188–454) 494 (455–529) 578 (530–785) Participants/ events,n 407/102 407/119 406/121 Light-intensity PA, min/day 251 (9–295) 337 (296–378) 433 (379–794) Participants/events,n 407/121 407/127 406/64 Moderate-to-vigorous PA, min/day 12 (0–19) 28 (20–38) 54 (39–501) Participants /events,n 411/160 404/103 405/79 Total activity counts/day,
thousands
200 (6–250) 300 (251–343) 433 (350–429) Participants/events,n 411/159 405/98 404/85
PA physical activity
Table 3 Associations between physical activity and sedentary time and combined morbidity, i.e. registered hospital visits due to any of the included diagnoses (cardiovascular disease, cancer, type 2-diabetes, dementia, obesity or depression), for participants without reported heart disease, cancer or diabetes at baseline
Combined morbidity Model 1 Model 2 Model 3
n = 1132 / 286 events HR 95% CI HR 95% CI HR 95% CI Sedentary time Tertile 1 1 1 1 Tertile 2 1.33 1.00, 1.76 1.07 0.81, 1.42 1.07 0.80, 1.42 Tertile 3 1.24 0.91, 1.68 1.19 0.88, 1.62 1.18 0.87, 1.61 Light-intensity PA Tertile 1 1 1 1 Tertile 2 1.11 0.83, 1.47 1.07 0.80, 1.42 1.08 0.81, 1.43 Tertile 3 0.89 0.67, 1.19 0.90 0.67, 1.20 0.90 0.67, 1.21 Moderate-to-vigorous PA Tertile 1 1 1 1 Tertile 2 0.64 0.49, 0.84 0.90 0.68, 1.19 0.90 0.68, 1.20 Tertile 3 0.44 0.32, 0.59 0.64 0.48, 0.87 0.65 0.48, 0.88 Total activity counts
Tertile 1 1 1 1
Tertile 2 0.90 0.68, 1.20 0.94 0.71, 1.25 0.94 0.71, 1.25 Tertile 3 0.54 0.41, 0.73 0.64 0.48, 0.86 0.64 0.48, 0.86
Cox proportional-hazard models were used to estimate hazard ratios (HR) with 95% confidence intervals (CI). Model 1: crude. Model 2: adjusted for age, sex, smoking (missing = 5), and education (missing = 4). Model 3: adjusted for model 2 variables plus hypertension and arthritis (missing = 13) at baseline. All models for sedentary time additionally adjusted for wear time. Statistically significant results shown in bold
PA physical activity
Table 4 Associations between physical activity and cardiovascular disease and cancer for participants without reported heart disease at baseline and without reported cancer at baseline respectively
Cardiovascular disease Model 1 Model 2 Model 3 Cancer Model 1 Model 2 Model 3 n= 1,176 / 139 events HR 95% CI HR 95% CI HR 95% CI n=1,181 / 161 events HR 95% CI HR 95% CI HR 95% CI Sedentary time Sedentary time
Tertile 1 1 1 1 Tertile 1 1 1 1 Tertile 2 1.41 0.91, 2.17 1.06 0.68, 1.65 1.05 0.68, 1.64 Tertile 2 1.56 1.05, 2.30 1.34 0.90, 1.99 1.35 0.91, 2.00 Tertile 3 1.85 1.20, 2.85 1.55 1.00, 2.40 1.41 0.91, 2.20 Tertile 3 1.43 0.95, 2.16 1.37 0.90, 2.07 1.37 0.91, 2.08 Light-intensity PA Light-intensity PA Tertile 1 1 1 1 Tertile 1 1 1 1 Tertile 2 0.93 0.63, 1.37 0.98 0.66, 1.45 1.03 0.70, 1.53 Tertile 2 1.26 0.88, 1,82 1.18 0.82, 1.70 1.17 0.81, 1.69 Tertile 3 0.67 0.44, 1.03 0.85 0.55, 1.31 0.92 0.60, 1.42 Tertile 3 0.83 0.55, 1,24 0.88 0.58, 1.33 0.87 0.58, 1.32 Moderate-to-vigorous PA Moderate-to-vigorous PA Tertile 1 1 1 1 Tertile 1 1 1 1 Tertile 2 0.46 0.31, 0.68 0.74 0.49, 1.12 0.77 0.52, 1.19 Tertile 2 0.72 0.50, 1.04 1.13 0.78, 1.65 1.14 0.78, 1.67 Tertile 3 0.33 0.21, 0.51 0.50 0.32, 0.78 0.52 0.33, 0.82 Tertile 3 0.60 0.41, 0.88 0.99 0.67, 1.47 0.95 0.67, 1.48 Total activity counts Total activity counts
Tertile 1 1 1 1 Tertile 1 1 1 1
Tertile 2 0.56 0.37, 0.83 0.66 0.44, 0.99 0.70 0.46, 1.05 Tertile 2 0.89 0.62, 1.27 1.00 0.69, 1.44 1.00 0.69, 1.44 Tertile 3 0.50 0.23, 0.76 0.64 0.41, 0.98 0.67 0.44, 1.04 Tertile 3 0.66 0.44, 0.98 0.86 0.57, 1.29 0.86 0.57, 1.29 Cox proportional-hazard models were used to estimate hazard ratios (HR) with 95% confidence intervals (CI)
Model 1: crude. Model 2: adjusted for age, sex, smoking (missing=5), and education (missing=4). Model 3: adjusted for model 2 variables plus hypertension, diabetes, and arthritis (missing=13) at baseline. All models for sedentary time additionally adjusted for wear time. Statistically significant results shown in bold
and 48% lower risk of CVD than those in the lowest ter-tile, with only 12 min per day (median) in MVPA. This confirms the importance of MVPA found in prospective studies using self-reported PA and in accelerometry studies with shorter follow-up [1, 13, 25]. We found a higher risk of cancer among the most sedentary individ-uals and lower risk of cancer among those with the most MVPA and total activity counts in the crude models, but these associations were attenuated after adjusting for confounders. Complex associations of PA and cancer have previously been reported in studies of mortality [1,
22], and although the evidence for a causal link is strong for some cancers, the mechanisms by which PA affects the risk of developing cancer differ by cancer site and other influencing factors [26].
Accelerometry allows reliable investigation of associa-tions of morbidity with light-intensity PA which is hard to achieve when self-reports are used. Surprisingly, and in contrast to LaCroix et al. [11], we did not find associ-ations between light-intensity PA and risk of being diag-nosed with a chronic disease. Nor did Jefferis et al. [13] in a study on CVD risk, although recent studies have found that if sedentary time is replaced with light-intensity PA, such as everyday activities, the risk of mor-tality can be reduced [23,27].
In contrast to the consistent evidence that sedentary behavior is associated with all-cause, CVD and cancer
mortality [1,22, 27, 28] and increases the risk of devel-oping type-2 diabetes [1, 29], we found no associations between sedentary time and being diagnosed with a chronic disease. In this study a relatively low number of individuals were diagnosed type-2 diabetes and we were not able to perform separate calculations. A possible ex-planation is that patients with type-2 diabetes are mainly treated in primary health care in Sweden, and primary care is not yet covered in the National Patient Register.
Interestingly, even though we did not find that seden-tary time was associated with a higher risk of being diag-nosed with a chronic disease, we found that the most sedentary individuals had a more than doubled risk of more in-hospital days. Correspondingly, individuals with most light-intensity PA had half the risk compared with those with least light-intensity PA. These are novel find-ings and it would be interesting to further investigate these associations with use of other healthcare services, such as primary healthcare or medications costs.
Important strengths of this study are the long follow-up time and the highly reliable PA data. We collected data on morbidity from the Swedish National Patient Register, in which the main diagnosis is registered for 99% of all hospital in-patient admissions and 96% of all out-patient visits. The validity is high with 85–95% posi-tive predicposi-tive values of ICD codes from medical records [30]. We used device-based assessment of PA and
Table 5 Incidence rate ratio (IRR) with 95% confidence intervals (CI) for number of hospital visits including both in- and out-patient visits (n=1,220, 451 events) and number of in-hospital days
Hospital visits Model 1 Model 2 Model 3 In-hospital days Model 1 Model 2 Model 3 IRR 95% CI IRR 95% CI IRR 95% CI IRR 95% CI IRR 95% CI IRR 95% CI Sedentary time Sedentary time
Tertile 1 1 1 1 Tertile 1 1 1 1 Tertile 2 1.24 0.79, 1.95 0.77 0.50, 1.19 0.77 0.49, 1.19 Tertile 2 2.36 1.21, 4.63 2.51 1.34, 4.71 2.47 1.32, 4.63 Tertile 3 1.55 0.98, 2.44 1.05 0.67, 1.65 1.05 0.67, 1.64 Tertile 3 2.38 1. 20, 4.74 2.14 1.11, 4.12 2.02 1.05, 3.89 Light-intensity PA Light-intensity PA Tertile 1 1 1 1 Tertile 1 1 1 1 Tertile 2 0.81 0.52,1.28 0.96 0.62, 1.48 0.98 0.63, 1.52 Tertile 2 0.67 0.34,1.31 0.84 0.45, 1.58 0.87 0.46, 1.63 Tertile 3 0.58 0.37, 0.92 0.89 0.57, 1.40 0.91 0.58, 1.43 Tertile 3 0.35 0.18, 0.68 0.45 0.24, 0.86 0.49 0.26, 0.93 Moderate-to-vigorous PA Moderate-to-vigorous PA Tertile 1 1 1 1 Tertile 1 1 1 1 Tertile 2 0.77 0.49, 1.22 1.23 0.78, 1.97 1.24 0.77, 1.98 Tertile 2 0.52 0.27, 1.02 1.11 0.58, 2.13 1.07 0.56, 2.06 Tertile 3 0.60 0.38, 0.94 1.07 0.68, 1.69 1.07 0.67, 1.71 Tertile 3 0.44 0.22, 0.85 1.08 0.56, 2.10 1.08 0.56, 2.10 Total activity counts Total activity counts
Tertile 1 1 1 1 Tertile 1 1 1 1
Tertile 2 0.56 0.36, 0.88 0.55 0.36, 0.84 0.56 0.37, 0.85 Tertile 2 0.44 0.23, 0.86 0.74 0.40, 1.38 0.76 0.41, 1.42 Tertile 3 0.49 0.31, 0.77 0.78 0.50, 1.20 0.78 0.50, 1.21 Tertile 3 0.35 0.18, 0.69 0.86 0.45, 1.64 0.89 0.47, 1.69
Model 1: crude. Model 2: adjusted for age, sex, smoking (missing=5), and education (missing=4). Model 3: adjusted for model 2 variables plus hypertension, diabetes, and arthritis (missing=13) at baseline. All sedentary models additionally adjusted for wear time. Statistically significant results shown in bold PA physical activity
sedentary time with high wear time compliance; a vast majority of our sample had at least four days of recording.
Our study also has several limitations that should be mentioned. The ABC study sample was nationally repre-sentative, but as in any study the participants may be healthier and more physically active than the general population. Still, the sample retained a wide range of PA and sedentary behavior levels suggesting that these behaviors were not likely to have introduced bias. Morbidity at baseline was self-reported and thereby less reliable, and information about history of depression and dementia were lacking. Even though the sensitivity analyses excluding diagnoses registered the first three years of follow-up did not change the results, reverse causation is still possible, especially for dementia due to the long preclinical phase [31]. We adjusted for several relevant factors, but as in any observational study, our results may be subject to residual confounding. For ex-ample, we did not have information about diet and alco-hol consumption, or mobility restrictions.
Despite the accurate information accelerometers can provide about levels and patterns of PA, there are also some methodological limitations: the analyses rely on the chosen cutoff points for classification of intensities [32] and some types of PA cannot be captured, such as upper body movements, biking and swimming [33]. In addition, the ActiGraph records body movement and not postures, and consequently our sedentary time measure may include standing time [34]. As an alterna-tive to intensity classified PA we also used total activity counts per day. Total activity counts provide a measure of accumulated total volume of PA not relying on cutoff points [20]. Total PA contributes to health benefits [1], and recent research using device-measured PA have sug-gested that total PA may be more important for redu-cing CVD risks than MVPA [13, 25]. PA was only assessed at baseline and we do not have information about possible changes in PA habits or sedentary behav-ior during follow-up that may have influenced the ob-served associations. However, the results from an ABC sub study showed that PA levels were unchanged from 2001 to 2008, suggesting that potential changes are small and will not have a major impact on our results [15].
Finally, it is possible that some results are due to lack of power and more studies with larger sample sizes are needed.
Conclusion
This study supports the importance of MVPA for pre-venting chronic disease that requires hospital care, espe-cially CVD. The associations were more complex for cancer. High volumes of sedentary behavior may in-crease the risk of future hospitalization. Physically active individuals had fewer hospital visits, whereas more
sedentary time doubled the risk of spending more days in hospital. Our results support the public health mes-sage “sit less and move more”, which is especially im-portant for the least physically active individuals, and have the potential of reducing both individual and soci-etal burden of disease.
Supplementary information
Supplementary information accompanies this paper athttps://doi.org/10. 1186/s12966-019-0878-2.
Additional file 1: Figure S1. Kaplan-Meier survival curves showing risk of having a registered hospital visit due to either cardiovascular disease, type-2 diabetes, obesity, stroke, cancer, dementia, or depression; or the risk of combined morbidity (events from all examined diagnoses included in the analysis) by moderate-to-vigorous intensity physical activity (MVPA) tertiles.
Additional file 2: Table S1. Associations between physical activity and sedentary time and registered hospital visits due to combined cardiovascular disease (CVD), cancer and type 2-diabetes for participants without reported heart disease, cancer or diabetes at baseline.
Abbreviations
CI:Confidence interval; CVD: Cardiovascular disease; HR: Hazard ratio; IRR: Incidence rate ratio; MVPA: Moderate-to-vigorous physical activity; PA: Physical activity; SD: Standard deviation
Acknowledgements
The authors would like to thank the study participants and Associate Professor Michael Sjöström for initiating and leading the Attitude, Behaviour and Change study.
Authors’ contributions
IMD designed the study, performed the analyses, interpreted the data and wrote the manuscript. MH collected the data, designed the study, interpreted the data and contributed to the writing of the manuscript. AKW contributed to the interpretations of the data and the writing of the manuscript. All authors read and approved the final manuscript.
Funding
The original ABC-study was funded by Stockholm County Council, the Swed-ish National Centre for Research in Sports and the project ALPHA, which re-ceived funding from the European Union in the framework of the Public Health Programme (agreement 2006120). This specific study has been funded by a research grant from Folksam Insurance, Sweden. Ing-Mari Dohrn has a postdoctoral fellowship funded by Strategic Research Area Health Care Science, Karolinska Institutet.
Availability of data and materials
The datasets analyzed during the current study available from the corresponding author on reasonable request.
Ethics approval and consent to participate
The study was approved by the ethics committee at the Karolinska Institutet (Dnr 378/02, 2012/707 31/1, 2015 1578/32). All participants provided written informed consent, and all procedures were in accordance with the 1964 Helsinki declaration and its later amendments or comparable ethical standards.
Consent for publication Not applicable. Competing interests
Author details
1Department of Neurobiology, Care Sciences and Society (NVS), Karolinska
Institutet, Aging Research Center, Tomtebodavägen 18A, SE-171 65 Solna, Sweden.2Functional Area Occupational Therapy and Physiotherapy, Karolinska University Hospital, SE-171 76 Solna, Sweden.3Department of
Neurobiology, Care Sciences and Society (NVS), Karolinska Institutet, Division of Physiotherapy, Alfred Nobels allé 23, SE-141 52 Huddinge, Sweden.
4
Department of Health Promoting Science, Sophiahemmet University, Valhallavägen 91, SE-114 86 Stockholm, Sweden.
Received: 5 June 2019 Accepted: 6 November 2019
References
1. Powell KE, King AC, Buchner DM, Campbell WW, DiPietro L, Erickson KI, et al. The Scientific Foundation for the physical activity guidelines for Americans, 2nd edition. J Phys Act Health. 2018:1–11.
2. Copeland JL, Ashe MC, Biddle SJ, Brown WJ, Buman MP, Chastin S, et al. Sedentary time in older adults: a critical review of measurement, associations with health, and interventions. Br J Sports Med. 2017;51:1539. 3. Whitaker KM, Pettee Gabriel K, Buman MP, Pereira MA, Jacobs DR Jr, Reis JP,
et al. Associations of accelerometer-measured sedentary time and physical activity with prospectively assessed Cardiometabolic risk factors: the CARDIA study. J Am Heart Assoc. 2019;8:e010212.
4. Sari N. Physical inactivity and its impact on healthcare utilization. Health Econ. 2009;18:885–901.
5. Garcia-Aymerich J, Lange P, Benet M, Schnohr P, Anto JM. Regular physical activity reduces hospital admission and mortality in chronic obstructive pulmonary disease: a population based cohort study. Thorax. 2006;61:772–8. 6. Wang F, McDonald T, Reffitt B, Edington DW. BMI, physical activity, and
health care utilization/costs among Medicare retirees. Obes Res. 2005;13: 1450–7.
7. Hagstromer M, Troiano RP, Sjostrom M, Berrigan D. Levels and patterns of objectively assessed physical activity--a comparison between Sweden and the United States. Am J Epidemiol. 2010;171:1055–64.
8. Shiroma EJ, Lee IM. Physical activity and cardiovascular health: lessons learned from epidemiological studies across age, gender, and race/ethnicity. Circulation. 2010;122:743–52.
9. Atkin AJ, Gorely T, Clemes SA, Yates T, Edwardson C, Brage S, et al. Methods of measurement in epidemiology: sedentary behaviour. Int J Epidemiol. 2012;41:1460–71.
10. Troiano RP, McClain JJ, Brychta RJ, Chen KY. Evolution of accelerometer methods for physical activity research. Br J Sports Med. 2014;48:1019–23. 11. LaCroix AZ, Bellettiere J, Rillamas-Sun E, Di C, Evenson KR, Lewis CE, et al.
Association of Light Physical Activity Measured by Accelerometry and Incidence of Coronary Heart Disease and Cardiovascular Disease in Older Women. JAMA Netw Open. 2019;2(3):e190419.
12. Bellettiere J, LaMonte MJ, Evenson KR, Rillamas-Sun E, Kerr J, Lee IM, et al. Sedentary behavior and cardiovascular disease in older women: the objective physical activity and cardiovascular health (OPACH) study. Circulation. 2019 Feb 19;139(8):1036–46.
13. Jefferis BJ, Parsons TJ, Sartini C, Ash S, Lennon LT, Papacosta O, et al. Does total volume of physical activity matter more than pattern for onset of CVD? A prospective cohort study of older British men. Int J Cardiol. 2019; 278:267–72.
14. Fox KR, Ku PW, Hillsdon M, Davis MG, Simmonds BA, Thompson JL, et al. Objectively assessed physical activity and lower limb function and prospective associations with mortality and newly diagnosed disease in UK older adults: an OPAL four-year follow-up study. Age Ageing. 2015;44:261–8. 15. Hagstromer M, Kwak L, Oja P, Sjostrom M. A 6 year longitudinal study of
accelerometer-measured physical activity and sedentary time in Swedish adults. J Sci Med Sport. 2015;18:553–7.
16. Hagstromer M, Oja P, Sjostrom M. Physical activity and inactivity in an adult population assessed by accelerometry. Med Sci Sports Exerc. 2007;39:1502–8. 17. Wolff-Hughes DL, McClain JJ, Dodd KW, Berrigan D, Troiano RP. Number of
accelerometer monitoring days needed for stable group-level estimates of activity. Physiol Meas. 2016;37:1447–55.
18. Troiano RP, Berrigan D, Dodd KW, Masse LC, Tilert T, McDowell M. Physical activity in the United States measured by accelerometer. Med Sci Sports Exerc. 2008;40:181–8.
19. Matthews CE, Chen KY, Freedson PS, Buchowski MS, Beech BM, Pate RR, et al. Amount of time spent in sedentary behaviors in the United States, 2003-2004. Am J Epidemiol. 2008;167:875–81.
20. Bassett DR, Troiano RP, McClain JJ, Wolff DL. Accelerometer-based physical activity: total volume per day and standardized measures. Med Sci Sports Exerc. 2015;47:833–8.
21. Grambsch PM. Goodness-of-fit and diagnostics for proportional hazards regression models. Cancer Treat Res. 1995;75:95–112.
22. Dohrn IM, Sjostrom M, Kwak L, Oja P, Hagstromer M. Accelerometer-measured sedentary time and physical activity-a 15 year follow-up of mortality in a Swedish population-based cohort. J Sci Med Sport. 2018;21:702–7. 23. Dohrn IM, Kwak L, Oja P, Sjostrom M, Hagstromer M. Replacing sedentary
time with physical activity: a 15-year follow-up of mortality in a national cohort. Clin Epidemiol. 2018;10:179–86.
24. Pawitan Y. In all likelihood: statistical Modelling and inference using likelihood: Clarendon press 2013.
25. Wolff-Hughes DL, Fitzhugh EC, Bassett DR, Churilla JR. Total activity counts and Bouted minutes of moderate-to-vigorous physical activity: relationships with Cardiometabolic biomarkers using 2003-2006 NHANES. J Phys Act Health. 2015;12:694–700.
26. Brown JC, Winters-Stone K, Lee A, Schmitz KH. Cancer, physical activity, and exercise. Compr Physiol. 2012;2:2775–809.
27. Schmid D, Ricci C, Baumeister SE, Leitzmann MF. Replacing sedentary time with physical activity in relation to mortality. Med Sci Sports Exerc. 2016;48: 1312–9.
28. Matthews CE, Keadle SK, Troiano RP, Kahle L, Koster A, Brychta R, et al. Accelerometer-measured dose-response for physical activity, sedentary time, and mortality in US adults. Am J Clin Nutr. 2016;104:1424–32.
29. Wilmot EG, Edwardson CL, Achana FA, Davies MJ, Gorely T, Gray LJ, et al. Sedentary time in adults and the association with diabetes, cardiovascular disease and death: systematic review and meta-analysis. Diabetologia. 2012; 55:2895–905.
30. Ludvigsson JF, Andersson E, Ekbom A, Feychting M, Kim JL, Reuterwall C, et al. External review and validation of the Swedish national inpatient register. BMC Public Health. 2011;11:450.
31. Sabia S, Dugravot A, Dartigues JF, Abell J, Elbaz A, Kivimaki M, et al. Physical activity, cognitive decline, and risk of dementia: 28 year follow-up of Whitehall II cohort study. BMJ. 2017;357:j2709.
32. Bassett DR Jr, Rowlands A, Trost SG. Calibration and validation of wearable monitors. Med Sci Sports Exerc. 2012;44(Suppl 1):32–8.
33. Corder K, Brage S, Ekelund U. Accelerometers and pedometers:
methodology and clinical application. Curr Opin Clin Nutr Metab Care. 2007; 10:597–603.
34. Koster A, Shiroma EJ, Caserotti P, Matthews CE, Chen KY, Glynn NW, et al. Comparison of sedentary estimates between activPAL and hip- and wrist-worn ActiGraph. Med Sci Sports Exerc. 2016;48:1514–22.
Publisher’s Note
Springer Nature remains neutral with regard to jurisdictional claims in published maps and institutional affiliations.