J.O. Liljenzin
April 1990
Some Estimates of the Total Nuclide
Inventory in the Year 2100 from
Swedish Nuclear Power Production
SKI Technical Report 90:18
STATENS KÄRNKRAFTINSPEKTION Swedish Nuclear Power Inspectorate
Some Estimates of the Total Nuclide Inventory in the Year 2100 from Swedish Nuclear Power Production
J. O. Lilj enzin SKI TR 90:18
Institutionen fOr Kfu"nkemi Chalmers Tekniska Hogskola
April 1990
This report concerns a study which has been conducted for the Swedish Nuclear Power Inspectorate (SKI). The conclusions and viewpoints presented in the report are those of the author(s) and do not necessarily coincide with those of the SKI. The results will be used in the formulation of the
Inspectorate's policy, but the views expressed the report do not necessarily represent this policy.
INSTITUTIONEN FOR KARNKEMI CHALMERS TEKNISKA HOGS KOLA
SOME ESTIMATES OF THE TOTAL NUCLIDE INVENTORY IN THE YEAR 2100 FROM SWEDISH NUCLEAR POWER PRODUCTION
by
J. O. Liljenzin
SUMMARY
The total nuclide inventory in spent fuel from the swedish nuclear power programme has been estimated for three cases.
1. All reactors were arrumed to operate until the year 2010 and then shut down simultaneously. All fuel used was assumed to be based on enriched natural uranium.
2. The reactors were assumed to shut down after 25 years of
commercial operation, but not later than in the year 2010. Also in this case all fuel was assumed to be based on natural
uranium.
3. All reactors were assumed to operate until the year 2010 and shut down simultaneously. Fuel for two large boiling water reactors, F3 and 03, was assumed to be based mainly on reenriched uranium from reprocessed LWR fuel after 1995.
In addition some yearly production rates are compared for standard natural uranium fuel and re-enriched recycled uranium from repro-cessing of spent fuel.
The main effort was concentrated on obtaining good estimates for the heavy element content in spent fuel. The fission product
inventories were obtained in a less stringent way by interpolation in available tables computed for enriched natural uranium based fuel only and at a few typical burnup values.
Burnup calculations were made using the code, BURNUP, originally developed for actinide recycle and burnup calculations. The cross section and decay library was updated and the results from the code were validated by comparing the results for a test case with
published results from the CASMO, BEGAFIP and ORIGEN codes for the same case. The agreement was satisfactory.
Data on average burnup, enrichment and unloaded fuel for past years were assembled from tables published in various reports. The future development was extrapolated from current trends in enrichment and burnup. Fuel from shut down reactors in the 25 years of operation scenario was assumed to be transferred to the still operating reactors as far as reasonable with regard to fuel compatability, enrichment and burnup.
The composition of recovered uranium from reprocessing of LWR fuel was assumed to be the typical uranium isotope mixture computed by ORIGEN for a PWR fuel with 33 MWd/kg burnup. The effect of uranium
reenrichment on isotopic composition was computed by means of a code, ANRlKA, developed for this purpose. The proper working of ANRlKA was tested by comparing its results with some published values. Almost identical results were obtained for all cases.
Data on the composition of unloaded fuel for each reactor and year of operation were recalculated to the mid of year 2100 using the GDF code and summed nuclide by nuclide for all years and reactors to obtain the final inventory for each of the three scenarios.
1. INTRODUCTION
The swedish nuclear power programme is usually assumed to end not later than in the year 2010. Sweden has also deferred reprocessing of spent fuel and plans to store the unreprocessed fuel in a final repository. This makes i t possible to estimate the total inventory of spent nuclear fuel and its composition within some limits given by the possible scenarios in the given time frame.
The aim of the present work was to estimate the total nuclide
inventory in the final repository taking a few likely developments into account such as different shut down schedules for the swedish reactors and expected fuel development. The resulting data should be useful for preliminary safety evaluation exercises.
According to present plans, the final repository will be operated between the years 2020 and 2060. Hence, a suitable date for the
inventory was assumed to be 2100. Before this time most of the radio nuclides with short and moderate halflives will have decayed away, exceptions being those with longlived precursors.
2. FUEL BURNUP
Most calculations of nuclide inventories for spent power reactor fuel have assumed rather low specific burnup values. Typical data are 27 MWd/kg initial heavy metal, IBM, and 33 MWd/kg IHM for BWR:s and PWR:s respectively. Today, the typical burn up values are much higher. Values of 35 to 40 MWd/kg IHM are common for modern BWR fuel
(1). Similarly the average burnup of PWR fuel has increased to between 40 and 50 MWd/kg IHM (1). The design goal for the new SVEA-96 and SVEA-100 fuels for BWR:s is about 45 MWd/kg IBM average burnup (2). The current design goal for PWR:fuel is even higher, about 60 MWd/kg IHM (3).
The increased burn up is usual-Iy accomplished by using higher initial enrichment, graded enrichment along fuel pins and between fuel pins
in each fuel element, inclusion of burnable poison in the pins and by use of more and thinner pins in a fuel bundle etc. This is
exemplified by the development of BWR fuel from the classical 8x8 pin grid to 9x9 and to 10x10 grids with correspondingly thinner pins. These factors complicates a detailed calculation of fuel
burnup to a high degree, especially since the reactor cores all the time will contain a mixture of different fuel types of varying age and history. To make the present calculations feasable i t was
necessary to make the simplifying assumption that each batch of fresh fuel was unloaded simultaneously after receiving the same burnup.
The enrichment necessary to obtain the desired burnup was estimated from diagrams for Westinghouse PWR:s operated with zone-scatter
refueling given by Pigford et al. (4). The curves were assumed to be shifted in such a way that each swedish reactor could operate in the way i t does with its current fueling scheme and then used to predict future enrichment needs. Of cource, this procedure is very
approximate, especially for the BWR:s, and the initial average enrichments needed in future fuel batches are correspondingly
along and between individual fuel pins makes the use of average
enrichent data and burnup calculations based on these somewhat
questionable.
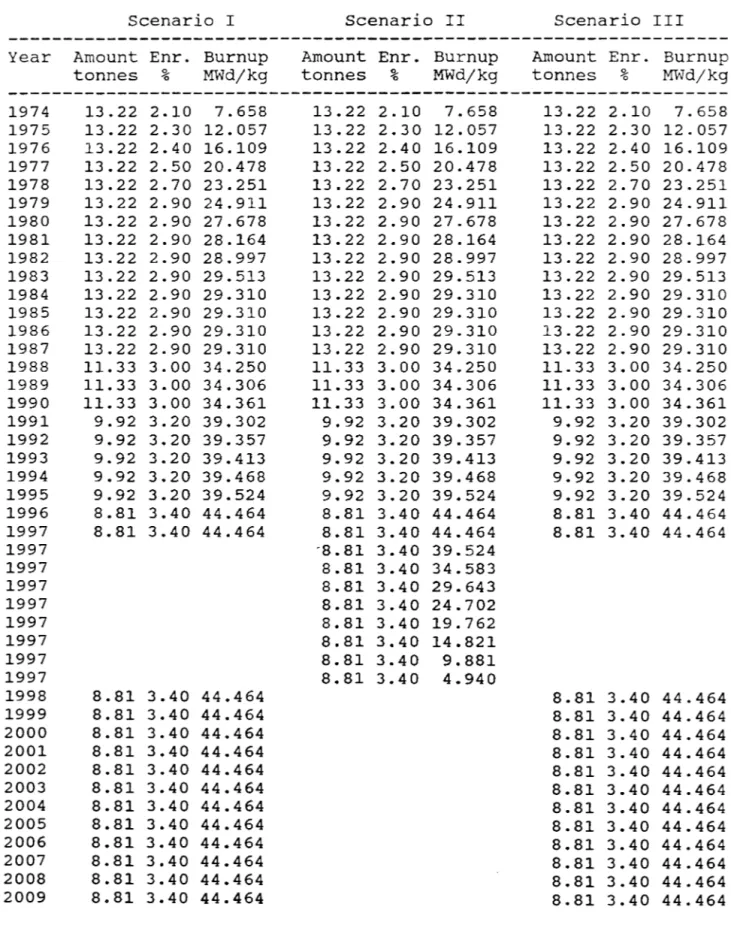
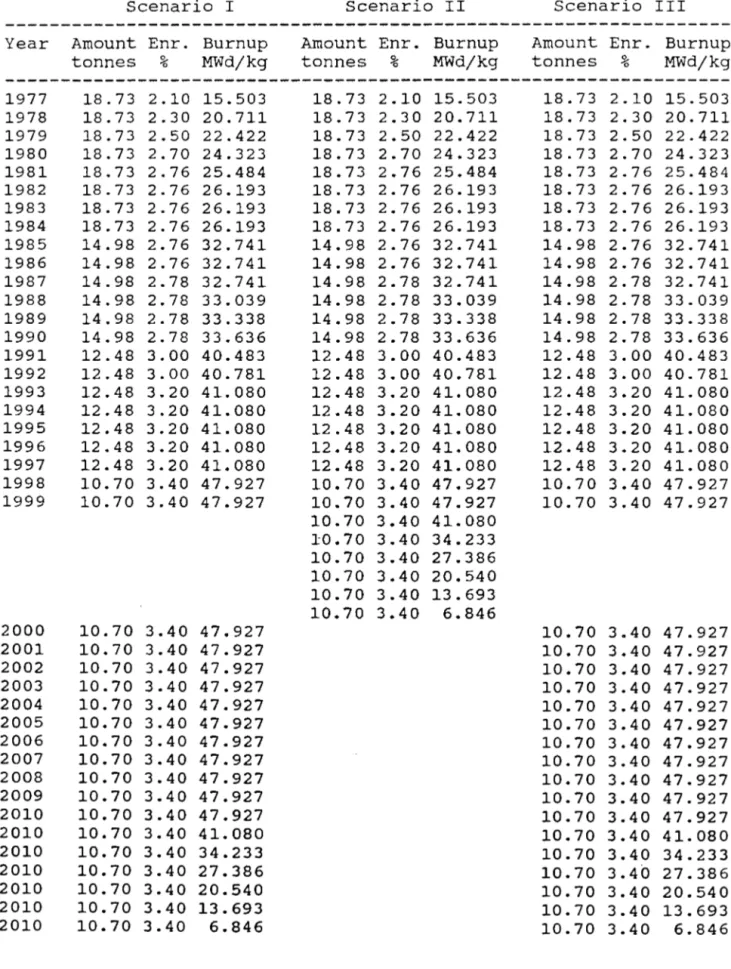
Tables 2 to 13 contain the amount of yearly unloaded fuel, its
initial enrichment and average burnup for each of the twelve swedish
power reactors when operating up to the year 2010. The average
burnups were calculated with a spreadsheet programme from refueling
cycle length, initial enrichment and expected average yearly
electricity production. Average data for the expected total load
factors, 0.78 for BWR:s and 0.73 for PWR:s, were taken from
reference (1). The number of significant figures for data in this
report is considerably less than the number of figures given in the
tables, but no rounding was made as these data were used, or
intended for use, as input to further calculations.
3. RECYCLING OF URANIUM
Large scale recovery of uranium from spent fuel has been carried out
for many years, mainly in the UK. Current estimates give the amount
of recovered uranium as
>30 000 tonnes, mainly from spent Magnox
and GCR fuel. BNFL has stated that more than 15 000 tonnes of this
uranium have been re-enriched and fabricated into new fuel, mainly
for AGR:s (5). France has also recycled more than 5 000 tonnes of
uranium (5). Some of these recycling operations also include the
fabrication of LWR fuel, see Figure 1. However, it is unknown how
much recycled uranium actually goes into production of LWR fuel.
Furthermore, UK, France, Germany, Japan, India and the Soviet Union
have special plants for handling of recycled uranium and are using
or have firm plans to use recovered uranium as LWR fuel. Recycled
uranium has also been re-enriched in the US as there are reports
mentioning doses to workers from technetium in some US gaseous
diffusion plants. It is also known that UF6 manufactured by Comurhex
from recovered uranium has been returned to the US (6). (Technetium
is always present as an impurity in recovered uranium.) The special
facility for production of UF6 from recycled uranium at Pierrelatte
operated 1988 at a capacity of 350 tonnes U/year (6) and larger
plants are under construction in the UK and in the Soviet union.
Recovered uranium from reprocessing of spent fuel consists of a
series of uranium isotopes, i.e. U-232, U-233, U-234, U-235, U-236
and U-238, all in significant quantities. To be able to compute the
isotopic composition after re-enrichment i t was necessary to develop
a computer code, ANRlKA, that could optimize an isotope separation
plant for a mixture of many isotopes and compute the composition of
its product from a given feed. ANRlKA is based on the key-weight
concept (7, 8) and designs a plant either for a minimum cost product
or for a specified tails content of U-235.
The content of U-236 in re-enriched uranium necessitates the use of
a correspondingly higher enrichment. ANRlKA uses the equivalent
enrichment concept as described by Gresley and Kehoe (9).
The major drawback from recycled re-enriched uranium is the rather
fast buildup of gamma emmitting daughters to U-232 which makes it
mandatory to reduce storage time for uranium and fuel as much as
possible to avoid shielded handling.
The isotopic composition of recycled uranium was assumed to be that
of a typical spent PWR fuel with initial enrichment 3.3% and an
average burnup of 33 MWd/kg IHM. Second generation recycled uranium
was not considered, nor uranium recovered from MOX fuel or breeder
blankets.
Table 1 shows examples of the isotopic composition in re-enriched
uranium as function of equivalent enrichment assuming an U-236
penalty factor of 0.3.
In the current analysis it was assumed that recycled and re-enriched
uranium enters the swedish fuel supply system at about 1995 and
mainly is used to prepare fuel for two of our large BWR:s, F3 and
03, see tables 2 to 13.
4. BURNUP CALCULATIONS
The BURNUP program was originally developed in the early seventies
for used in conjunction with the AKA program and further developed
in the late seventies for use in the minor actinide burnup
calcula-tions required by a research project for actinide separation and
transmutation. Some remarks on this code and its library are given
below.
As the cross section and decay libraries were more than 10 years
old, they were checked and updated using data from several sources
(~
10 and 11). To test the program and its updated library the
composition of a reference fuel described in ref. 12 was computed.
The resulting composition was then compared to the corresponding
published results obtained by the CASMO, BEGAFIP and ORIGEN codes,
see table 14. As can be seen from this table the results from BURNUP
compare fairly well with those from the other codes, especially if
it is recognized that some parameters and cross sections were
adjusted in the BEGAFIP and ORIGEN runs to obtain more realistic
results.
Cross sections are computed at the start of each irradiation cycle
using two neutron energy groups and the same type of modified
westcott formalism as used in BEGAFIP. Self shielding corrections
are applied for the major actinides using a modified version of the
empirical correlation employed in BEGAFIP. Fission energies for the
actinides are computed using a correlation between A, Z and E(fiss)
adopted from ORIGEN-2.
The BURNUP code uses a linear time approximation to solve the system
of differential equations, i.e. the amounts of all other nuclides
than the one being computed and the neutron flux are assumed to vary
linearly with time within the current time step and the differential
equation for the nuclide being considered is then possible to
integrate analytically giving a better guess of the current amount.
This procedure is performed iteratively for all nuclides until a
donsistent set of nuclide concentrations and neutron flux at the end
of the current time step is obtained. For a typical timestep, less
than one hour, the calculation converges already after about three
iterations. The procedure used makes i t simple to include alpha
decays between the actinide isotopes, corresponding to closed loops
in the s-process, which may give computation difficulties in many
other codes. On the other hand, the accuracy at short times of the
amount of shortlived nuclides is relatively poor.
The fuel is assumed to operate with a prescribed specific power
level for a specified length of time. The total fission rate is then
computed from the prescribed power density in the fuel and
indirectly yields the neutron flux for the current fuel composition.
This means that the neutron flux increases with burnup for the
considered fuel types.
The burnup calculations were performed for a matrix of specific
burnups (MWd/kg IHM corresponding to about one year of operation
including summer recess) and initial enrichments in steps of
0.3%assuming natural or recycled uranium based fuel. To save time and
reduce the size of the generated data sets, only the amounts of
heavy elements were computed and stored for the recycled uranium
cases. These groups of calculations were performed using typical
data for swedish BWR:s and PWR:s respectively, generating data sets
for spent BWR and PWR fuels.
5. FUEL COMPOSITION CALCULATIONS
A small code was written which read the appropriate fuel composition
matrix, interpolated these data to the desired initial enrichment
and final burnup. The resulting composition (g/metric tonne IHM) was
then multiplied by the amount of fuel (as metric tonnes IHM)
withdrawn from the reactor the actual year and saved as an
intermediate data set. In case of recycled uranium fuel, the fission
product amounts were interpolated from the corresponding matrix
valid for natural uranium based fuel. Hence, the fission product
amounts given for recycled uranium fuel are only zeroth order
approximations. The largest errors should be expected for nuclides
belonging to the low mass fission yield peak, see Figure
2.To reduce the volume of insignificant data, the amount of all
nuclides in each batch of unloaded fuel was recalculated to a common
date in the future, mid of the year
2100.This calculation
used acode GDF, originating from hazard index calculations for
reprocessing wastes. Output from this code is both amount and
activity of each nuclide. Amounts are given in grams and activities
in Bg.
6. INVENTORY FILES
The data files obtained are fairly large, a couple of megabytes for
each scenario. To reduce storage space, the fuelling data and
amounts of nuclides in the yearly spent fuel batches from each
reactor were compressed using the ARC code, see README.DOC files on
the data diskettes.
Three diskettes hold all the data generated in these calculations.
Each diskette contains data for one scenario. The respective files
are named NATULONG.ARC (natural uranium fuel, all reactors operating
until the year 2010), NATUSHRT.ARC (natural uranium fuel, all
and RECULONG.ARC (natural and recycled uranium fuel, all reactors operating until the year 2010).
Each file contains the separate data files for each reactor. The files Bl, B2, Fl, F2, F3, 01, 02, 03, Rl, R2, R3 and R4 contain the fuelling data for respective reactor and the given scenario using natural uranium based fuel. The 25 years of maximum operation
scenario involves reshuffling of some partially spent fuel to still operating reactors. The corresponding files for this scenario are designated B1SHRT, B2SHRT etc. Fuel and burnup data for two cases with re-enriched uranium fuel, F3 and 03, are available in the files F3RU and 03RU. The amounts of nuclides and their total activity in the year 2100 for each unloaded fuel batch is contained in files named XXUnnnnY.INV or XXRnnnnY.INV for natural uranium based fuel or recycled uranium based fuel respectively.
xx
is the reactor (B1, B2 etc) and nnnn is the year the fuel was unloaded (1981, 1982 etc). When more than one batch with a common burnup history was unloaded during a specific year Y is used to separate these (Y=
space first batch, Y=
A second batch, Y=
B third batch etc). One record is used per nuclide in these files. Each record begins with the nuclide designation (7 ASCII characters) followed by the amount in grams and the activity in bequerels (10 characters each in floating pointformat).
7. DATA EXTRACTION
To extract desired information for any scenario, begin by unpacking the corresponding file with the ARCE.COM code, see instructions in README.DOC file on the diskettes. As the resulting files occupy considerable disk space, they should be unpacked onto a hard disk. Then use any suitable wordprocessor or advanced spreadsheet program to view the files, to extract desired data or to make calculations based on these data.
8. TYPICAL RESULTS
Some typical results for a medium sized (F1) and a large (03) BWR and one PWR (R2) are given in tables 15, 16 and 17 in grams/tonne IHM and BgJtonne IHM. Nuclides with a very small concentration and an activity below 1 Bq were normally omitted.
To facilitate the use of statistical methods, minimum, average and maximum concentrations and specific activities are given in table 18, 19 and 20 for the total amount of spent fuel in 2100 and the three scenarios used in this report.
9. REFERENCES
1. SKB Plan 89 and SKB Plan 88.
2. S. Helmersson, H. Nerman and L. Paulsson, SVEA-96: BWR Fuel for the 1990s, Nuclear Europe, 1-2 (1989) 37.
3. C. Lewiner and R. Scharer, Mutual Influences of Reactor Opera-tion & Fuel cycle Management, Nuclear Europe, 1-2 (1989) 11. 4. M. Benedict, T. H. Pigford and H. W. Levi, Nuclear Chemical
Engineering, 2nd Ed, ISBN 0-07-004531-3, McGraw-Hill 1981. 5. R. K. Webster, Trends in reprocessing technology, Nuclear
Technology International 1988, 83.
6. J. P. Rougeau and L. F. Durret, UREP: Gateway to Uranium Recycling, Nuclear Europe, 1-2 (1988) 19.
7. A. de la Garza, Chem. Eng. Sci., 18 (1963) 73.
8. A. de la Garza, G. A. Garrett and J. E. Murphy, Chem. Eng. SeL I 15 (1961) 188.
9. J. A. B. Gresley and R. B. Kehoe, Uranium Recycling: the Value of Reprocessed Uranium[ Nuclear Europe 1-2 (1988) 11.
10. E. Browne, R. B. Firestone and V. S. Shirley, Table of Radio-active Isotopes, Wiley 1986.
11. A. G. Croff; R. L. Haese and N. B. Gove, Updated Decay and
Photon Libraries for the ORIGEN code, ORNL/TM-6055 (Feb. 1979). 12. G. Olsson, P. Hagglef och S. Svensson, BEGAFIP. Programvard,
utveck1ing och benchmarkberakningar, studsvik K2-80/383, 1980. 13. C. D. Forsey, Developments in BNFL's Uranium Recycle strategy,
Nuclear Europe, 1-2 (1988) 15.
14. J. R. Stanbridge, Oxide fuel design and manufacture in BNFL, Nuclear Technology International 1987, 112.
Table 1. Examples of the isotopic composition (%) of re-enriched uranium fuel for different equivalent enrichments. Feed was assumed to be recovered uranium from spent PWR fuel with an average burnup of 33 MWd/kg IHM. At a cost for natural uranium of 53 ~/Lb and a cost of recovered uranium of 5 %/kg, all cases shown below give a cheaper fuel from re-enriched uranium than from natural uranium feed even though handling, conversion and manufacturing costs are
considerably higher for the re-enriched fuel. These costs and various unit operation costs were taken from references 9 and 13.
Isotope Equivalent Enrichment (%)
2.2 2.6 3.0 3.4 3.8 4.2 4.6
U-232 7.84E-8 9.38E-8 1.09E-7 1. 25E-7 1. 40E-7 1. 56E-7 1. 71E-7 U-233 7.60E-7 9.09E-7 1. 06E-6 1.21E-6 1. 36E-6 1. 50E-6 1.66E-6 U-234 6.81E-2 8.12E-2 9.42E-2 1.07E-1 1. 20E-1 1. 33E-1 1.47E-1 U-235 2.48E+0 2.92E+0 3.37E+0 3.81E+0 4.25E+0 4.68E+0 5.13E+0 U-236 9.70E-1 1.11E+0 1. 25E+0 1.38E+0 1. 51E+0 1.65E+0 1. 78E+0 U-238 9.65E+1 9.59E+1 9.53E+1 9.47E+1 9.41E+1 9.35E+1 9.29E+1 Tails 0.25% U-235
Table 2. Fuelling data for Bl and the three scenarios considered. Scenarios; I: All reactors operate until mid of the year 2010. 11: Reactors shut down after 25 years of operation, but not later than mid 2010. Some unloaded fuel is redistributed to operating reactors. 111: Same as alternative I for this reactor.
Scenario I
Year Amount Enr. Burnup tonnes % MWd/kg 1977 1978 1979 1980 1981 1982 1983 1984 1985 1986 1987 1988 1989 1990 1991 1992 1993 1994 1995 1996 1997 1998 1999 2000 2000 2000 2000 2000 2000 2000 2001 2002 2003 2004 2005 2006 2007 2008 2009 2010 2010 2010 2010 2010 2010 2010 18.73 18.73 18.73 18.73 18.73 lS.73 18.73 18.73 14.98 14.98 14.98 14.98 14.98 14.98 14.98 14.98 12.48 12.48 12.48 12.48 12.48 12.48 10.70 10.70 10.70 10.70 10.70 10.70 10.70 10.70 10.70 10.70 10.70 10.70 10.70 10.70 10.70 10.70 10.70 10.70 2.10 2.10 2.30 2.50 2.70 2.70 2.70 2.70 2.70 2.70 2.76 2.76 2.78 2.78 3.00 3.00 3.20 3.20 3.20 3.20 3.20 3.20 3.40 3.40 3.40 3.40 3.40 3.40 3.40 3.40 3.40 3.40 3.40 3.40 3.40 3.40 3.40 3.40 3.40 3.40 12.243 18.494 22.329 22.998 24.860 24.812 24.812 24.812 31.015 31. 015 31. 015 31. 654 32.294 32.933 33.572 34.212 41. 054 41. 054 41. 054 41. 054 41. 054 41. 054 47.896 47.896 47.896 47.896 47.896 47.896 47.896 47.896 47.896 47.896 47.896 47.896 41. 054 34.212 27.369 20.527 13.684 6.842 scenario 11 Amount Enr. Burnup tonnes % MWd/kg 18.73 18.73 18.73 18.73 18.73 18.73 18.73 18.73 14.98 14.98 14.98 14.98 14.98 14.98 14.98 14.98 12.48 12.48 12.48 12.48 12.48 12.48 10.70 10.70 10.70 10.70 10.70 10.70 10.70 10.70 2.10 2.10 2.30 2.50 2.70 2.70 2.70 2.70 2.70 2.70 2.76 2.76 2.78 2.78 3.00 3.00 3.20 3.20 3.20 3.20 3.20 3.20 3.40 3.40 3.40 3.40 3.40 3.40 3.40 3.40 12.243 18.494 22.329 22.998 24.860 24.812 24.812 24.812 31. 015 31. 015 31. 015 31. 654 32.294 32.933 33.572 34.212 41. 054 41. 054 41.054 41. 054 41.054 41.054 47.896 47.896 41. 054 34.212 27.369 20.527 13.684 6.842 Scenario III Amount Enr. Burnup tonnes % MWd/kg 18.73 18.73 18.73 18.73 18.73 18.73 18.73 18.73 14.98 14.98 14.98 14.98 14.98 14.98 14.98 14.98 12.48 12.48 12.48 12.48 12.48 12.48 10.70 10.70 10.70 10.70 10.70 10.70 10.70 10.70 10.70 10.70 10.70 10.70 10.70 10.70 10.70 10.70 10.70 10.70 2.10 2.10 2.30 2.50 2.70 2.70 2.70 2.70 2.70 2.70 2.76 2.76 2.78 2.78 3.00 3.00 3.20 3.20 3.20 3.20 3.20 3.20 3.40 3.40 3.40 3.40 3.40 3.40 3.40 3.40 3.40 3.40 3.40 3.40 3.40 3.40 3.40 3.40 3.40 3.40 12.243 18.494 22.329 22.998 24.860 24.812 24.812 24.S12 31.015 31.015 31.015 31. 654 32.294 32.933 33.572 34.212 41. 054 41. 054 41. 054 41. 054 41. 054 41.054 47.896 47.896 47.896 47.896 47.896 47.896 47.896 47.896 47.896 47.896 47.896 47.896 41.054 34.212 27.369 20.527 13.684 6.842
Table 3. Fuelling data for B2 and the three scenarios considered. Scenarios; I: All reactors operate until mid of the year 2010. 11: Reactors shut down after 25 years of operation, but not later than mid 2010. Some unloaded fuel is redistributed to operating reactors.
I l l : Same as alternative I for this reactor.
Scenario I
Year Amount Enr. Burnup
tonnes % MWd/kg 1978 1979 1980 1981 1982 1983 1984 1985 1986 1987 1988 1989 1990 1991 1992 1993 1994 1995 1996 1997 1998 1999 2000 2001 2002 2002 2002 2002 2002 2002 2002 2003 2004 2005 2006 2007 2008 2009 2010 2010 2010 2010 2010 2010 2010 18.73 2.10 18.73 2.30 18.73 2.40 18.73 2.60 18.73 2.70 18.73 2.70 18.73 2.70 18.73 2.70 14.98 2.70 14.98 2.76 14.98 2.76 14.98 2.78 14.98 2.78 14.98 3.00 14.98 3.00 14.98 3.20 14.98 3.20 12.48 3.20 12.48 3.20 12.48 3.20 12.48 3.20 12.48 3.20 12.48 3.20 10.70 3.40 10.70 3.40 10.70 3.40 10.70 3.40 10.70 3.40 10.70 3.40 10.70 3.40 10.70 3.40 10.70 3.40 10.70 3.40 10.70 3.40 10.70 3.40 10.70 3.40 10.70 3.40 10.70 3.40 10.70 3.40 9.969 16.435 22.900 25.733 25.862 25.862 25.862 25.862 32.328 32.328 32.705 33.081 33.458 33.835 34.212 34.212 34.212 41. 054 41. 054 41. 054 41. 054 41. 054 41.054 47.896 47.896 47.896 47.896 47.896 47.896 47.896 47.896 47.896 47.896 41.054 34.212 27.369 20.527 13.684 6.842 Scenario 11 Amount Enr. Burnup
tonnes % MWd/kg 18.73 18.73 18.73 18.73 18.73 18.73 18.73 18.73 14.98 14.98 14.98 14.98 14.98 14.98 14.98 14.98 14.98 12.48 12.48 12.48 12.48 12.48 12.48 10.70 10.70 10.70 10.70 10.70 10.70 10.70 10.70 2.10 2.30 2.40 2.60 2.70 2.70 2.70 2.70 2.70 2.76 2.76 2.78 2.78 3.00 3.00 3.20 3.20 3.20 3.20 3.20 3.20 3.20 3.20 3.40 3.40 3.40 3.40 3.40 3.40 3.40 3.40 9.969 16.435 22.900 25.733 25.862 25.862 25.862 25.862 32.328 32.328 32.705 33.081 33.458 33.835 34.212 34.212 34.212 41. 054 41.054 41. 054 41. 054 41.054 41. 054 47.896 47.896 41.054 34.212 27.369 20.527 13.684 6.842 Scenario I I I
Amount Enr. Burnup
tonnes % MWd/kg 18.73 18.73 18.73 18.73 18.73 18.73 18.73 18.73 14.98 14.98 14.98 14.98 14.98 14.98 14.98 14.98 14.98 12.48 12.48 12.48 12.48 12.48 12.48 10.70 10.70 10.70 10.70 10.70 10.70 10.70 10.70 10.70 10.70 10.70 10.70 10.70 10.70 10.70 10.70 2.10 2.30 2.40 2.60 2.70 2.70 2.70 2.70 2.70 2.76 2.76 2.78 2.78 3.00 3.00 3.20 3.20 3.20 3.20 3.20 3.20 3.20 3.20 3.40 3.40 3.40 3.40 3.40 3.40 3.40 3.40 3.40 3.40 3.40 3.40 3.40 3.40 3.40 3.40 9.969 16.435 22.900 25.733 25.862 25.862 25.862 25.862 32.328 32.328 32.705 33.081 33.458 33.835 34.212 34.212 34.212 41. 054 41. 054 41. 054 41. 054 41. 054 41.054 47.896 47.896 47.896 47.896 47.896 47.896 47.896 47.896 47.896 47.896 41.054 34.212 27.369 20.527 13.684 6.842
Table 4. Fuelling data for F1 and the three scenarios considered. scenarios; I: All reactors operate until mid of the year 2010. 11: Reactors shut down after 25 years of operation, but not later than mid 2010. Some unloaded fuel is redistributed to operating reactors. Ill: Same as alternative I for this reactor.
Scenario I Year Amount Enr. Burnup
tonnes % MWd/kg 1983 1984 1985 1986 1987 1988 1989 1990 1991 1992 1993 1994 1995 1996 1997 1998 1999 2000 2001 2002 2003 2004 2005 2005 2005 2005 2005 2005 2005 2006 2007 2008 2009 2010 2010 2010 2010 2010 2010 2010 30.44 2.10 30.44 2.30 30.44 2.50 30.44 2.70 30.44 2.76 24.35 2.76 24.35 2.76 20.30 2.78 20.30 2.78 20.30 2.78 20.30 3.20 20.30 3.20 20.30 3.20 20.30 3.20 20.30 3.20 20.30 3.20 20.30 3.20 17.40 3.40 17.40 3.40 17.40 3.40 17.40 3.40 17.40 3.40 17.40 3.40 17.40 3.40 17.40 3.40 17.40 3.40 17.40 3.40 17.40 3.40 17.40 3.40 17.40 3.40 17.40 3.40 17.40 3.40 17.40 3.40 17.40 3.40 20.239 26.543 26.543 26.543 26.543 33.398 33.616 40.471 40.690 40.908 41.127 41.127 41.127 41.127 41.127 41.127 41.127 47.982 47.982 47.982 47.982 47.982 47.982 47.982 47.982 47.982 47.982 47.982 41.127 34.273 27.418 20.563 13.709 6.854 Scenario 11 Amount Enr. Burnup tonnes % MWd/kg 30.44 30.44 30.44 30.44 30.44 24.35 24.35 20.30 20.30 20.30 20.30 20.30 20.30 20.30 20.30 20.30 20.30 17.40 17.40 17.40 17.40 17.40 17.40 17.40 17.40 17.40 17.40 17.40 17.40 2.10 2.30 2.50 2.70 2.76 2.76 2.76 2.78 2.78 2.78 3.20 3.20 3.20 3.20 3.20 3.20 3.20 3.40 3.40 3.40 3.40 3.40 3.40 3.40 3.40 3.40 3.40 3.40 3.40 20.239 26.543 26.543 26.543 26.543 33.398 33.616 40.471 40.690 40.908 41.127 41.127 41.127 41.127 41.127 41.127 41.127 47.982 47.982 47.982 47.982 47.982 47.982 41.127 34.273 27.418 20.563 13.709 6.854 scenario III Amount Enr. Burnup tonnes % MWd/kg 30.44 30.44 30.44 30.44 30.44 24.35 24.35 20.30 20.30 20.30 20.30 20.30 20.30 20.30 20.30 20.30 20.30 17.40 17.40 17.40 17.40 17.40 17.40 17.40 17.40 17.40 17.40 17.40 17.40 17.40 17.40 17.40 17.40 17.40 2.10 2.30 2.50 2.70 2.76 2.76 2.76 2.78 2.78 2.78 3.20 3.20 3.20 3.20 3.20 3.20 3.20 3.40 3.40 3.40 3.40 3.40 3.40 3.40 3.40 3.40 3.40 3.40 3.40 3.40 3.40 3.40 3.40 3.40 20.239 26.543 26.543 26.543 26.543 33.398 33.616 40.471 40.690 40.908 41.127 41.127 41.127 41. 127 41.127 41.127 41. 127 47.982 47.982 47.982 47.982 47.982 47.982 47.982 47.982 47.982 47.982 47.982 41.127 34.273 27.418 20.563 13.709 6.854
Table 5. Fuelling data for F2 and the three scenarios considered. Scenarios; I: All reactors operate until mid of the year 2010. 11: Reactors shut down after 25 years of operation, but not later than mid 2010. Some unloaded fuel is redistributed to operating reactors. Ill: Same as alternative 1 for this reactor.
Scenario I
Year Amount Enr. Burnup tonnes % MWd/kg 1983 1984 1985 1986 1987 1988 1989 1990 1991 1992 1993 1994 1995 1996 1997 1998 1999 2000 2001 2002 2003 2004 2005 2006 2006 2006 2006 2006 2006 2006 2007 2008 2009 2010 2010 2010 2010 2010 2010 2010 24.35 2.10 24.35 2.10 24.35 2.40 24.35 2.76 24.35 2.76 24.35 2.78 24.35 2.78 20.30 3.00 20.30 3.00 20.30 3.20 20.30 3.20 20.30 3.20 20.30 3.20 20.30 3.20 20.30 3.20 20.30 3.20 20.30 3.20 17.40 3.40 17.40 3.40 17.40 3.40 17.40 3.40 17.40 3.40 17.40 3.40 17.40 3.40 17.40 3.40 17.40 3.40 17.40 3.40 17.40 3.40 17.40 3.40 17.40 3.40 17.40 3.40 17.40 3.40 17.40 3.40 17.40 3.40 15.544 21. 994 28.444 32.249 32.249 32.995 33.400 40.255 40.659 41. 064 41.469 41. 127 41.127 41.127 41.127 41.127 41.127 47.982 47.982 47.982 47.982 47.982 47.982 47.982 47.982 47.982 47.982 47.982 41.127 34.273 27.418 20.563 13.709 6.854 Scenario 11 Amount Enr. Burnup tonnes % MWd/kg 24.35 24.35 24.35 24.35 24.35 24.35 24.35 20.30 20.30 20.30 20.30 20.30 20.30 20.30 20.30 20.30 20.30 17.40 17.40 17.40 17.40 17.40 17.40 17.40 17.40 17.40 17.40 17.40 17.40 17.40 2.10 2.10 2.40 2.76 2.76 2.78 2.78 3.00 3.00 3.20 3.20 3.20 3.20 3.20 3.20 3.20 3.20 3.40 3.40 3.40 3.40 3.40 3.40 3.40 3.40 3.40 3.40 3.40 3.40 3.40 15.544 21.994 28.444 32.249 32.249 32.995 33.400 40.255 40.659 41. 064 41.469 41.127 41.127 41.127 41.127 41.127 41.127 47.982 47.982 47.982 47.982 47.982 47.982 47.982 41.127 34.273 27.418 20.563 13.709 6.854 Scenario III Amount Enr. Burnup tonnes % MWd/kg 24.35 24.35 24.35 24.35 24.35 24.35 24.35 20.30 20.30 20.30 20.30 20.30 20.30 20.30 20.30 20.30 20.30 17.40 17.40 17.40 17.40 17.40 17.40 17.40 17.40 17.40 17.40 17.40 17.40 17.40 17.40 17.40 17.40 17.40 2.10 2.10 2.40 2.76 2.76 2.78 2.78 3.00 3.00 3.20 3.20 3.20 3.20 3.20 3.20 3.20 3.20 3.40 3.40 3.40 3.40 3.40 3.40 3.40 3.40 3.40 3.40 3.40 3.40 3.40 3.40 3.40 3.40 3.40 15.544 21. 994 28.444 32.249 32.249 32.995 33.400 40.255 40.659 41.064 41.469 41.127 41.127 41.127 41.127 41. 127 41.127 47.982 47.982 47.982 47.982 47.982 47.982 47.982 47.982 47.982 47.982 47.982 41.127 34.273 27.418 20.563 13.709 6.854
Table 6. Fuelling data for F3 and the three scenarios considered. Scenarios; I: All reactors operate until mid of the year 2010" 11: Reactors shut down after 25 years of operation, but not later than mid 2010. Some fuel from shutdown reactors is used. Ill: Spent recycled uranium based fuel from 2000 to 2010.
Scenario I
Year Amount Enr. Burnup
tonnes % MWd/kg 1987 1988 1989 1990 1991 1992 1993 1994 1995 1996 1997 1998 1999 2000 2000 2001 2002 2002 2003 2003 2003 2004 2005 2005 2005 2006 2006 2007 2007 2007 2008 2008 2008 2009 2009 2009 2010 2010 2010 2010 2010 2010 2010 2010 2010 2010 31.33 2.28 18.419 31.33 2.40 25.291 25.06 2.76 32.162 25.06 2.90 36.860 25.06 2.90 36.564 25.06 3.00 36.267 25.06 3.00 36.904 25.06 3.20 37.541 25.06 3.20 37.541 20.88 3.40 45.050 20.88 3.40 45.050 20.88 3.40 45.050 20.88 3.40 45.050 17.90 3.60 52.558 17.90 3.60 52.558 17.90 3.60 52.558 17.90 3.60 52.558 17.90 3.60 52.558 17.90 3.60 52.558 17.90 3.60 52.558 17.90 3.60 52.558 17.90 3.60 52.558 17.90 3.60 52.558 17.90 3.60 17.90 3.60 17.90 3.60 17.90 3.60 17.90 3.60 17.90 3.60 17.90 3.60 52.558 45.050 37.541 30.033 22.525 15.016 7.508 Scenario 11 Amount Enr. Burnup
tonnes % MWd/kg 31.33 2.28 31.33 2.40 25.06 2.76 25.06 2.90 25.06 2.90 25.06 3.00 25.06 3.00 25.06 3.20 25.06 3.20 20.88 3.40 20.88 3.40 20.88 3.40 20.88 3.40 20.88 3.40 20.88 3.40 20.88 3.40 20.88 3.40 10.70 3.40 20.88 3.40 14.38 3.50 17.40 3.40 10.70 3.40 10.70 3.40 20.88 3.40 1:4.38 3.50 14.38 3.50 9.66 3.40 14"38 3050 17.40 3.40 10.18 3.40 2.82 3.40 17.40 3.40 2.82 3.40 14.38 3.50 10.70 3.40 17.40 3.40 7.68 3.40 17.40 3.40 5.64 3.40 17.40 3.40 7.16 3.40 17.40 3.40 6.64 3.40 17.40 3.40 17.40 3.40 11.18 3.40 18.419 25.291 32.162 36.860 36.564 36.267 36.904 37.541 37.541 45.050 45.050 45.050 45.050 37.541 45.050 37.541 37.541 42.386 37.541 38.478 43.052 43.718 36.875 45.050 47.301 41.107 45.050 42.421 42.435 45.050 37.541 42.435 45.050 36.142 37.541 43.088 7.508 14.362 15.016 21.217 22.525 29.379 30.033 35.580 36.234 37.541 Scenario III Amount Enr. Burnup
tonnes % MWdJkg 31.33 2.28 18.419 31.33 2.40 25.291 25.06 2.76 32.162 25.06 2.90 36.860 25.06 2.90 36.564 25.06 3.00 36.267 25.06 3.00 36.904 25.06 3.20 37.541 25.06 3.20 37.541 20.88 3.40 45.050 20.88 3.40 45.050 20.88 3.40 45.050 20.88 3.40 45.050 17.90 3.60 52.558 17.90 3.60 52.558 17.90 3.60 52.558 17.90 3.60 52.558 17.90 3.60 52.558 17.90 3.60 52.558 17.90 3.60 52.558 17.90 3.60 52.558 17.90 3.60 52.558 17.90 3.60 52.558 17.90 3.60 17.90 3.60 17.90 3.60 17.90 3.60 17.90 3.60 17.90 3.60 17.90 3.60 52.558 45.050 37.541 30.033 22.525 15.016 7.508
Table 7. Fuelling data for 01 and the three scenarios considered. Scenarios; I: All reactors operate until mid of the year 2010. 11: Reactors shut down after 25 years of operation, but not later than mid 2010. Some unloaded fuel is redistributed to operating reactors. Ill: Same as alternative I for this reactor.
scenario I Year Amount Enr. Burnup
tonnes % MWd/kg 1974 1975 1976 1977 1978 1979 1980 1981 1982 1983 1984 1985 1986 1987 1988 1989 1990 1991 1992 1993 1994 1995 1996 1997 1997 1997 1997 1997 1997 1997 1997 1997 1998 1999 2000 2001 2002 2003 2004 2005 2006 2007 2008 2009 13.22 13.22 13.22 13.22 13.22 13.22 13.22 13.22 13.22 13.22 13.22 13.22 13.22 13.22 11. 33 11. 33 11. 33 9.92 9.92 9.92 9.92 9.92 8.81 8.81 8.81 8.81 8.81 8.81 8.81 8.81 8.81 8.81 8.81 8.81 8.81 8.81 2.10 2.30 2.40 2.50 2.70 2.90 2.90 2.90 2.90 2.90 2.90 2.90 2.90 2.90 3.00 3.00 3.00 3.20 3.20 3.20 3.20 3.20 3.40 3.40 3.40 3.40 3.40 3.40 3.40 3.40 3.40 3.40 3.40 3.40 3.40 3.40 7.658 12.057 16.109 20.478 23.251 24.911 27.678 28.164 28.997 29.513 29.310 29.310 29.310 29.310 34.250 34.306 34.361 39.302 39.357 39.413 39.468 39.524 44.464 44.464 44.464 44.464 44.464 44.464 44.464 44.464 44.464 44.464 44.464 44.464 44.464 44.464 scenario 11 Amount Enr. Burnup tonnes % MWd/kg 13.22 13.22 13.22 13.22 13.22 13.22 13.22 13.22 13.22 13.22 13.22 13.22 13.22 13.22 11. 33 11. 33 11. 33 9.92 9.92 9.92 9.92 9.92 8.81 8.81 -8.81 8.81 8.81 8.81 8.81 8.81 8.81 8.81 2.10 2.30 2.40 2.50 2.70 2.90 2.90 2.90 2.90 2.90 2.90 2.90 2.90 2.90 3.00 3.00 3.00 3.20 3.20 3.20 3.20 3.20 3.40 3.40 3.40 3.40 3.40 3.40 3.40 3.40 3.40 3.40 7.658 12.057 16.109 20.478 23.251 24.911 27.678 28.164 28.997 29.513 29.310 29.310 29.310 29.310 34.250 34.306 34.361 39.302 39.357 39.413 39.468 39.524 44.464 44.464 39.524 34.583 29.643 24.702 19.762 14.821 9.881 4.940 scenario III Amount Enr. Burnup tonnes % MWd/kg 13.22 13.22 13.22 13.22 13.22 13.22 13.22 13.22 13.22 13.22 13.22 13.22 13.22 13.22 11. 33 11.33 11. 33 9.92 9.92 9.92 9.92 9.92 8.81 8.81 8.81 8.81 8.81 8.81 8.81 8.81 8.81 8.81 8.81 8.81 8.81 8.81 2.10 2.30 2.40 2.50 2.70 2.90 2.90 2.90 2.90 2.90 2.90 2.90 2.90 2.90 3.00 3.00 3.00 3.20 3.20 3.20 3.20 3.20 3.40 3.40 3.40 3.40 3.40 3.40 3.40 3.40 3.40 3.40 3.40 3.40 3.40 3.40 7.658 12.057 16.109 20.478 23.251 24.911 27.678 28.164 28.997 29.513 29.310 29.310 29.310 29.310 34.250 34.306 34.361 39.302 39.357 39.413 39.468 39.524 44.464 44.464 44.464 44.464 44.464 44.464 44.464 44.464 44.464 44.464 44.464 44.464 44.464 44.464
Table 7. Cont.
Scenario I scenario 11 scenario I I I
---~~---~-~----
---Year Amount Enr. Burnup Amount Enr. Burnup Amount Enr. Burnup tonnes % MWd/kg tonnes ~ 0 MWd/kg tonnes % MWd/kg ---~---~~---~---~---2010 8.81 3.40 44.464 8.81 3.40 44.464 2010 8.81 3.40 39.524 8.81 3.40 39.524 2010 8.81 3.40 34.583 8.81 3.40 34.583 2010 8.81 3.40 29.643 8.81 3.40 29.643 2010 8.81 3.40 24.702 8.81 3.40 24.702 2010 8.81 3.40 19.762 8.81 3.40 19.762 2010 8.81 3.40 14.821 8.81 3.40 14.821 2010 8.81 3.40 9.881 8.81 3.40 9.881 2010 8.81 3.40 4.940 8.81 3.40 4.940
Table 8. Fuelling data for 02 and the three scenarios considered. Scenarios; I: All reactors operate until mid of the year 2010. 11: Reactors shut down after 25 years of operation, but not later than mid 2010. Some unloaded fuel is redistributed to operating reactors. 111: Same as alternative I for this reactor.
Scenario I Year Amount Enr. Burnup
tonnes % MWd/kg 1977 1978 1979 1980 1981 1982 1983 1984 1985 1986 1987 1988 1989 1990 1991 1992 1993 1994 1995 1996 1997 1998 1999 2000 2001 2002 2003 2004 2005 2006 2007 2008 2009 2010 2010 2010 2010 2010 2010 2010 18.73 18.73 18.73 18.73 18.73 18.73 18.73 18.73 14.98 14.98 14.98 14.98 14.98 14.98 12.48 12.48 12.48 12.48 12.48 12.48 12.48 10.70 10.70 2.10 15.503 2.30 20.711 2.50 22.422 2.70 24.323 2.76 25.484 2.76 26.193 2.76 26.193 2.76 26.193 2.76 32.741 2.76 32.741 2.78 32.741 2.78 33.039 2.78 33.338 2.78 33.636 3.00 40.483 3.00 40.781 3.20 41.080 3.20 41.080 3.20 41.080 3.20 41.080 3.20 41.080 3.40 47.927 3.40 47.927 10.70 3.40 10.70 3.40 10.70 3.40 10.70 3.40 10.70 3.40 10.70 3.40 10.70 3.40 10.70 3.40 10.70 3.40 10.70 3.40 10.70 3.40 10.70 3.40 10.70 3.40 10.70 3.40 10.70 3.40 10.70 3.40 10.70 3.40 47.927 47.927 47.927 47.927 47.927 47.927 47.927 47.927 47.927 47.927 47.927 41.080 34.233 27.386 20.540 13.693 6.846 Scenario 11 Amount Enr. Burnup tonnes % MWd/kg 18.73 18.73 18.73 18.73 18.73 18.73 18.73 18.73 14.98 14.98 14.98 14.98 14.98 14.98 12.48 12.48 12.48 12.48 12.48 12.48 12.48 10.70 10.70 10.70 10.70 10.70 10.70 10.70 10.70 2.10 2.30 2.50 2.70 2.76 2.76 2.76 2.76 2.76 2.76 2.78 2.78 2.78 2.78 3.00 3.00 3.20 3.20 3.20 3.20 3.20 3.40 3.40 3.40 3.40 3.40 3.40 3.40 3.40 15.503 20.711 22.422 24.323 25.484 26.193 26.193 26.193 32.741 32.741 32.741 33.039 33.338 33.636 40.483 40.781 41. 080 41. 080 41.080 41.080 41. 080 47.927 47.927 41. 080 34.233 27.386 20.540 13.693 6.846 Scenario 111 Amount Enr. Burnup tonnes % MWd/kg 18.73 18.73 18.73 18.73 18.73 18.73 18.73 18.73 14.98 14.98 14.98 14.98 14.98 14.98 12.48 12.48 12.48 12.48 12.48 12.48 12.48 10.70 10.70 10.70 10.70 10.70 10.70 10.70 10.70 10.70 10.70 10.70 10.70 10.70 10.70 10.70 10.70 10.70 10.70 10.70 2.10 2.30 2.50 2.70 2.76 2.76 2.76 2.76 2.76 2.76 2.78 2.78 2.78 2.78 3.00 3.00 3.20 3.20 3.20 3.20 3.20 3.40 3.40 3.40 3.40 3.40 3.40 3.40 3.40 3.40 3.40 3.40 3.40 3.40 3.40 3.40 3.40 3.40 3.40 3.40 15.503 20.711 22.422 24.323 25.484 26.193 26.193 26.193 32.741 32.741 32.741 33.039 33.338 33.636 40.483 40.781 41.080 41.080 41.080 41.080 41. 080 47.927 47.927 47.927 47.927 47.927 47.927 47.927 47.927 47.927 47.927 47.927 47.927 47.927 41.080 34.233 27.386 20.540 13.693 6.846
Table 9. Fuelling data for 03 and the three scenarios considered. Scenarios; I: All reactors operate until mid of the year 2010. 11: Reactors shut down after 25 years of operation, but not later than mid 2010. Some fuel from shutdown reactors used. Ill: Recycled uranium based fuel from 1995 to 2010.
scenario I Year Amount Enr. Burnup
tonnes % MWd/kg 1987 1988 1989 1990 1991 1992 1993 1994 1995 1996 1996 1997 1998 1999 1999 2000 2000 2000 2001 2002 2002 2002 2003 2003 2003 2004 2004 2004 2005 2005 2006 2006 2007 2008 2008 2009 2009 2010 2010 2010 2010 2010 2010 2010 31.33 2.28 18.443 31.33 2.40 25.309 25.06 2.76 32.174 25.06 2.90 36.731 25.06 2.90 36.483 25.06 3.00 36.235 25.06 3.00 36.872 25.06 3.20 37.508 25.06 3.20 37.508 20.88 3.40 45.010 20.88 3.40 45.010 20.88 3.40 45.010 20.88 3.40 45.010 17.90 3.60 52.512 17.90 3.60 52.512 17.90 3.60 52.512 17.90 3.60 52.512 17.90 3.60 52.512 17.90 3.60 52.512 17.90 3.60 52.512 17.90 3.60 52.512 17.90 3.60 52.512 17.90 3.60 52.512 17.90 3.60 17.90 3.60 17.90 3.60 17.90 3.60 17.90 3.60 17.90 3.60 17.90 3.60 52.512 45.010 37.508 30.007 22.505 15.003 7.501 scenario 11 Amount Enr. Burnup tonnes % MWd/kg 31.33 2.28 31.33 2.40 25.06 2.76 25.06 2.90 25.06 2.90 25.06 3.00 25.06 3.00 25.06 3.20 25.06 3.20 20.88 3.40 20.88 3.40 20.88 3.40 8.81 3.40 20.88 3.40 8.81 3.40 8.81 3.40 20.88 3.40 8.81 3.40 20.88 3.40 6.54 3.40 8.81 3.40 10.70 3.40 3.36 3.40 8.81 3.40 1:0.70 3.40 10.70 3.40 10.70 3.40 8.81 3.40 10.70 3.40 8.29 3.40 17.10 3.40 10.70 3.40 20.88 3.40 4.65 3.40 10.70 3.40 1.37 3.40 10.70 3.40 30.21 3.40 18.99 3.40 27.87 3.40 20.88 3.40 15.35 3.40 12.07 3.40 18.443 25.309 32.174 36.731 36.483 36.235 36.872 37.508 37.508 37.508 45.010 37.508 44.646 45.010 47.207 44.828 45.010 49.769 45.010 45.010 47.389 49.892 45.010 49.951 50.547 42.373 43.700 45.010 44.355 45.010 45.010 50.534 45.010 45.010 51.193 45.010 51.853 45.010 37.508 30.007 22.505 15.003 7.501 scenario III Amount Enr. Burnup tonnes % MWd/kg 31.33 2.28 18.443 31.33 2.40 25.309 25.06 2.76 32.174 25.06 2.90 36.731 25.06 2.90 36.483 25.06 3.00 36.235 25.06 3.00 36.872 25.06 3.20 37.508 25.06 3.20 37.508 20.88 3.40 45.010 20.88 3.40 45.010 20.88 3.40 45.010 20.88 3.40 45.010 17.90 3.60 52.512 17.90 3.60 52.512 17.90 3.60 52.512 17.90 3.60 52.512 17.90 3.60 52.512 17.90 3.60 52.512 17.90 3.60 52.512 17.90 3.60 52.512 17.90 3.60 52.512 17.90 3.60 52.512 17.90 17.90 17.90 17.90 17.90 17.90 17.90 3.60 3.60 3.60 3.60 3.60 3.60 3.60 52.512 45.010 37.508 30.007 22.505 15.003 7.501
Table 10. Fuelling data for RI and the three scenarios considered. Scenariosi I: All reactors operate until mid of the year 2010. 11: Reactors shut down after 25 years of operation, but not later than mid 2010. Some unloaded fuel is redistributed to operating reactors. Ill: Same as alternative I for this reactor.
Scenario I Year Amount Enr. Burnup
tonnes % MWd/kg 1978 1979 1980 1981 1982 1983 1984 1985 1986 1987 1988 1989 1990 1991 1992 1993 1994 1995 1996 1997 1998 1999 2000 2001 2001 2001 2001 2001 2001 2001 2001 2002 2003 2004 2005 2006 2007 2008 2009 2010 2010 2010 2010 2010 2010 2010 2010 19.17 2.10 19.17 2.30 19.17 2.50 19.17 2.60 19.17 2.70 19.17 2.76 19.17 2.76 19.17 2.76 19.17 2.76 19.17 2.76 19.17 2.76 19.17 2.78 19.17 3.00 19.17 3.00 19.17 3.20 19.17 3.20 19.17 3.20 16.43 3.40 16.43 3.40 16.43 3.40 16.43 3.40 16.43 3.40 14.38 3.50 14.38 3.50 14.38 3"50 14.38 3.50 14.38 3.50 14.38 3.50 14.38 3.50 14.38 3.50 14.38 3.50 14.38 3.50 14.38 3.50 14.38 3.50 14.38 3.50 14.38 3.50 14.38 3.50 14.38 3.50 14.38 3.50 14.38 3.50 10.543 15.551 20.560 25.568 28.261 29.480 30.048 30.048 30.048 30.048 30.664 31. 850 33.036 34.222 35.408 36.594 37.164 43.358 43.358 43.358 43.358 43.358 49.552 49.552 49.552 49.552 49.552 49.552 49.552 49.552 49.552 49.552 49.552 43.358 37.164 30.970 24.776 18.582 12.388 6.194 Scenario 11 Amount Enr. Burnup tonnes % MWd/kg 19.17 19.17 19.17 19.17 19.17 19.17 19.17 19.17 19.17 19.17 19.17 19.17 19.17 19.17 19.17 19.17 19.17 16.43 16.43 16.43 16.43 16.43 14.38 14.38 1-4.38 14.38 14.38 14.38 14.38 14.38 14.38 2.10 2.30 2.50 2.60 2.70 2.76 2.76 2.76 2.76 2.76 2.76 2.78 3.00 3.00 3.20 3.20 3.20 3.40 3.40 3.40 3.40 3.40 3.50 3.50 3.50 3.50 3.50 3.50 3.50 3.50 3.50 10.543 15.551 20.560 25.568 28.261 29.480 30.048 30.048 30.048 30.048 30.664 31. 850 33.036 34.222 35.408 36.594 37.164 43.358 43.358 43.358 43.358 43.358 49.552 49.552 43.358 37.164 30.970 24.776 18.582 12.388 6.194 Scenario 111 Amount Enr. Burnup tonnes % MWd/kg 19.17 19.17 19.17 19.17 19.17 19.17 19.17 19.17 19.17 19.17 19.17 19.17 19.17 19.17 19.17 19.17 19.17 16.43 16.43 16.43 16.43 16.43 14.38 14.38 14.38 14.38 14.38 14.38 14.38 14.38 14.38 14.38 14.38 14.38 14.38 14.38 14.38 14.38 14.38 14.38 2.10 2.30 2.50 2.60 2.70 2.76 2.76 2.76 2.76 2.76 2.76 2.78 3.00 3.00 3.20 3.20 3.20 3.40 3.40 3.40 3.40 3.40 3.50 3.50 3.50 3.50 3.50 3.50 3.50 3.50 3.50 3.50 3.50 3.50 3.50 3.50 3.50 3.50 3.50 3.50 10.543 15.551 20.560 25.568 28.261 29.480 30.048 30.048 30.048 30.048 30.664 31. 850 33.036 34.222 35.408 36.594 37.164 43.358 43.358 43.358 43.358 43.358 49.552 49.552 49.552 49.552 49.552 49.552 49.552 49.552 49.552 49.552 49.552 43.358 37.164 30.970 24.776 18.582 12.388 6.194
Table 11. Fuelling data for R2 and the three scenarios considered. scenarios; I: All reactors operate until mid of the year 2010. 11: Reactors shut down after 25 years of operation, but not later than mid 2010. Some unloaded fuel is redistributed to operating reactors. Ill: Same as alternative I for this reactor.
Scenario I Year Amount Enr. Burnup
tonnes % MWd/kg 1979 1980 1981 1982 1983 1984 1985 1986 1987 1988 1989 1990 1991 1992 1993 1994 1995 1996 1997 1998 1999 2000 2000 2000 2000 2000 2000 2001 2002 2003 2004 2005 2006 2007 2008 2009 2010 2010 2010 2010 2010 2010 17.10 3.20 17.10 3.20 17.10 3.20 17.10 3.30 17.10 3.40 17.10 3.40 17.10 3.40 17.10 3.40 17.10 3.40 17.10 3.40 13.68 3.40 13.68 3.40 13.68 3.40 13.68 3.40 13.68 3.40 13.68 3.40 13.68 3.40 13.68 3.40 13.68 3.40 13.68 3.40 13.68 3.40 11.40 3.75 11. 40 3.75 11.40 3.75 11.40 3.75 11.40 3.75 11.40 3.75 11.40 3.75 11.40 3.75 11.40 3.75 11.40 3.75 11.40 3.75 11.40 3.75 11.40 3.75 11. 40 3.75 11.40 3.75 11.40 3.75 30.984 30.775 30.702 30.674 30.674 30.674 30.674 30.674 30.674 32.518 42.031 43.875 45.719 47.563 47.563 47.563 47.563 47.563 47.563 47.563 47.563 57.076 57.076 57.076 57.076 57.076 57.076 57.076 57.076 57.076 57.076 57.076 47.563 38.051 28.538 19.025 9.512 Scenario 11 Amount Enr. Burnup tonnes % MWd/kg 17.10 17.10 17.10 17.10 17.10 17.10 17.10 17.10 17.10 17.10 13.68 13.68 13.68 13.68 13.68 13.68 13.68 13.68 13.68 13.68 13.68 11.40 11.40 11.40 1:1.40 11.40 11.40 3.20 3.20 3.20 3.30 3.40 3.40 3.40 3.40 3.40 3.40 3.40 3.40 3.40 3.40 3.40 3.40 3.40 3.40 3.40 3.40 3.40 3.75 3.75 3.75 3.75 3.75 3.75 30.984 30.775 30.702 30.674 30.674 30.674 30.674 30.674 30.674 32.518 42.031 43.875 45.719 47.563 47.563 47.563 47.563 47.563 47.563 47.563 47.563 57.076 47.563 38.051 28.538 19.025 9.512 Scenario III Amount Enr. Burnup tonnes % MWd/kg 17.10 17.10 17.10 17.10 17.10 17.10 17.10 17.10 17.10 17.10 13.68 13.68 13.68 13.68 13.68 13.68 13.68 13.68 13.68 13.68 13.68 11.40 11.40 11.40 11.40 11.40 11.40 11.40 11.40 11.40 11.40 11.40 11.40 11.40 11.40 11.40 11.40 3.20 3.20 3.20 3.30 3.40 3.40 3.40 3.40 3.40 3.40 3.40 3.40 3.40 3.40 3.40 3.40 3.40 3.40 3.40 3.40 3.40 3.75 3,75 3.75 3.75 3.75 3.75 3.75 3.75 3.75 3.75 3.75 3.75 3.75 3.75 3.75 3.75 30.984 30.775 30.702 30.674 30.674 30.674 30.674 30.674 30.674 32.518 42.031 43.875 45.719 47.563 47.563 47.563 47.563 47.563 47.563 47.563 47.563 57.076 57.076 57.076 57.076 57.076 57.076 57.076 57.076 57.076 57.076 57.076 47.563 38.051 28.538 19.025 9.512
Table 12. Fuelling data for R3 and the three scenarios considered. Scenarios; I: All reactors operate until mid of the year 2010. 11: Reactors shut down after 25 years of operation, but not later than mid 2010. Some unloaded fuel is redistributed to operating reactors. Ill: Same as alternative I for this reactor.
Scenario I Year Amount Enr. Burnup
tonnes % MWd/kg 1983 1984 1985 1986 1987 1988 1989 1990 1991 1992 , 1993 1994 1995 1996 1997 1998 1999 2000 2001 2002 2003 2004 2005 2006 2006 2006 2006 2006 2006 2007 2008 2009 2010 2010 2010 2010 2010 2010 18.06 3.20 20.061 18.06 3.20 28.745 18.06 3.20 34.738 18.06 3.20 34.738 18.06 3.40 34.738 18.06 3.40 36.333 18.06 3.40 37.928 18.06 3.40 39.523 18.06 3.40 41.118 18.06 3.40 41.118 18.06 3.40 41.118 18.06 3.40 41.118 14.44 3.80 51.398 14.44 3.80 51.398 14.44 3.80 51.398 14.44 3.80 51.398 14.44 3.80 51.398 12.04 4.20 61.677 12.04 4.20 61.677 12.04 4.20 61.677 12.04 4.20 61.677 12.04 4.20 61.677 12.04 4.20 61.677 12.04 4.20 61.677 12.04 4.20 61.677 12.04 4.20 61.677 12.04 4.20 61.677 12.04 4.20 61.677 12.04 4.20 51.398 12.04 4.20 41.118 12.04 4.20 30.838 12.04 4.20 20.559 12.04 4.20 10.279 Scenario 11 Amount Enr. Burnup tonnes % MWd/kg 18.06 3.20 20.061 18.06 3.20 28.745 18.06 3.20 34.738 18.06 3.20 34.738 18.06 3.40 34.738 18.06 3.40 36.333 18.06 3.40 37.928 18.06 3.40 39.523 18.06 3.40 41.118 18.06 3.40 41.118 18.06 3.40 41.118 18.06 3.40 41.118 14.44 3.80 51.398 14.44 3.80 51.398 14.44 3.80 51.398 14.44 3.80 51.398 14.44 3.80 51.398 12.04 4.20 61.677 12.04 4.20 61.677 12.04 4.20 61.677 12.04 4.20 61.677 12.04 4.20 61.677 12.04 4.20 61.677 12.04 4.20 61.677 12.04 4.20 51.398 12.04 4.20 41.118 12.04 4.20 30.838 12.04 4.20 20.559 12.04 4.20 10.279 Scenario III Amount Enr. Burnup tonnes % MWd/kg 18.06 3.20 20.061 18.06 3.20 28.745 18.06 3.20 34.738 18.06 3.20 34.738 18.06 3.40 34.738 18.06 3.40 36.333 18.06 3.40 37.928 18.06 3.40 39.523 18.06 3.40 41.118 18.06 3.40 41.118 18.06 3.40 41.118 18.06 3.40 41.118 14.44 3.80 51.398 14.44 3.80 51.398 14.44 3.80 51.398 14.44 3.80 51.398 14.44 3.80 51.398 12.04 4.20 61.677 12.04 4.20 61.677 12.04 4.20 61.677 12.04 4.20 61.677 12.04 4.20 61.677 12.04 4.20 61.677 12.04 4.20 61.677 12.04 4.20 61.677 12.04 4.20 61.677 12.04 4.20 61.677 12.04 4.20 61.677 12.04 4.20 51.398 12.04 4.20 41.118 12.04 4.20 30.838 12.04 4.20 20.559 12.04 4.20 10.279
Table 13. Fuelling data for R4 and the three scenarios considered. Scenarios; I: All reactors operate until mid of the year 2010. 11: Reactors shut down after 25 years of operation, but not later than mid 2010. Some fuel from shutdown reactors used. 111: Same as
alternative I for this reactor. Scenario I
Year Amount Enr. Burnup tonnes % MWd/kg 1984 1985 1986 1987 1988 1989 1990 1991 1992 1993 1994 1995 1996 1997 1998 1999 2000 2001 2002 2002 2003 2004 2004 2005 2006 2006 2007 2008 2008 2008 2008 2008 2008 2008 2009 2010 2010 2010 2010 2010 2010 18.06 3.20 13.807 18.06 3.20 24.922 18.06 3.20 36.037 18.06 3.20 44.460 18.06 3.40 43.624 18.06 3.40 42.789 18.06 3.40 41.953 18.06 3.40 41.118 18.06 3.40 41.118 18.06 3.40 41.118 18.06 3.40 41.118 18.06 3.40 41.118 14.44 3.80 51.398 14.44 3.80 51.398 14.44 3.80 51.398 14.44 3.80 51.398 12.04 4.20 61.677 12.04 4.20 61.677 12.04 4.20 61.677 12.04 4.20 61.677 12.04 4.20 61.677 12.04 4.20 61.677 12.04 4.20 61.677 12.04 4.20 61.677 12.04 4.20 61.677 12.04 4.20 61.677 12.04 4.20 61.677 12.04 4.20 51.398 12.04 4.20 41.118 12.04 4.20 30.838 12.04 4.20 20.559 12.04 4.20 10.279 Scenario 11 Amount Enr. Burnup tonnes % MWd/kg 18.06 3.20 13.807 18.06 3.20 24.922 18.06 3.20 36.037 18.06 3.20 44.460 18.06 3.40 43.624 18.06 3.40 42.789 18.06 3.40 41.953 18.06 3.40 41.118 18.06 3.40 41.118 18.06 3.40 41.118 18.06 3.40 41.118 18.06 3.40 41.118 14.44 3.80 51.398 14.44 3.80 51.398 14.44 3.80 51.398 14.44 3.80 51.398 14.44 3.80 51.398 14.44 3.80 51.398 11.04 3.75 49.097 14.44 3.80 51.398 14.44 3.80 51.398 11.40 3.75 49.864 14.44 3.80 51.398 3.04 3.80 51.398 11.40 3.75 50.631 3.04 3.80 51.398 14.44 3.80 51.398 2.40 3.80 10.279 2.40 3.80 20.559 12.04 4.20 20.559 3.04 3.80 30.838 25.84 3.80 410118 12.04 4.20 41.118 14.44 3.80 51.398 Scenario 111 Amount Enr. Burnup tonnes % MWd/kg 18.06 3.20 13.807 18.06 3.20 24.922 18.06 3.20 36.037 18.06 3.20 44.460 18.06 3.40 43.624 18.06 3.40 42.789 18.06 3.40 41.953 18.06 3.40 41.118 18.06 3.40 41.118 18.06 3.40 41.118 18.06 3.40 41.118 18.06 3.40 41.118 14.44 3.80 51.398 14.44 3.80 51.398 14.44 3.80 51.398 14.44 3.80 51.398 12.04 4.20 61.677 12.04 4.20 61.677 12.04 4.20 61.677 12.04 4.20 61.677 12.04 4.20 61.677 12.04 4.20 61.677 12.04 4.20 61.677 12.04 4.20 61.677 12.04 4.20 61.677 12.04 4.20 61.677 12.04 4.20 61.677 12.04 4.20 51.398 12.04 4.20 41.118 12.04 4.20 30.838 12.04 4.20 20.559 12.04 4.20 10.279
Table 14. Comparison of actinide concentrations in fuel computed by several codes (12) and results for the same case calculated with the BURNUP code.
,;uclice C',Si·:O Cl~Sf:O- :::~<~ 3~:::G;\:-':: I: ORIGEC'J !3U 2:< L7;::'
U-232 0.00088 U-233 0.00050 U-234 150.600 U-235 9400.000 9430.000 8770.000 8520.000 6969.000 U-236 4010.000 4010.000 3960.000 4420.000 3832.000 U-237 16.900 13.600 3.824 U-238 940830.000 940730.000 944700.000 942000.000 944600.000 U-239 0.689 0.672 0.174 U-240 0.000031 0.000000 0.000002 Np-237 441.000 456.000 605.000 515.000 585.700 rip-238 2.450 1 .990 0.512 Np-239 99.300 96.600 25.050 Np-240m 0.000217 0.000000 0.000013 Np-240 0.001740 0.003890 0.000096 Pu-238 153.000 158.000 201.000 184.000 194.700 Pu-239 6480.000 6500.000 5510.000 5820.000 6338.000 Pu-240 2330.000 2350.000 2340.000 2160.000 1786.000 Pu-241 1580.000 1570.000 1520.000 1110.000 1120.000 ?u-242 444.000 441.000 462.000 337.000 315.200 Pu-243 0.182 0.165 0.030 Pu-244 0.010 Pu-245 0.0000001 Pu-246 0.000000000 A!:l-241 39.000 40.900 38.900 24.000 103.500 Am-242m 672.000 1 .010 1 .355 Am-242 1 .640 0.684 0.108 0.087 0.082 Am-243 95.100 99.700 102.000 93.600 66.130 Am-244rn 0.0009 Arn-244 0.0073 0.0051 0.0013 Arn-245 0.00000002 Am-246 0.000000000 Cm-242 14.200 13.200 13.500 11.000 14.220 Crn-243 0.633 0.355 0.079 0.329 Cm-244 27 . 500 29.700 32.300 31 .100 21 .240 Cm-245 1 .120 1 .300 2.180 1.138 Cm-246 0.100 0.144 0.229 0.136 Cm-247 0.00081 0.00140 0.00311 0.00157 Cm-248 0.0000476 0.0000881 0.0002170 0.0001427 Cm-249 0.000000003 0.000000001 Cm-2S0 0.000000000 Bk-249 0.00000071 0.00000138 0.00000264 0.00000176 Bk-2S0 0.000000002 0.000000002 0.000000000 Bk-251 0.000000000 Cf-249 0.00000009 0.00000016 0.00000029 0.00000071 Cf-2S0 0.00000019 0.00000040 0.00000039 0.00000030 Cf-251 0.00000008 0.00000014 0.00000021 0.00000013 Cf-252 0.00000003 0.00000007 0.00000011 0.00000007 Cf-253 0.000000000 0.000000000 0.000000000 0.000000000 Cf-254 0.000000000
Table 15. Average composition of fuel and specific activities assumed to be unloaded from Fl in 2000 and decay corrected to mid 2100. All three scenarios as defined in table 8 give the same data. Nuclide Conc. (gjtIHM) Sp. act. (BqjtIHM) Nuclide Conc. (gjtIHM)
sp.
act. (BqjtIHM) AC225 AC227 AC228 AGI07 AGl09 AM24l AM242 AM242M AM243 AS 75 BA134 BA135 BA136 BA137 BA137M BA138 BI209 BI2l0 BR 79 BR 81 CDllO CDlll CDl12 CDl13 CDl13M CD114 CDl16 CEl40 CEl42 CF249 CF250 CF25l CM242 CM243 CM244 CM245 CM246 CM247 CM248 6.85lE-ll 1.47lE+05 8.603E-07 2.303E+06 3.133E-16 2.601E+Ol 2.356E-OJ 7.l09E+Ol 1.199E+OJ 1.520E+14 1.747E-05 5.230E+ll 1.454E+00 5.230E+ll 4.072E+02 3.007E+12 1.875E-Ol 9.948E+Ol 1.047E-02 1.324E+Ol 1.668E+03 2.755E-05 5.484E+14 1. 925E+03 1. 384E-07 8.052E-ll 3.699E+05 8.638E-03 3.066E+Ol 1.589E-Ol 1. 730E+Ol 8.500E+OO 1.640E-Ol 2.l33E-03 1.898E-05 1.587E+08 1. 340E+Ol 5.828E+OO CS133 CS134 CS135 CS137 DY160 DY16l DY162 DY163 DY164 ERl66 EU15l EU152 EU153 EU154 EU155 FR223 GD152 GD154 GD155 GD156 GD157 GD158 GD160 GE 72 GE 73 GE 74 GE 76 1.858E+03 I 127 1.720E+03 I 1296.948E-04 1.052E+08 INl13 7.661E-07 3.095E+06 INl15 6.695E-05 3.921E+06 3.537E-03 4.337E+l1 7.638E-02 1.459E+ll 6.149E+OO 1.841E+13 1.586E+Ol 1.007E+11 7.328E+OO 8.385E+I0 1.628E-Ol 5.447E+05 3.733E-02 5.688E+06 KR 80 KR 81 KR 82 KR 83 KR 84 KR 85 KR 86 LA139 1.782E+03 2.391E-13 1.145E+Ol 4.532E+02 1.480E+lO 1.81lE+02 5.799E+14 4.502E-02 3.124E-Ol 2.175E-Ol 8.011E-02 1.398E-02 4.327E-05 3.978E+00 4.764E-04 3.l90E+09 1. 310E+02 9.931E-03 1.003E+ll 8.816E-06 1.536E+08 2.221E-14 3.179E+04 7.115E-02 5.628E-02 3.479E+Ol 1. 233E+Ol 1.167E+Ol 4.474E-02 1.213E+Ol 8.885E-Ol 5.448E-03 2.101E-02 6.161E-02 5.264E-Ol 5.539E+Ol 3.110E+02 1.994E+09 2.660E-03 3.143E+00 7.092E-Ol 1.110E-03 1.0SSE-05 S.460E+03 4.028E-01 7.195E+Ol 1.649E+02 6.489E-02 9.443E+l1 2.980E+02 1.863E+03
Table 15. Cont.
Nuclide Conc. Sp. act. Nuclide Conc. Sp. act.
(gjtIHM) (BqjtIHM) (gjtIHM) (BqjtIHM)
~--
---MO 95 1. 230E+03 RA223 1.216E-09 2.303E+06
MO 96 1.644E+OI RA224 8.328E-08 4.906E+08
MO 97 1.245E+03 RA225 1. OI4E-IO 1.471E+05
MO 98 1.238E+03 RA226 2.028E-05 7.420E+05
MOIOO 1.407E+03
RB 85 2.005E+02
NB 93 4.276E-02 RB 87 3.973E+02 1.259E+06
NB 93M 9.609E-03 I.OO3E+II
RHI03 7.16IE+02 NDl42 1. 203E+OI
NDl43 1. 361E+03 RN222 1. 942E-08 7.115E+05
NDl44 1.864E+03 8.155E+OI
NDl45 1. 086E+03 RU 99 4.148E-OI
NDl46 9.603E+02 RUIOO 4.113E+Ol
NDl48 5.369E+02 RUIOI 1.140E+03
NDI50 2.356E+02 RUI02 1. 041E+03
RUI04 6.644E+02 NP237 6.655E+02 1.735E+I0
NP239 3.49IE-04 3.007E+12 SBl21 5.5I6E+OO NP240 2.943E-16 1.273E+02 SBl23 6.89IE+OO
NP240M 2.917E-14 1.127E+05 SBl25 5.270E-II 2.066E+03 SBl26 7.454E-07 2.305E+09 PA23I 1. 374E-03 2.399E+06 SBl26M 5.664E-09 1. 646E+IO PA233 2.267E-05 1. 735E+IO
PA234 3.143E-09 2.307E+08 SE 76 1.487E-03 PA234M 4.579E-IO 1.167E+IO SE 77 1.247E+OO SE 78 3.503E+OO
PB208 8.902E-04 SE 79 7.989E+OO 2.059E+IO
SE 80 1.457E+OI
PDI04 1.181E+02 SE 82 3.960E+OI
PDI05 4.286E+02
POI06 3.612E+02 SMl47 4.800E+02 4.076E+05
POI07 2.199E+02 4.183E+09 SMl48 1. 281E+02 1.432E+OO
PDI08 1.518E+02 SMl49 3.243E+OO
POlIO 4.406E+OI SMl50 4.363E+02
SM151 3.424E+OO 3.333E+12 PMl47 1.054E-09 3.616E+04 SM152 2.290E+02
SMl54 3.856E+OI P0210 2.190E-09 3.64IE+05
SNl15 2.198E-OI
PRl41 1.796E+03 SNI16 1. 398E+OO
PRl44 1. 740E+OI 1. 020E-22 SNl17 4.528E+OO SNI18 5.051E+OO PU238 2.030E+02 1.286E+14 SN119 5.141E+OO PU239 4.536E+03 1. 040E+13 SN120 5.245E+OO
PU240 2.31IE+03 1. 940E+13 SNI21M 4.426E-02 8.799E+IO PU241 9.741E+OO 3.715E+13 SN122 1.228E+Ol
PU242 1.080E+03 1.570E+l1 SN124 8.172E+OO
PU243 5.657E-12 5.447E+05 SN126 1.568E+Ol 1.646E+I0 PU244 1.683E-01 1.127E+05
Table 15. Cont.
Nuclide
Cone.
Sp. act. (gjtIHM) (BqjtIHM) ---~---~---SR 86 1.720E-01 SR 88 5.698E+02 SR 90 8.230E+Ol 4.197E+14 TB159 2.075E+OO TC 99 1.266E+03 7.902E+ll TE122 8.466E-02 TE124 5.074E+00 TE125 9.483E+00TE125M 7.575E-13 5.048E+02 TE126 1. 545E+00
TE128 1. 466E+02
TE130 6.138E+02 3.122E-05 TH227 1.997E-09 2.272E+06 TH228 1. 617E-05 4.906E+08 TH229 1. 860E-05 1. 472E+05 TH230 5.648E-02 4.060E+07 TH231 1. 433E-09 2.820E+07 TH232 6.897E-03 2.791E+Ol TH234 1. 362E-05 1.167E+IO U 232 6.006E-04 4.775E+08 U 233 1. 912E-02 6.816E+06 U 234 2.974E+02 6.862E+IO U 235 3.524E+02 2.820E+07 U 236 1.943E+03 4.652E+09 U 238 9.379E+05 1.167E+IO U 240 3.293E-12 1.127E+05 XE128 5.233E-01 XE129 1. 34 7E-03 XE130 4.932E+OO XE131 1. 510E+03 XE132 1. 382E+03 XE134 2.195E+03 XE136 3.342E+03 Y 89 7.661E+02 y 90 2.089E-02 4.199E+14 ZR 90 8.592E+02 ZR 91 9.897E+02 ZR 92 1.037E+03 ZR 93 1.142E+03 1. 061E+l1 ZR 94 1.199E+03 ZR 96 1.236E+03
Table 16. Average composition and specific activities of fuel
assume~to be unloaded from 03 in 2000 and decay corrected to mid
2100. The three scenarios are defined in table 9.
Scenario I Scenario 11 Scenario III
Nuclide Conc. Sp. act. Conc. Sp. act. Conc. Sp. act.
AC225 AC227 AC228
(gjtIHM) (BqJtIHM) (gjtIHM) (BqJtIHM) (gjtIHM) (BqJtIHM) 7.469E-ll 1.604E+05 5.917E-1l 1.27lE+05 2.651E-lO 5.693E+05 7.950E-07 2.l27E+06 8.025E-07 2.l48E+06 2.935E-06 7.855E+06 3.021E-16 2.506E+01 3.ll9E-16 2.588E+Ol 1.175E-15 9.749E+Ol
AG109 6.257E+Ol 7.292E+Ol 6.257E+Ol
AM24l AM242 AM242M AM243 1. 2l0E+03 1.670E-05 1.391E+00 4.791E+02 1.534E+14 5.000E+ll 5.000E+ll 3.538E+12 1. l85E+03 1.6I9E-OS 1. 34 7E+00 3.755E+02 1.S03E+14 4.845E+ll 4.84SE+ll 2.774E+12 1. 240E+03 1. 764E-05 1.468E+OO 4.394E+02 1. 572E+14 5.28IE+l1 5.28IE+1I 3.246E+12
AS 75 2.085E-OI 1.789E-Ol 2.085E-OI
BA134 BA135 BA136 BA137 BA137M BA138 7.4l9E+Ol 1.177E-02 9.899E+OO 1. 819E+03 3.030E-05 2.ll6E+03 6.034E+14 1.I5lE+02 9.960E-03 1.4l3E+Ol 1.604E+03 2.639E-OS 1. 84SE+03 S.25SE+14 7.4I9E+Ol 1.177E-02 9.899E+OO 1. 8I9E+03 3.030E-05 2.Il6E+03 6.034E+14
BI210 8.0llE-ll 3.678E+05 7.643E-ll 3.511E+05 2.4l8E-lO 1.111E+06
BR 81 3.427E+Ol 2.920E+Ol 3.427E+Ol
CDll1 CDl12 CDl13M CDl14 CDl16 1.406E+Ol 4.512E+OO 1.972E-OS 1.192E+Ol S.972E+OO 1.6S0E+08 1. 813E+Ol 9.6S8E+OO 2.-6S4E-OS 1. 371E+Ol S.724E+OO 2.219E+08 1.406E+Ol 4.Sl2E+OO 1. 972E-OS 1.192E+Ol S.972E+OO 1.6S0E+08 CE140 2.036E+03 CE142 1.902E+03 1. 783E+03 1.644E+03 2.036E+03 1.902E+03 CF249 CF2S0 CF2S1 CM242 CM243 CM244 CM24S CM246 CM247 CM248
1.432E-03 2.168E+08 5.36SE-04 8.120E+07 9.2S7E-04 1.40lE+08 1.632E-06 6.592E+06 5.97SE-07 2.413E+06 1.033E-06 4.l73E+06 1.434E-04 8.397E+06 S.142E-OS 3.011E+06 8.994E-05 S.269E+06 3.382E-03 4.148E+ll 3.276E-03 4.018E+l1 3.S72E-03 4.381E+ll 8.117E-02 1.5S1E+l1 7.496E-02 1.432E+l1 7.978E-02 1.523E+l1 8.140E+OO 2.438E+13 5.486E+OO 1.642E+13 6.916E+OO 2.070E+13 2.159E+Ol 1.372E+ll 1.398E+Ol 8.883E+I0 1.803E+Ol 1.14SE+l1 1.l56E+Ol 1.323E+l1 6.131E+OO 7.013E+IO 8.816E+OO 1.008E+l1 2.803E-Ol 9.380E+05 1.320E-Ol 4.418E+05 2.025E-Ol 6.782E+OS 7.313E-02 1.ll5E+07 2.903E-02 4.425E+06 4.879E-02 7.436E+06
Table 16. Cont.
Scenario I scenario 11 scenario III
Nuclide Conc. Sp. act. Conc. Sp. act. Conc. Sp. act.
CS133 CS134 CS135 CS137 DY160 DY161 DY162 EU151 EU152 EU153 EU154 EU155
(gjtIHM) (BqjtIHM) (gjtIHM) (BqjtIHM) (gjtIHM) (BqjtIHM) 2.02lE+03 1. 868E-13 5.09lE+02 1.992E+02 1.694E-03 2.909E-Ol 1. 731E-Ol 4.220E+OO 1.688E+03 8.944E+OO 2.528E-13 1.664E+IO 4.310E+02 6.374E+14 1.735E+02 9.410E-02 3.155E-Ol 2.289E-Ol 5.082E-04 3.402E+09 1.358E+02 3.879E+OO 4.611E-04 1. 281E+02 1.046E-02 9.428E-06 7.849E-03 7.933E+IO 6.570E-06 1.145E+08 2.021E+03
1.210E+Ol 1.868E-13 8.944E+OO 1.408E+IO 5.091E+02 1.664E+IO 5.554E+14 1.992E+02 6.374E+14
1.694E-03 2.909E-Ol 1. 731E-Ol 4.220E+OO 3.086E+09 5.082E-04 1.358E+02 1.058E+ll 7.849E-03 1.642E+08 6.570E-06 3.402E+09 7.933E+IO 1.145E+08 FR223 2.051E-14 2.936E+04 2.071E-14 2.964E+04 7.575E-14 1.084E+05 GD154 GD155 GD156 GD157 GD158 GD160 GE 72 GE 73 GE 74 GE 76 2.730E+Ol 9.201E+OO 7.145E-02 4.878E-02 9.486E+00 5.012E-Ol 5.461E-03 2.256E-02 6.665E-02 5.899E-Ol 3.701E+Ol 1.318E+Ol 2.708E-Ol 4.305E-02 1. 283E+Ol 9.999E-Ol 5.383E-03 2.030E-02 5.934E-02 5.011E-Ol 2.730E+Ol 9.201E+OO 7.145E-02 4.878E-02 9.486E+OO 5.012E-Ol 5.46lE-03 2.256E-02 6.665E-02 5.899E-Ol
I 127 5.760E+Ol 5.409E+Ol 5.760E+Ol
I 129 3.375E+02 2.163E+09 2.994E+02 1.9l9E+09 3.375E+02 2.l63E+09
INl13 2.765E-03 3.721E-03 2.765E-03
INl15 3.624E+OO 8.173E-Ol 2.959E+OO 6.675E-Ol 3.624E+00 8.173E-Ol
KR 80 KR 81 KR 82 KR 83 KR 84 KR 85 KR 86 LA139 MO 95 MO 96 MO 97 MO 98 MOlOO 1.311E-03 6.760E-06 5.256E+03 2.518E-Ol 8.615E+Ol 1. 817E+02 7.564E-02 1.101E+12 3.393E+02 2.058E+03 1. 378E+03 1. 830E+OO 1.373E+03 1. 353E+03 1.537E+03 1.036E-03 1. 205E-05 4.455E-Ol 6.677E+Ol 1.578E+02 6.087E-02 2.820E+02 1.782E+03 1.171E+03 2.084E+Ol 1.191E+03 1.189E+03 1. 352E+03 1. 311E-03
9.369E+03 6.760E-06 5.256E+03 2.518E-Ol
8.615E+Ol 1.817E+02
8.854E+l1 7.564E-02 1.101E+12 3.393E+02 2.058E+03 1. 378E+03 1. 830E+OO 1. 373E+03 1.353E+03 1.537E+03