SKI Report 97:26
Reliability of Piping System
Components
Framework for Estimating Failure
Parameters from Service Data
Ralph Nyman
Damir Hegedus
Bojan Tomic
Bengt Lydell
December 1997
ISSN 1104-1374 ISRN SKI-R--97/26--SESKI Report 97:26
SKI/RA-018/97
Reliability of Piping System
Components
Framework for Estimating Failure
Parameters from Service Data
Ralph Nyman
1Damir Hegedus
2Bojan Tomic
2Bengt Lydell
3December 1997
1 Swedish Nuclear Power Inspectorate, Department of Plant
Safety Assessment (SKI/RA), SE-106 58 Stockholm, Sweden
2 ENCONET Consulting GesmbH
Auhofstraße 58 A-1130 Vienna, Austria
3 RSA Technologies
1736 Promenade Circle Vista, CA 92083-6172, U.S.A.
Disclaimer: This report concerns a study conducted for the Swedish Nuclear Power Inspectorate (SKI). The
conclusions and viewpoints presented in the report are those of the authors and do not necessarily coincide with those of the SKI.
TABLE OF CONTENTS
1. INTRODUCTION ……….. 1
1.1 Project History ……….. 1
1.2 Technical Scope & Organization of the Project …….. 2
1.3 Piping Reliability Considerations ……….. 4
1.4 Framework for Piping Reliability Analysis ……….. 5
1.5 Scope Limitations ……….. 8
1.6 The Intended User of the PFCA Framework & Data …….. 9
1.7 Database Availability ……….. 9
1.8 Organization of the Report ……….. 10
1.9 References ……….. 10
2. UNIQUE PROBLEMS IN PIPING RELIABILITY ANALYSIS ……….. 12
2.1 Passive vs. Active Component Reliability ……….. 12
2.2 Component Boundary & Parameter Estimation …….. 13
2.3 PSA vs. PFM ……….. 13
2.4 Discussion ……….. 15
3. SERVICE DATA ON PIPING ……….. 16
3.1 Pipe Failure Data – Sources of Uncertainty ……….. 16
3.2 The SLAP Database Content & Coverage ……….. 17
3.3 The Reporting of Piping Failures ……….. 19
3.4 Conditional Factors of Pipe Failure ……….. 28
3.5 Time-Dependent vs. Demand-Dependent Failures …….. 32
3.6 Random vs. Systematic Failures ……….. 33
3.7 ‘Old’ vs. ‘New’ Service Data ……….. 35
3.8 Discussion ……….. 35
3.9 References ……….. 36
4. DATA REDUCTION ……….. 38
4.1 Models for Estimating Pipe Failure Rates ……….. 38
4.2 Reliability Attributes & Influence Factors ……….. 39
4.3 Determining Attributes from Service Data ……….. 41
4.4 Reliability Influence Factors ……….. 47
4.5 The Interim SLAP Reliability Correlation ……….. 56
4.6 Discussion ……….. 57
4.7 References ……….. 58
5. THE ‘PFCA’ FRAMEWORK ……….. 60
5.1 An Overview of the ‘PFCA’ Framework ……….. 60
5.2 The ‘PFCA’ Steps ……….. 63
5.3 Guiding Principles ……….. 77
5.4 Discussion ……….. 80
6. SUMMARY & RECOMMENDATIONS ……… 83
6.1 Overview of the Technical Approach ……… 83
6.2 Recommendations for Further Work ……… 84
Appendix A: SOURCES OF SERVICE DATA ……… 86
Appendix B: RAW DATA SUMMARIES ……… 94
Appendix C: ABBREVIATIONS, ACRONYMS & GLOSSARY .….. 108
R E M A R K – THIS VERSION OF THE SKI REPORT 97:26, IS A COPY OF THE ORIGINAL FILES.
THIS COPY IS STORED AS AN ACROBAT 3.0 FILE.
THE ELECTRONIC COPY (pdf-file) OF THE REPORT DO NOT HAVE THE SAME PAGE NUMBERING AS THE PRINTED REPORT.
LIST OF FIGURES
1-1 The Approaches to Estimating Piping Reliability ……… 4
1-2 The Five-Step ‘PFCA’ Framework ……… 6
1-3 The SLAP Database and the ‘PFCA’ Framework ……… 7
3-1 Overview of Database Content by System Category ……… 18
3-2 Pipe Failure Mode Definitions……… 21
3-3 Development of the SLAP Database - The Event Review Process ….. 21
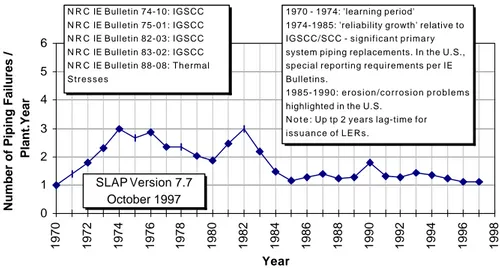
3-4 The SLAP Database Content - Failure Trends ……… 28
3-5 Overview of Systematic Pipe Failures in SLAP Database ………… 34
4-1 Simplified Root Cause Perspective on Attributes & Influences …….. 40
4-2 Conditional Probability of Rupture ……… 44
4-3 Conditional Probability of Rupture for IGSCC-Susceptiple Pipes … 44 4-4 Conceptual Relationship Between Attributes & Influences ………… 48
4-5 Hazard Plot ……… 56
5-1 The Five-Step ‘PFCA’ Framework ……… 61
5-2 Illustration of the Data Needs - Frequency of Pipe Failure ………… 63
5-3 Step 1 of the ‘PFCA’ Framework - Application Requirements … 66 5-4 Blank Sample Spreadsheet ……… 68
5-5 Step 2 of the ‘PFCA’ Framework - Rupture Probability ………… 70
5-6 Step 3 of the ‘PFCA’ Framework - Influence Factors ………… 71
5-7 Step 4 of the ‘PFCA’ Framework - Rupture Frequency ………… 73
5-8 Conditional Rupture Probabilities for Different Attributes ………… 79
List of Tables
1-1 Examples of Stressors, Degradation & Failure Mechanisms ………… 9
2-1 Differences Between Passive & Active Component Reliability……… 12
2-2 The Difference Between PSA & PFM ……… 14
3-1 The SLAP Database Content (Version 7, Revision 7) ………… 17
3-2 The SLAP Database Content by DN, POS & Cause of Failure………. 19
3-3 Comparison of SLAP & SKI Report 96:20 ……… 19
3-4 Examples of NDE-Based Reporting Criteria ……… 23
3-5 Examples of Primary & Secondary Sources of Service Data ………… 27
4-1 Conditional Probability of Rupture by Attribute ……… 43
4-2 Examples of Different Piping Reliability Attributes ……… 46
4-3 Some Remedies for Mitigation of IGSCC ……… 49
4-4 Examples of Influence Factors and Damage/Failure Locations … 51 4-5 Influence Matrix - An Example ……… 52
4-6 Overall Range of Effect of Influence on Reliability (i) ………… 53
4-7 Overall Range of Effect of Influence on Reliability (ii) ………… 53
4-8 Evaluation of Plant-Specific Influence Factors ……… 55
4-9 Factor of Improvement for Piping Failure Remedies ……… 55
5-1 Probability of DEGB and Leak in RCS Piping ……… 69
5-2 Examples of Literature Data on Component Populations ………… 75
5-3 Examples of Pipe Failure and Rupture Frequency Estimates ………… 78
5-4 Some Pipe Failure Frequency Bases ……… 80
A-1 Selected U.S. NRC Information Notices / Bulletins ……… 89
A-2 Examples of Piping System Exposure Times ……… 92
B-1 Raw Data for (# DN15) Piping ……… 95
B-2 Raw Data for (15 < DN # 25) Piping ……… 97
B-3 Raw Data for (25 < DN # 50) Piping ……… 99
B-4 Raw Data for (50 < DN # 100) Piping ……… 101
B-5 Raw Data for (100 < DN # 250) Piping ……… 103
B-6 Raw Data for (> DN250) Piping ……… 105
SUMMARY
This report summarizes results and insights from the final phase of an R&D project on piping reliability sponsored by the Swedish Nuclear Power Inspectorate (SKI). The technical scope includes the development of an analysis framework for estimating piping reliability parameters from service data.
The R&D has produced a large database on the operating experience with piping systems in commercial nuclear power plants worldwide. It covers the period 1970 to the present. The scope of the work emphasized pipe failures (i.e., flaws/cracks, leaks and ruptures) in light water reactors (LWRs).
Pipe failures are rare events. A data reduction format was developed to ensure that homogenous data sets are prepared from scarce service data. This data reduction format distinguishes between reliability attributes and reliability influence factors. The quantitative results of the analysis of service data are in the form of conditional probabilities of pipe rupture given failures (flaws/cracks, leaks or ruptures) and frequencies of pipe failures.
Finally, the R&D by SKI produced an analysis framework in support of practical applications of service data in PSA. This, multi-purpose framework, termed ‘PFCA’ - Pipe Failure Cause and Attribute - defines minimum requirements on piping reliability analysis. The application of service data should reflect the requirements of an application. Together with raw data summaries, this analysis framewok enables the development of apriori and aposteriori pipe rupture probability distributions. The framework supports LOCA frequency estimation, steam line break frequency estimation, as well as the development of strategies for optimized in-service inspection strategies.
SAMMANFATTNING
Statens Kärnkraftinspektion (SKI) har under perioden 1994-97 bedrivit ett forsknings- och utvecklingsproject med avsikt att bestämma rörbrottssannolikheter utgående från drifterfarenheter. Föreliggande rapport utgör slutgiltlig dokumentering av resultat från projektarnbetet. Resultaten från arbetet utgörs av:
(1) Händelsebaserad databas över intäffade skador i kärnkraftverk under perioden 1970-1997. Tyngdpunkten ligger på amerikanska ock nordiska drift- erfarenheter. Storleksordningen 2400 skaderapporter har insamlats och bearbetats.
(2) Datahaneterings- och dataanalys baserad på tillämpning a begreppen ‘tillförlit-lighetsattribut’ och ‘influensfaktorer.’ Resultaten datanalysen redovisas I form av rörskadefrekvenser och betingade brottsannolikheter.
(3) Generella riktlinjer för tillförlitlighetsanalys av rörsystem i kärnkraftverk. Dessa riktlinjer innhåller minimikrav beträffande uppläggning och dokumentering av analyser inom ramen för PSA-tillämpningar.
ACKNOWLEDGEMENTS
The authors of SKI report 97:26 greatfully acknowledge the extensive support and encouragement from numerous industry organizations and nuclear safety professionals throughout Europe and the USA. A special thank you is extended to Messrs. Rudolf Häussermann and Henk van Ojik of Kernkraftwerk Leibstadt AG (KKL, Switzerland), Messrs Ralph-Michael Zander and Adelbert Gessler of Kernkraftwerke Gundremmingen Betriebsgesellschaft mbH (KGB, Germany), Kalle Jänkälä (IVO International, Ltd.), Dr. Yovan Lukic (Arizona Public Service), and Dr. Ching Guey (Florida Power & Light).
This final project report benefitted from the constructive critique by Dr. Roger Cooke (Delft University of Technology, The Netherlands), Ms. Jette Paulsen (Risø National Laboratory, Denmark), and Mr. Sture Andersson (S-A Ingenjörsbyrå AB, Sweden).
SPECIAL NOTE ON TERMINOLOGY
The term ‘sterss corrosion cracking’ (SCC) is normally used to characterize a group of degradation mechanisms involving environment- and stress-induced crack propagation in austenitic stainless steel piping. Included among SCC-mechanisms are: intergranular SCC, transgranular SCC, irradiation induced SCC, etc. Throughout this report we have used SCC to mean stress corrosion in PWR environments, and IGSCC to mean stress corrosion in BWR environments.
Throughout SKI Report 97:26 the term ‘failure’ implies a degradation of the structural reliability resulting in repair or replacement of a section of piping or an individual pipe fitting. The mode of failure is either a flaw/crack/thinning, leak or rupture corresponding to incipient, degraded and complete failure, respectively.
1
INTRODUCTION
This report summarizes results and insights from the final phase of an R&D project on piping reliability sponsored by the Swedish Nuclear Power Inspectorate (SKI)1. The technical scope includes the development of an analysis framework for estimating piping reliability parameters from service data.
The project has benefited from previous efforts to derive failure parameters from service data. It differs from these earlier efforts by having had access to a broader and more extensive database on piping failures, however. The present work has focused on practical, engineering-oriented interpretations of the service data. The purpose of this final report is to present the requirements on input and output activities of a five-step analysis framework for piping reliability analysis. Explorations of industry-wide and plant-specific operational data via conditional factors of piping reliability are central to this analysis framework.
1.1
Project History
Among the motivations behind this SKI-funded project were: 1) Requirements for detailed service data and analysis techniques for parameter estimation in support of PSA applications and PSA-based evaluations of licensee submittals involving piping system modifications; 2) A need for improved treatment of piping reliability in today’s PSA studies; and 3) Improved analysis of service data on piping systems2.
Traditionally, PSA studies have not included detailed analyses of passive component failures. Usually the passive components have been excluded from system models. The argument for doing so was that the failure rates were considered negligibly small. Furthermore, most PSAs modeled initiating events3 caused by passive component failures as single basic events or ‘black boxes.’ As the nuclear power plants are getting older, a critical evaluation of these analysis practices is needed, however. Central to the project was the development of an event-based, relational database on the service experience with piping systems in nuclear power plants worldwide. The work also included the development of a framework for analyzing these data in the context of PSA application requirements. Initiated in the fall of 1994, the project has been performed in three phases:
1
Copies of earlier project reports and conference papers (from PSAM-III and PSA’96) are available from the Swedish Nuclear Power Inspectorate as hard copies or in PDF format (Adobe Acrobat 3.0).
2
Includes PSA-based event analysis and precursor evaluations of piping system failures such as the one performed by VTT (1994)[1-1].
3
As examples, loss of coolant accidents (LOCAs), intersystem LOCA (ISLOCA), internal flooding due to service water system piping break/rupture.
(1) Design of an event-based, relational database in MS-Access®, and preliminary gathering of data sources with emphasis on piping failures in Swedish and U.S. nuclear power plants and Russian-designed plants (i.e., RBMKs and WWERs). A first database version was available in the spring of 1995. At that time it included about 1,500 failure reports. Insights from reviews of an additional ca. 300 piping failures in non-nuclear facilities enabled a limited comparison between nuclear industry and chemical process industry data4.
(2) Detailed review of previous efforts to develop failure parameters based on operational data. In addition, an extensive survey was performed on the estimation of loss-of-coolant-accident (LOCA) frequencies in over 60 PSA studies. The results of the Phase 2 of the project included a definition of requirements for a piping reliability analysis framework using operational data. The work in Phase 2 was documented in four SKI Reports published during 1996[1-2,3,4,5]. These reports included some preliminary insights from database explorations. (3) The final phase has concentrated on the development of an analysis framework. This framework has been greatly influenced by insights from analyzing the operational data. The database development has continued throughout Phase 3, and it has benefited from access to proprietary service data from five European utilities. The analysis framework builds on the concept of ‘conditional factors’ of piping failure, which includes evaluations of the unique reliability attributes and influence factors affecting or controlling the piping integrity.
Throughout the R&D, the project team has sought input from the international nuclear industry and the research community. Volume 1 of the four technical reports generated by Phase 2 of the project were peer reviewed by a team of experts on plant operations, PSA and structural reliability. Peer review comments were received from Arizona Public Service, EQE International, Florida Power & Light Company, IVO Consulting Oy., Kernkraftwerk Leibstadt AG, and Scientech Inc. This final project report has been peer reviewed by Dr. Roger Cooke (Delft University of Technology, The Netherlands), Ms. Jette Paulsen (Risø National Laboratory, Denmark) and Mr. Sture Andersson (S-A Ingenjörsbyrå AB, Sweden).
1.2
Technical Scope & Organization of the Project
Based on the analysis of service data, this SKI-sponsored project attempts to improve the PSA-treatment of piping reliability. This R&D was prompted by a need to develop an integrated analysis approach to support PSA applications, including the evaluation of the impact on plant risk by modified in-service inspection programs. Also, the project addressed new requirements to be placed on the incorporation of piping reliability into PSA studies on older nuclear power plants.
The technical scope was limited to evaluations of event data extracted from licensee event reports.
4
The conclusions from this comparison were: a) the data from non-nuclear facilities have little or no relevance to the piping systems in nuclear power plants; and b) the coverage and completeness of the non-nuclear operating experience data repositories is very low.
The intended applications of the event database and the analysis framework include the following: − LOCA frequency estimation. Under the assumption that the piping systems that are part of
the reactor coolant pressure boundary (RCPB) have been evaluated in terms of number of components (e.g., welds, straight sections, elbows, tees), material, and operating experience, the data and the analysis framework support plant-specific LOCA frequency estimation. − Initiating event (IE) estimation. For IEs such as main steam line break, internal flooding due
to service water system pipe rupture, the data and analysis framework support plant-specific IE frequency estimation.
− PSA applications. The data together with the analysis framework support plant-specific, optimization of in-service inspection (ISI) programs. The pipe rupture frequency is calculated for individual pipe sections. Based on plant risk, a modified inspection approach would eliminate low-risk pipe sections.
Piping reliability is a very complex topic and this final project report should be viewed as a first step to develop detailed analysis guidelines, which are acceptable to PSA practitioners and safety engineers. Additionally, the final project report develops a basis for guidelines on how to report and evaluate piping failures. Specifically, this report covers the following aspects of piping reliability: 1) The determination of the frequency of piping degradations or failures including cracks, leaks and ruptures; 2) Estimation of the probability of pipe rupture given a degradation of a piping system; and 3) Estimation of piping reliability parameters for input to PSA models. The report also identifies areas in need of additional work. Future efforts, especially in the area of data collection and data analysis, should be pursued within the international cooperative nuclear safety R&D programs.
Coordinated by the SKI Project Manager, Mr. Ralph Nyman (Department of Plant Safety Assessment), the technical work was performed jointly by ENCONET Consulting Ges.m.b.H. and RSA Technologies. Phase 1 of the project, initiated in October of 1994, produced the database design, while Phase 2, initiated in April of 1995, included surveys of the PSA state-of-analysis-practice with respect to LOCA frequency assessment. In Phase 3, Mr. Bengt Lydell (RSA Technologies) was the principal investigator and the author of the final project report.
During the fall of 1996, preliminary data analysis insights from Phase 3 were presented to OKG AB and IVO Consulting Oy, respectively. Comments and recommendations from these two Nordic industry organizations were incorporated in the data reduction and analysis efforts performed during the 2nd half of 1996 and the 1st half of 1997.
Furthermore, an information exchange was also established with the parallel Nordic Nuclear Safety Research Program ‘NKS/RAK-1.2: Strategies for Reactor Safety - Preventing Loss of Coolant Accidents’ in which a probabilistic fracture mechanics model was developed to calculate pipe break probabilities due to IGSCC in Swedish BWRs.
The ‘International Seminar on Piping Reliability’5, held on September 30 and October 1, 1997, represented the formal conclusion of the SKI R&D project.
5
Seminar on Piping Reliability: Presentation of Piping Reliability Research in Support of the Nordic PSA Program & Other SKI Sponsored Projects, September 30 - October 1, 1997, Sigtuna (Sweden). Copies of the Proceedings of the seminar (SKI Report 97:32) are available from the Swedish Nuclear Power Inspectorate.
1.3
Piping Reliability Considerations
The reliability of piping system components is of great importance to the nuclear industry. Piping systems are used extensively, and the degradation or failure of piping has significant safety and financial implications. The modern PSA studies should account for potential piping failures by acknowledging the available operating experience. Also, systematic evaluations of the experience with non-destructive examination (NDE) and in-service inspection (ISI) would benefit from the access to a comprehensive database on the operating experience with piping systems to determine the effectiveness of NDE/ISI. In part, this project was motivated by the ongoing Swedish plant renovation and modernization projects and the requirements for improved treatment of LOCA frequency estimation in the Swedish PSA studies.
As expressed by the American Society of Mechanical Engineers (ASME) Research Task Force on Risk-Based Inspections[1-6]: “... the task of estimating piping reliability is complex, uncertain and costly ...” There is no one best method to estimate failure probabilities. Therefore, the estimation process has to rely on insights from the relatively large number of incipient and degraded failures, which have occurred in NPPs worldwide. Since major structural failures are rare events, safety engineers and PSA practitioners should always consider the broadest possible database on operational events. Because of the complex nature of piping reliability, it is equally important that there exists synergy between PSA and structural mechanics including probabilistic fracture mechanics (PFM). The methods for assessing piping reliability use a combination of techniques as indicated in Figure 1-1.
Results from Analysis Using Probabilistic Fracture Mechanics
Expert Judgment Elicitation and Discussion
Estimated Failure Rates & Rupture Probabilities Direct Estimation Using Service Data
(This Project)
Figure 1-1: The Approaches to Estimating Piping Reliability.
With emphasis on applications of historical data (i.e., service data), the analysis framework, which was developed by the project, addresses the different options available in parameter estimation. This framework also describes the requirements to be placed upon probabilistic fracture mechanics studies; e.g., degradation mechanisms to consider, qualification of input and output data.
In PSA, a lack of quantitative models (i.e., decomposition and holistic models of reliability) and failure data has directed practitioners to WASH-1400 (the Reactor Safety Study of 1975). The
validity of LOCA frequencies and piping failure rates often has been cited solely on the basis of referencing the WASH-1400, and without questioning the old data or the approach to deriving or inferring failure parameters in that study. In the opinion of the authors of this SKI Report, the available operational data should always be systematically explored when deriving LOCA frequencies. It is especially important that the available, current experience data be explored by comparing industry-wide and plant-specific service data. Analysts should take into account the current state-of-knowledge about structural mechanics and degradation mechanisms.
1.4
Framework for Piping Reliability Analysis
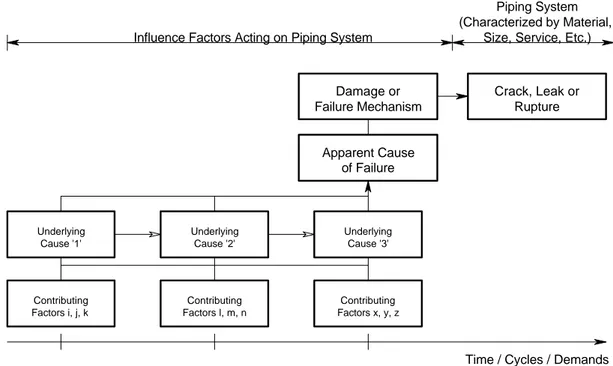
The analysis framework, developed by the project, was fashioned after the results and insights from analyzing a large volume of service data. Therefore, this framework is data-driven. Parameter estimation based exclusively on experience data is not advisable, nor feasible for all intended applications. Throughout an estimation process, it is highly recommended that expert judgment by structural expertise be considered. The analysis framework, which is called the ‘Pipe Failure Cause and Attribute Framework’ (PFCA), is a top-down approach favoring decomposition of a given piping reliability problem according to reliability attributes and influences; c.f. Figure 1-2. It is a top-down approach since an analysis would begin by specifying the requirements of an application. That is, the framework builds on the analysts' understanding of the design and operational factors, operating history, inspection history, and environmental influences that affect piping reliability. The framework consists of five steps with inputs, analytical activities or deliberations, rules and outputs:
(1) Application Requirements. The input consists of descriptions (e.g., isometric drawings, material specifications) of a piping system, and service history. The output is a concise description of the planned application; e.g., estimation of LOCA or main steam line break (MSLB) frequency. The intended application determines how to select generic piping reliability parameters. It also determines how reliability attributes and influences are evaluated and used. Finally, the application requirements determine which piping system component boundaries to use; e.g., piping section/segment definitions. Examples are given of typical requirements with discussion of the implications for the subsequent analysis steps.
(2) Raw Data, Piping Population Data & Generic Reliability Parameters. The framework includes the necessary analysis techniques and raw data for calculating plant-specific parameters. The framework comes with tabulations of raw data and piping component population data for a selection of different plant types and systems. Pipe failures are rare events, and the framework includes consideration of Bayesian statistics. First, application-specific priors are developed, and second, the user performs a detailed evaluation of plant-specific operating experience (including inspection records and other relevant information) to estimate the plant-specific parameters. Hence, the framework makes a distinction between application-specific and plant-specific parameters. The former enables the selection of the most appropriate and relevant operating experience to be used.
Figure 1-2: The Five-Step PFCA Framework for Piping Reliability Analysis.
(3) Reliability Influences & Review of Plant-Specific Experience. The step from application- to plant-specific parameter estimation is taken via application of reliability influence matrices (or check lists). Extracted from SKI’s pipe failure event database (SLAP; c.f. Figure 1-3), the framework provides detailed influence matrices (by major degradation or failure mechanism) that list potential plant-specific influences and their relative contribution to reliability. These matrices are the templates to be used by PSA practitioners, who are familiar with model requirements, and structural experts intimately familiar with the piping system designs, the operating experience, and the NDE/ISI practices.
Step 1: Define Application Requirements
The purpose is to determine the key reliability attribute(s).
Output: Definition of plant-specific influence factors and their effect on piping reliability.
Output: Reliability attributes with
justifications.
Output: 'Qualification' of parameter
estimates. Step 3: Reliability Influence Factors
Generic matrices used as templates for reviewing plant-specific operational data
to enable the modification of a generic failure distribution.
Step 5: Sensitivity & Uncertainty Analysis
Using the output from previous steps, the plant-specific parameters are evaluated
relative to sensitivites / uncertainties.
Output: Condition probability of pipe rupture for an attribute.
Step 4: Piping Component Boundary
Depending on application requirements and outputs from Step 3, this step determines
the pipe failure frequency and its correct dimension; e.g., 1/reactor-year and weld.
Output: Plant-specific pipe rupture
frequency compatible with PSA model specs. Step 2: Conditional Rupture Probability
Based on Step 1 and the data summaries in Appendix B (SKI Report 97:26) estimate
Failure Data Sources
LERs, PNOs, ROs, IAEA/NEA Incident Reporting System, etc.
SLAP DATABASE
('Archive' of Failure Reports)
Data Reduction Data Manipulation & Analysis
The PFCA Framework
(see Figure 1-2)
Figure 1-3: The SLAP Database and the ‘PFCA? Framework.6
(4) Piping Component Boundary Definition. The review in Step 3 should be done on the basis of isometric drawings, and the output could be in the form of pipe section/segment definitions, and a quantitative basis for modifying generic reliability parameters, with proper justifications. The purpose of Step 4 is to define the dimension of the parameter estimates and the PSA model representation of piping failures. The dimension (e.g., failure/system-year, failure/‘length-of-piping’-and-failure/system-year, failure/weld-and-year) is a function of the predominant degradation or failure mechanism, material, system layout, etc. With respect to the model representation, the question addressed by Step 4 is whether piping reliability should be considered at the cutset level or at a different level in the PSA model structure? In the opinion of the project team, whenever PSA-based applications or risk monitoring requirements have been defined, a high level of model discrimination is preferred over 'black box' models. Most importantly, the boundary definition should be a function of the type of degradation or failure mechanism affecting a piping system.
(5) Statistical Analysis & Uncertainty Analysis. The framework recognizes the importance of analyzing uncertainties. The sources of uncertainties are identified and evaluated in Step 5. It is recognized that in the final derivation of plant-specific parameters, expert judgment elicitation and engineering evaluations will be combined with estimates that are based on operational data. Ultimately the goal of performing uncertainty analysis is to qualify those conclusions that are made about piping reliability based on point estimate evaluations. It should also be used to identify where improving the state of knowledge can lead to maximum benefit with respect to an accurate assessment of piping reliability.
Depending on the scope of an analysis, an application of the framework may involve only Steps 1 and 2, or all five steps. Rigorous applications would be relatively time-consuming, and could require extensive inputs from structural expertise. The users of this framework are encouraged to explore the raw data on piping failures beyond the scope of the present report. Invariably it is expected the users consist of a team of experts, which determines what the unique failure modes and degradation and mechanisms are, and where faults (e.g. flaws/cracks, leaks) in a given piping system are most likely to occur.
6
LER = Licensee Event Report; PNO = Preliminary Notification of Unusual Event or Occurrence; RO = Reportable Occurrence.
1.5
Work Scope Limitations
The R&D-project considered service data involving degradation mechanisms (or aging mechanisms, due to corrosion, erosion/corrosion, stress corrosion cracking) and failure mechanisms (such as severe overloading due to water hammer, inadvertent over-pressurization); c.f. Table 1-1. The emphasis was on degradation mechanisms acting on piping systems within the RCPB, however. Additional study scope limitations included:
- The survey of service data emphasized leaks and ruptures as documented in public information sources (e.g., Swedish and U.S. licensee reporting systems). Service data on flaws/cracks were selectively considered; i.e., significant events with potential generic implications. Normally, information on flaws/cracks are included in special outage inspection reports. Such reports were not available to the project.
- The study did not include a systematic and detailed determination of the frequency of water hammer events in piping systems. Only water hammer events, which resulted in significant pipe damage (e.g., major leak, rupture or severance) were considered;
- The study did not collect piping component population data. This report emphasizes the estimation of relative pipe failure parameter estimates rather than absolute estimation. Detailed collections of piping component population data will evolve with the number of plant-specific applications of a piping reliability analysis framework such as the PFCA. Appendix B includes a selection of component population data for different piping systems and types of nuclear power plants. These population data were extracted from public domain documents.
- The study did not consider degradation or failures of internal reactor components such as jet pump risers in some BWRs7. In other words, only piping system components external to the reactor pressure vessel were considered.
7
As an example, see U.S. NRC Information Notice 97-02 (February 6, 1997): Cracks Found in Jet Pump Assembly Elbows at Boiling Water Reactors.
Table 1-1: Examples of Stressors, Degradation Mechanisms / Failure Mechanisms & Failure Modes of Piping Systems8. Stressors Degradation / Aging Mechanisms Failure Mechanisms Failure Modes Single-phase flow Two-phase flow Temperature gradients and transients Environmental stress / sensitization Erosion / corrosion Erosion / corrosion Fatigue Stress corrosion cracking ( PWSCC / IGSCC / TGSCC) Crack / leak / rupture d:o d:o d:o d:o Vibration Water hammer / seismic events / testing / drop of heavy load Fatigue / overload Fatigue / overload / overpressurization Crack / leak / rupture d:o + severance / deformation / distortion
1.6
The Intended User of the ‘PFCA’ Framework & Data
This report does not include processed failure parameters for direct input to PSA models. It is a ‘basis document’, which identifies the unique aspects of piping reliability that require detailed, explicit consideration in the parameter estimation. Therefore, the report is intended for the advanced PSA practitioner with prior experience of data analysis. By using the raw data summaries (in Appendix B) and an analysis framework (Section 5), the practitioner is given the necessary tools and techniques to pursue plant-specific applications of a data-driven model of piping reliability.
The proposed analysis framework is not a prescriptive, step-by-step analysis procedure. Instead, the framework defines a minimum set of requirements on piping reliability analysis based on interpretations of service data. The user of the framework is encouraged to explore the service data beyond the presentations and representations of this report.
1.7
Database Availability
The project has produced a large, relational database in MS-Access® on pipe failures in nuclear power plants worldwide. The computer file size (in compacted form) of the current version is approximately 2.5 Mb. Each data record (i.e., failure event) consists of 54 data fields, which provide design information (material specifications, size), event narratives, results from event analyses (e.g., root cause analyses), and information on the effect on plant operation[1-7]. The database content is proprietary to the SKI. Nuclear safety professionals and PSA practitioners interested in reviewing
8 Adapted from Conley, D.A., J.L. Edson and C.F. Fineman, 1995. Aging Study of Boiling Water Reactor High Pressure
and applying the full database must contact the SKI in writing to establish the terms-and-conditions for database access9.
1.8
Organization of the Report
The report consists of six sections and three appendices. Section 2 includes a statement on the unique passive component reliability issues. Also included in Section 2 is an overview of the potential interfaces between data-driven models and probabilistic fracture mechanics, followed by a brief discussion on the role of material sciences in PSA. The technical basis for the PFCA Framework is developed in Sections 3 and 4. With the objective of summarizing sources of statistical uncertainties, Section 3 describes the operational data on piping failures, and the coverage and completeness of the SLAP database. This presentation sets the stage for Section 4, which describes the conditional factors of piping failures. Specifically, Section 4 presents the definitions of piping reliability attributes and influence factors and how they are used to reduce, manipulate and analyze the service data in the SLAP database.
Section 5 describes each of the five steps of the PFCA Framework, discusses the activities pertinent to each step, and presents the rules or recommended implementations for each step. The section illustrates the use of the framework, and includes a discussion on statistical uncertainties as they apply to piping reliability analysis. Finally, Section 6 presents recommendations for pilot applications and future short- and long-term R&D, together with the conclusions.
There are three appendices to the report. Appendix A presents the pipe failure event data sources used in developing the SLAP database. Appendix B is a compilation of a selection of raw data to be used as input to the PFCA Framework. Appendix C, finally, contains a list of abbreviations and acronyms together with a glossary of technical terms.
9
Letters should be forwarded to: Swedish Nuclear Power Inspectorate, Plant Safety Assessment - Dept. RA, Att.: Mr. Ralph Nyman, SE-106 58 Stockholm, Sweden.
1.9
References
(1-1) Holmberg, J. And P. Pyy, 1994. Example of a PSA-Based Analysis of an Occurred Pipe Break at TVO I, NKS/SIK-1(93)17, VTT Industrial Automation, Espoo (Finland).
(1-2). Swedish Nuclear Power Inspectorate, 1996. Reliability of Piping System Components. Volume 1: Piping Reliability - A Resource Document for PSA Applications, SKI Report 95:58, Stockholm (Sweden).
(1-3). ibid, Volume 2: PSA LOCA Database; Review of Methods for LOCA Evaluation Since WASH-1400, SKI Report 95:59, Stockholm (Sweden).
(1-4). ibid, Volume 3: Piping Reliability - A Bibliography, SKI Report 95:60, Stockholm (Sweden).
(1-5). ibid, Volume 4: The Pipe Failure Event Database, SKI Report 95:61, Stockholm (Sweden).
(16). Balkey, K.R. et al, 1992. RiskBased Inspection Development of Guidelines. Volume 2 -Part 1: Light Water Reactor (LWR) Nuclear Power Plant Components, CRTD-Vol. 20-2, The American Society of Mechanical Engineers, New York (NY), ISBN 0-7918-0658-8, pp 24-27.
(1-7) Lydell, B.O.Y., 1997. SKI’s Worldwide Pipe Failure Event Database – SLAP, Version 7.7, RSA-R-97-22, RSA Technologies, Vista (CA).
2
UNIQUE PROBLEMS IN PIPING
RELIABILITY ANALYSIS
The development of comprehensive databases and analysis frameworks for passive component (e.g., piping) reliability has lagged behind the corresponding efforts for active component reliability. In part, this discrepancy is a function of the complex nature of piping reliability. While a consensus exists regarding the analytical treatment of active component reliability, no such consensus has evolved for passive components. This section investigates the unique differences between active and passive component reliability. The motives of the SKI-funded R&D are delineated in this section.
2.1
Passive vs. Active Component Reliability
Piping systems are designed to high quality standards. These systems represent an important safety barrier, which forms one of several elements in the defense-in-depth concept of nuclear safety. Catastrophic piping failures are rare events, thus proving the effectiveness of the design codes and standards. Piping systems are susceptible to aging effects, however. Since piping systems cannot be subjected to the same maintenance and replacement strategies as the active components, a fundamental question arises relative to the importance of aging effects: How should the limited service data be used to address these aging effects in today’s PSA applications? An overview of the basic differences between passive and active component reliability is found in Table 2-1.
Table 2-1: Basic Differences Between Passive & Active Component Reliability.
Feature Passive Component Active Component
Component Boundary Definition
Continuous (or ‘extended’; the piping system boundary is defined by the plant system boundary. That is, the boundary of a feedwater piping system is defined by the feedwater system boundary.
Discrete well (uniquely) defined component boundaries. Data collections such as the T-Book or IEEE Std. 500 contain details on component boundaries.
Failure Rate Dimension
1/(Time · Extension) -- the ‘extension’ cannot be universally defined. Could be length of piping, number of pipe sections, number of piping system components.
Uniquely defined by: dimension ‘time’ or ‘demand’.
Frequency of Failure
Rare events Frequent events
Component Type Many different types distinguished by material, diameter, environment, process medium, operating environment, etc.
Failure Modes and Failure Causes
A spectrum of failure modes; from small to large leaks to ruptures. The susceptibility to failure strongly dependent on design and degradation and failure mechanisms. Difference with respect to cause and severity.
Limited number of failure modes (e.g., failure to start, failure to run).
2.2
Component Boundary & Estimation of Failure Parameters
By definition, a component boundary clearly relates all interfaces of a specific component to other components in the system with which it interfaces via hardware and software. Therefore, a failure of a component relates to a clearly defined component boundary. In other words, the physical location of a failure corresponds with a boundary definition. Unlike active components (e.g., MOVs, pumps, electrical breakers/switches), for piping systems one cannot define a universal piping component boundary, however. The problem of estimating pipe failure rates and failure probabilities from scarce service data is compounded by the fact that the large volume of piping in a nuclear power plant (NPP) consists of many different types of piping systems.
The piping systems range from small-diameter to large-diameter piping, primary system piping to support system piping, etc. Furthermore, the piping systems differ according to material, process medium and operating conditions. The failure susceptibilities are functions of the design and operational characteristics. Obviously, the analysis of service data on piping failures must differentiate between type of piping system, operating environment, cause and severity. Subsequently, the estimation of failure parameters and the definition of appropriate component boundaries should reflect these unique features of a piping system (i.e., type, environment, and cause/severity). We calculate the failure rate of piping from:
λPIPING = (Number of Failures)/(Time · Extension) (2-1)
where ‘Extension’ = Length of piping, or number of piping system components in the system for which the failure parameter is estimated. Could be number of pipe sections, where a section could be a segment of piping between major discontinuities such as valves, pumps, reducers, tees.
The estimation of failure parameters builds on access to homogenous data on events within a clearly defined component boundary. This means that the service data must be pooled according to type of system, environment, cause and severity, and component boundary. The extension follows on having a full understanding of ‘why-where-how’ piping systems fail.
2.3
PSA vs. PFM
The unique differences between passive and active component reliability, and the difficulties associated with failure parameter estimation using scarce service data have been recognized and debated for a long time. As an alternative to the ‘data-driven models’ of piping reliability, the material sciences have proposed the application of fracture mechanics models. These models enable the calculation of failure probabilities assuming that a piping system is susceptible to anticipated degradation mechanisms. Especially aging effects (such as stress corrosion cracking), which develop over a long time period.
There is a long-standing debate (at least since the early 1970’s) between the PSA and material sciences disciplines regarding the areas of applicability of data-driven models and PFM. To the PSA practitioners the analytical problems associated with rare events are well understood. According to the material sciences, it is impossible to make realistic estimates of the probability of pipe rupture when the service experience is zero failures in, say, 8,500 reactor years10. For this reason alone, direct estimation using service data should, and cannot, not be pursued. In fact, the pursuit of service data collections has been questioned. What are the areas of applicability of data-driven models and PFM models? In its most basic form, the frequency, fR, of a pipe rupture is calculated from the following symbolic expression:
fR = fFAILURE · pRUPTURE | FAILURE (2-2)
where fR = frequency of a pipe rupture;
fFAILURE = frequency of a pipe failure (e.g., flaw/crack, leakage);
pRUPTURE | FAILURE = conditional probability of rupture given a flaw/crack or leakage.
The difference between PSA and PFM lies in the way the conditional probability of pipe rupture is calculated; c.f. Table 2-2. In PSA the estimation is performed through detailed evaluations of service data combined with application of Bayesian statistics (in the case of zero failures) and expert judgment. The material sciences use fracture mechanics models and expert judgment.
10
According to IAEA data, at the end of 1996 the worldwide NPP operating experience was about 8,500 reactor-years. During that time there have been no ruptures in medium- to large-diameter piping inside the RCPB.
Table 2-2: The Difference Between PSA and PFM.. Method Estimation of fFAILURE Estimation of PRUPTURE | FAILURE Comment
PFM Direct estimation from service data
Application of fracture mechanics theory to the analysis of crack growth
Assumes anticipated degra-dation (i.e., long time between crack initiation → leak → rupture) in austenitic steels. No treatment of uncertainties. Requires population data. Explicit treatment of the reliability of in-service inspection methods. Parametric models which enable sensitivity analysis.
PSA Direct estimation from service data
Direct estimation from service data
Requires population data. Implicit treatment of the reliability of in-service inspection methods. Parametric studies feasible. Controversial in the context of LOCA frequency estimation.
As summarized by Table 2-2, the approach to the estimation of pipe rupture frequency in PFM and PSA builds on interpretations of service data. An outstanding issue is the estimation of the conditional pipe rupture probability. Ultimately, the requirements that are placed upon an analysis determine the selection of methodology. The R&D by SKI to develop a comprehensive database on the service experience with piping systems and the analysis framework, PFCA, supports both technical approaches.
A basic difference between the two approaches is found in the estimation of the conditional rupture probability. Under a similar set of boundary conditions, the two methods tend to produce similar (i.e., the same order-of-magnitude) results, however. The statistical uncertainties are considerable, no matter the technical approach. The proper merging of PSA and PFM depends on the full recognition of the methodological differences. Possibly more important than these methodological differences, PSA and material sciences use different terminology and definitions. Much could be gained from using common terminology:
- On Pipe Failure Mode Definitions: The material sciences tend to define ‘failure’ as a ‘double-ended-guillotine-break’ (DEGB) where the pipe ends are completely separated. PSA distinguishes between ‘flaw/crack’, ‘leak’ and ‘rupture’. In PSA a small leak from a large-diameter pipe could have the same consequence as a large leak from a small-large-diameter pipe.
- On LOCA definitions: Material sciences only consider the DEGB that results in a loss of process medium beyond the make-up capability of safety injection systems. That is, the material sciences are concerned with the LOCA concept as defined by the design basis accident (DBA) in deterministic safety analysis. PSA considers a spectrum of pipe ruptures that could cause a small-small to large LOCAs with or without make-up capability.
A major advantage of PFM lies in its application of parametric models, which enable sensitivity studies, and the evaluation of leak detection and ISI reliability. An advantage of data-driven models is the relative ease by which the applications can be performed. The applications of service data are limited by the quality and completeness of pipe failure event reports, however.
2.4
Discussion
The R&D by SKI were initiated to address the unique problems in piping reliability analysis. Detailed evaluations of service data enabled development of recommendations for how to define piping component boundaries. This R&D also addressed the requirements to be place upon data-driven models of piping reliability. Sections 3 through 6 develop the basic techniques of piping reliability analysis from the perspective of service data.
3
SERVICE DATA ON PIPING
In Section 1 we presented the elements of a framework for analyzing piping reliability, which is based on evaluations of operational data. In this section, we consider the basic principles of how to collect and analyze service data. Also considered is the relationship between past and current reporting practices and the coverage and completeness of service data. The purpose is to address practical considerations in pipe failure data collection. We explore the question whether robust and believable failure parameters can be derived from service data: Does the SLAP database have sufficient depth and detail to support meaningful reliability estimation?
The R&D by SKI has produced a large database (i.e., SLAP) on piping failures. The unique problems associated with operational data and piping reliability estimation were addressed over thirty years ago. Since that time (i.e., 1964-68), several organizations have pursued database development and data analysis. Despite these efforts, no widely recognized PSA-oriented database has emerged. When viewed against the past projects, the uniqueness of SKI’s R&D lies in the depth of the data collection. Reports on incipient, degraded and complete failures have been collected from operating nuclear power plants worldwide. The analysis of these data builds on the concept of ‘conditional factors of failure,’ which emphasizes the relative differences in reliability. These conditional factors relate to design parameters and environmental influences.
3.1
Pipe Failure Data - Sources of Uncertainty
Probabilistic safety assessment (PSA) is a safety assessment tool for nuclear power plants (NPPs). An intrinsic element of PSA consists of the estimation of equipment reliability parameters from plant operating records. The validity of a PSA is a function of how this estimation is performed, and how well the system and plant models reflect an as-built and as-operated NPP. Translating plant records into reliability parameters requires detailed engineering knowledge as well as knowledge of the strengths and limitations of statistical analysis techniques and methods.
Data estimation is done in two steps: 1) Collection of data on occurrences of the events of interest; and 2) Parameter estimation with the aid of statistical analysis techniques and methods. The foundation for believable estimates is laid in step 1. A first consideration of this step involves a determination that sufficiently detailed information has been collected on 'all' relevant failure events.
The completeness of a data collection reflects the scope of an analysis effort as well as the extent of the exploration of different sources of operational data for the nominated failure events. Incomplete data sets could lead to an under-estimation of the data parameters. Step 2 of the data estimation is concerned with the selection of appropriate techniques and methods so that the important factors, which affect reliability, are addressed in sufficient detail.
Extensive use of judgment is made in both these steps. The most extensive use of judgment usually is made in step 1 of the estimation process. Sometimes the available information in the plant records is unclear and incomplete. A reasonable interpretation of such information is impossible without having a detailed knowledge about the specific equipment-related failure modes and failure mechanisms. It is equally important to understand the reporting practices and the bases for maintenance work orders, licensee event reports, etc. In the next sections we address key considerations in collecting data on pipe failure events, and the data coverage and completeness issues.
3.2
The SLAP Database Content & Coverage
Databases on equipment failures must be tailored according to specific objectives. The SLAP database builds on the principle of collecting data on an event and exposure basis. Incorrect or incomplete data interpretations would result from a data collection, which is limited to a fault-count basis. The analysis of conditional factors of piping failures requires access to data collections, which include information on the ‘why-where-how’ failures occurred.
The SLAP database contains information on known (i.e., reported) pipe failures in nuclear power plants worldwide. It covers the period 1970 to the present. In developing the database the scope of the work has emphasized pipe failures in light water reactors (LWRs). Currently (October 1997), the database includes about 2,360 qualified failure reports; c.f. Table 3-1.
Table 3-1: The SLAP Database Content (Version 7, Revision 7).
PLANT TYPE(a) NUMBER OF PLANTS SURVEYE D COVERAGE(b) [Reactor Years] FAILURE MODE
Crack(c) Leak Rupture(d ) BWR LWGR PHWR (CANDU) PWR + WWER 71 19 20 164 1,398 319 354 2,670 114 3 11 55 648 41 75 1206 63 14 14 112 Total: 274 4,741 183 1970 203
Note: (a) The material used in primary system piping differs among the plant types; e.g., industrial
grade vs. 'nuclear grade' stainless steel. Also, as an example, in WWER-1000, the primary system piping material is ferritic steel with austenitic cladding as an anti-corrosion measure. (b) As of 9/30/97; no adjustment made for time in maintenance / refueling outage.
(c) Significant events only: crack depth > 20% of wall thickness. The total number of flaws among the worldwide NPP population is estimated to be at least a factor of 10 larger.
(d) Catastrophic loss of structural integrity and/or leak rate > 5 kg/s (80 gpm), without advance warning; e.g., no drop leakage or leakage large enough to actuate a leak detection system to enable prevention.
The rupture category in Table 3-1 includes two types of events that occurred without advance warning to control room operators: 1) Catastrophic rupture which resulted in complete separation of pipe ends, or major ‘fish-mouth’ opening; and 2) Major crack opening which resulted in leakage in excess of 5 kg/s (80 gpm). The failure reports included in SLAP were all classified according to leak rates. For the majority of the reports, the leak rates were estimated based on event narratives.
Except for the Swedish, U.S. and selected European plants, for which licensee event reports and special failure reports were available, the primary reference used was the IAEA/NEA Incident Reporting System (IRS)[3-1]. By design, the IRS database includes nominated or significant events as submitted by participating organizations. That is, an event report is submitted to IRS when the event is considered by a national coordinator to be of international interest. Approximately 10% of all pipe failure event records were extracted from the IRS database.
Summaries of the SLAP database content by pipe diameter, mode of plant operation when a failure was detected, and type of degradation or failure mechanisms are given in Figure 3-1 and Table 3-2. To date, all large-diameter, complete failures (i.e., ruptures) have occurred in balance-of-plant (BOP) systems, support systems or fire protection system; i.e., LOCA-insensitive piping. Complete failures affecting LOCA-sensitive piping (i.e., piping within the RCPB) have been restricted to small-diameter piping of DN ≤ 25. That is, instrument lines, vent/drain lines, bypass lines and test/sample lines. Finally, the SLAP database content is compared with a recent, independent data collection effort in Table 3-3.
0.00% 2.00% 4.00% 6.00% 8.00% 10.00% 12.00% 14.00% 16.00% <= DN15 (CS) <= DN15 (SS) 15 < DN <= 25 (CS) 15 < DN <= 25 (SS) 25 < DN <= 50 (CS) 25 < DN <= 50 (SS) 50 < DN <= 100 (CS) 50 < DN <= 100 (SS) 100 < DN <= 250 (CS) 100 < DN <= 250 (SS) > DN250 (CS) > DN250 (SS)
Percentage of Failure Records in Database SUPPORT BOP RCPB
Figure 3-1: Overview of Database Content by System Category11.
11 SUPPORT = Support System (e.g., component cooling water, service water, instrument air) ; BOP = Balance of Plant
System (e.g., moisture separator reheater lines, condensate piping); RCPB = Reactor Coolant Pressure Boundary (systems within containment, see Appendix C for definition).
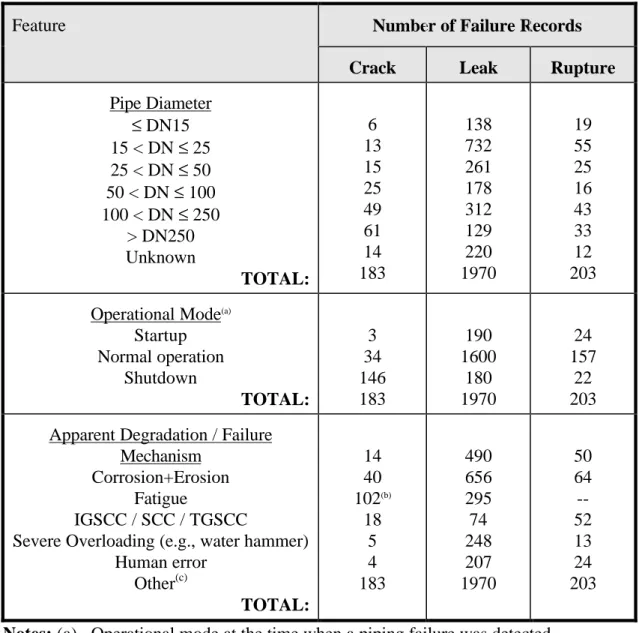
Table 3-2: The SLAP Database Content Organized by Pipe Size, Plant Operational State and
Apparent Cause of Failure (SLAP Version 7, Revision 7).
Feature Number of Failure Records
Crack Leak Rupture
Pipe Diameter ≤ DN15 15 < DN ≤ 25 25 < DN ≤ 50 50 < DN ≤ 100 100 < DN ≤ 250 > DN250 Unknown TOTAL: 6 13 15 25 49 61 14 183 138 732 261 178 312 129 220 1970 19 55 25 16 43 33 12 203
Operational Mode(a) Startup Normal operation Shutdown TOTAL: 3 34 146 183 190 1600 180 1970 24 157 22 203 Apparent Degradation / Failure
Mechanism Corrosion+Erosion
Fatigue
IGSCC / SCC / TGSCC
Severe Overloading (e.g., water hammer) Human error Other(c) TOTAL: 14 40 102(b) 18 5 4 183 490 656 295 74 248 207 1970 50 64 --52 13 24 203
Notes: (a). Operational mode at the time when a piping failure was detected.
(b). Rejectable cracks (crack depth > 20% of pipe wall thickness).
(c). No explicit statement about cause of failure in LER, or results from ongoing investigation not yet available.
Table 3-3: Comparison of the Database Contents in SLAP & SKI Report 96:20[3-2].
Pipe Size SLAP Version 7.7
[Number of Records] SKI Report 96:20 [Number of Records] DN ≤ 25 25 < DN ≤ 100 100 < DN ≤ 300 > DN300
Unknown / Assumed Size(a)
Total: 963 (41%) 521 (22%) 446 (19%) 180 (8%) 246 (10%) 2356 574 (38%) 252 (17%) 155 (10%) 74 (5%) 456 (30%) 1511
Note: (a). Failure report contains no explicit information on diameter.
3.3
The Reporting of Piping Failures
The piping systems in nuclear power plants are designed to high standards, and major failures are rare events. The rare failures have a low frequency of occurrence (e.g., less than, or much less than one failure per plant and year). Not only are the major, catastrophic failures rare events when viewed against a frequency-scale, they are also rare when viewed against a passive component ‘population-scale.’ Each nuclear power plant contains a very large volume of piping components (e.g., many thousands of welds, and several km of length of piping). Therefore, and for any given plant, the ratio of major failures by the total piping component population is a small number (<< 0.1). Most piping failure incidents are incipient or degraded failures with minor or no immediate impact on plant operation and safety. The incipient or degraded failures have a relatively high frequency of occurrence; e.g., equal to or greater than one event per plant and year.
While the volume of technical information on operating experience with piping systems is considerable, the quality of this information varies immensely. Some reports present detailed root cause analysis insights and results (c.f. U.S. NRC, 1997[3-3]), while the majority of the reports contains cursory (and sometimes conflicting) information on the causes and consequences. The determination of root cause involves interpretation of results from visual examinations and, sometimes, detailed metallurgical evaluations of damaged or fractured piping components. In general, failure analyses and reliability analyses of incidents involving piping systems are complex and uncertain.
For the work documented in this report, the main source of information on piping failures was licensee event reports (LERs). The LERs are mainly prepared upon failure conditions, which place the plant operations outside the technical specifications. Rather than evaluations of the root causes, these reports concentrate on the apparent causes of failure. Uniform regulatory reporting requirements do not yet exist, and no industry standards have been developed for the reporting and dissemination of information on piping failures. This lack of detailed reporting protocols reflects the complex nature of piping reliability.
It is the opinion of the authors of this report that the lack of consistent reporting follows on not having a recognized model for analyzing piping reliability. Substantial interpretation of the available failure information is needed to determine the where-why-how a particular piping system failed. The interpretation should reflect the purpose of an analysis and the database design. It is not
uncommon that the failure reports include detailed narratives of the circumstances of a given event (e.g., plant status and plant response). Reporting of the specifics of a piping failure (e.g., exact description of fault location, mode of failure, type and diameter of the failed piping component, trends and failure patterns) is beyond the scope of most LER systems, however. Therefore, and accurate and consistent failure classification often requires an ‘interrogation’ of several, independent information sources.
3.3.1 Reporting Practices and the Quality & Completeness of Data
Typically, piping failures are reported as ‘cracks/crack indications’, ‘leaks’ or ‘ruptures’, corresponding to incipient, degraded and complete failure, respectively; c.f. Figure 3-2. In this project, a ‘rupture’ is interpreted as a catastrophic loss of mechanical integrity, which occurs without advance warning. Ruptures potentially result in large leak rates > 5 kg/s (80 gpm).
Complete Failure
Large leak / break resulting in leak rate >> TS limits.
Piping System Incident
Crack or series of cracks in one heat affected zone or in one location of the base-metal.
Complete Failure
Rupture, leak rate > 5 kg/s, no advance warning.
Degraded Failure
Detectable leak; within or in excess of Technical Specification
(TS) limitations.
Break-Before-Leak
Leak-Before-Break
Incipient Failure
Wall thinning or crack < through-wall (TW) or TW-crack resulting
in pinhole leak / seepage.
Note, the service experience shows that leaks due to through wall thermal fatigue and stress corrosion cracks have provided ample warning to enable mitigative action. Piping damaged by flow-assisted corrosion has on occasion lost its strength and failed catastrophically.
Figure 3-2: Pipe Failure Mode Definitions Used in Developing the SLAP Database.
The classification of events and the analysis of data builds on consistent application of clear definitions of failure. In the context of PSA, inadvertent or improper classification of a piping failure event as rupture could result in significant over-estimation of the true rupture frequency or probability. From the point of parameter estimation, there are several inherent limitations of LERs. By design, LERs document the effects of failure on system and safety functions. They do not go into the details about the specific degradation or failure mechanisms, contributing causes, and required repair actions, however. Therefore, events identified as candidates for inclusion in the SLAP database were processed according to the flowchart in Figure 3-3 and by augmenting the LER information with other relevant information sources.
Positive identification of leaking pipe through leak detection system and/or visual testing / walk-through?
No Positive identification of crack / wall-thinning through
NDE/ISI?
Yes Yes
Leak rate > 5 kg/s (80 gpm), and event narrative confirms 'break-before-leak' (BBL), and results from root cause analysis
confirms a 'major structural breakdown' of piping/fitting?
Record included in SLAP & classified as 'crack' or wall thinning if determined as a rejectable degradation. Positive identification of
size of crack/fracture and leak rate < 5 kg/s. Mitigation
through isolation and plant shutdown?
No
Yes
Event included in SLAP and classified as 'rupture' Event included in SLAP
and classified as 'pinhole (P/H) leak' or 'leak' depending on leak rate.
Yes
LER review 'filter' no. 1
LER review 'filter' no. 2
LER Selected for Review
Figure 3-3: Development of the SLAP Database - The Event Review Process.
Functional and structural interpretations of the potential or actual consequences of a given failure determine whether a formal, written report is prepared by a licensee for internal use or dispositioning with a regulatory agency. As an example, the probable consequences of small cracks due to stress corrosion cracking in piping within the Reactor Coolant Pressure Boundary (RCPB) are crack propagation in the through-wall direction and minor leakage of primary coolant. When small but detectable leaks occur, leak monitoring systems detect the change of leak rate, and a plant shutdown is required if allowable leak rate limits are exceeded. Such events are reportable according to technical specification reporting requirements. These reporting requirements do not cover degradations or failures in steam piping or feedwater piping that are not part of the RCPB, however. Furthermore, the reporting of piping failures is a function of the approach to replacement of degraded piping. The replacement of degraded piping prior to developing a gross leakage would normally not be a reportable event. With the exception for significant degradations and complete failures occurring within the RCPB, ad hoc reporting of piping failures is the norm rather than the exception.
These observations would not be of any concern to PSA practitioners, were it not for the fact that piping failures are rare events. The believable reliability estimation based on the operational data requires full consideration of the entire body of operating experience, and a consistent interpretation of the diverse failure information. There needs to be assurance about the completeness and relevance of the operational data to be considered in piping reliability analysis.
A range of different reporting criteria is in current use. These criteria mostly follow structural reliability considerations and RCPB leak rate criteria as defined by the technical specifications for plant operation, and applicable piping codes and standards.


![Table 3-3: Comparison of the Database Contents in SLAP & SKI Report 96:20 [3-2] .](https://thumb-eu.123doks.com/thumbv2/5dokorg/3343572.18720/31.892.107.739.120.345/table-comparison-database-contents-slap-amp-ski-report.webp)