Customer Satisfaction towards
Retailers
ICA, ICA NÄRA and COOP FORUM
Author: Phuc Hong Lu
Ian Grace.B. Lukoma Subject: Master Thesis in Business Administration 15 ECTS
Program: Master of International Management Gotland University Spring semester 2011
ii
ABSTRACT
In the midst of stiff and fierce competition and increased number of grocery retail outlets providing a variety of products, customers have become accustomed to patronizing multiple outlets. Retailers have recognized this trend and are of the view that customer satisfaction plays a role in the success of business strategies. Therefore it has become important for grocery retail stores to try and manage customer satisfaction.
This paper was thus developed to investigate the satisfaction levels of customers in supermarkets. Data was collected from three supermarkets in Visby, Gotland. The study examined the importance of overall dimensions and specific elements of customer satisfaction towards the measurement of satisfaction levels. In addition, comparative analysis was conducted between the three relative grocery stores. Customer satisfaction levels were measured. The highest percentage of customers of the whole sample belonged to medium level of satisfaction. The statistical result concluded that customers of ICA Nära and customers of ICA were higher satisfied than those of Coop Forum. The results showed that customers felt satisfied with Location, Staff courtesy and Reliability of supermarkets as the top aspects that drive satisfaction while additional services were ranked lowest. Due to these results, the impact of these attributes on Customer satisfaction must not be underestimated.
iii
Contents
ACKNOWLEDGEMENTS ... V ABBREVIATIONS LIST ... VI LIST OF FIGURES ... VII LIST OF TABLES ... IX
CHAPTER 1 ... 1
INTRODUCTION ... 1
1.1 BACKGROUND ... 1
1.2 PROBLEM FORMULATION ... 2
1.3 AIM AND OBJECTIVE ... 3
1.4 RESEARCH QUESTIONS ... 3
1.5 STRUCTURE OF THE THESIS ... 3
CHAPTER 2 ... 5
LITERATURE REVIEW ... 5
2.1 CUSTOMER SATISFACTION ... 6
2.2. DIMENSIONS OF CUSTOMER SATISFACTION. ... 8
2.2.1 LOCATION ... 8 2.2.2. ADDITIONAL SERVICES ... 8 2.2.3. PRODUCT QUALITY ... 8 2.2.4. FACILITIES ... 9 2.2.5 RELIABILITY ... 10 2.2.6. PROCESS ... 10
2.2.7. VALUE FOR MONEY ... 11
2.2.8. STAFF ... 11
2.2.9. PERSONNEL SERVICE... 12
CHAPTER 3 ... 13
METHODOLOGY ... 13
3.1 RESEARCH QUESTIONS ... 13
3.2 RESEARCH STRATEGY AND DATA COLLECTION METHOD ... 13
3.3 SAMPLE SELECTION ... 15
3.4 QUESTIONNAIRE DESIGN ... 16
3.5 DEVELOPMENT OF THEORETICAL FRAMEWORK FOR ANALYSIS ... 17
iv
DATA ANALYSIS OF CUSTOMER SATISFACTION SURVEY ... 19
4.1 DATA ANALYSIS ... 20
4.2 COMPARATIVE ANALYSIS OF ICA NÄRA, ICA AND COOP ... 26
4.3 CUSTOMER SATISFACTION LEVEL ... 33
4.3.1 Overall Customer Satisfaction... 33
4.3.2 Customer Satisfaction Levels of ICA, COOP and ICA Nära ... 34
4.3.3 Customer Satisfaction and Demographics (Gender and Age) ... 35
4.3.4 Customer Satisfaction and Frequency of visits ... 37
4.3.5 Customer Satisfaction and Image of supermarkets ... 38
CHAPTER 5 ... 39
DISCUSSIONS, CONCLUSION AND RECOMMENDATIONS ... 39
5.1 DISCUSSION/CONCLUSIONS OF CUSTOMER’S SATISFACTION SURVEY ... 39
5.2 LIMITATION AND FUTURE RESEARCH DIRECTIONS ... 41
REFERENCES ... 42
APPENDIX A- QUESTIONNAIRE FOR ICA ... 46
APPENDIX B- QUESTIONNAIRE FOR COOP ... 48
ANNEX C- INTERVIEW WITH ICA MANAGER ... 50
ANNEX D: INTERVIEW WITH ICA NÄRA MANAGER ... 51
v
Acknowledgements
This research would not be completed without great help and support from people who had contributed their time in different ways to our research.
We specially thank our supervisors, some of our friends and classmates who had helped and encouraged us less or more to conduct this academic research; especially Rashid Wazir who helped us for data analysis.
Furthermore, we are kindly grateful for respondents in Gotland, Sweden who spent their time to take part in our interviews during the survey. We also want to say thank to the managers of ICA Nära Torgkassen and ICA Atterdags for interviews as supplementary discussions to the research.
Last but not least, we highly appreciate our families for their warm and effortless support and encouragement to our study.
Visby May, 2011
vi
ABBREVIATIONS LIST
VS Versus
Q6LOC Location
Q6REL Reliability
Q6AS Additional Services
Q6PQ Product Quality
Q6FAC Facilities
Q6PRO Process
Q6VLF Value for Money
Q6STF Staff
Q6PS Personnel Services
SMEs Small and Medium Enterprises
vii
List of Figures
Page Number
Figure 1.1: Structure of Thesis 4
Figure 3.1: Theoretical Framework for customer satisfaction 17
Figure 4.1: Additional services 21
Figure 4.2: Product quality 22
Figure 4.3: Facilities 22
Figure 4.4: Reliability 23
Figure 4.5: Process 24
Figure 4.6: Value for money 24
Figure 4.7: Staff 25
Figure 4.8: Summary Dimensions 26
Figure4.9: Location of stores 27
Figure 4.10: Additional Services of stores 28
Figure 4.11 Product quality of stores 28
Figure 4.12: Facilities of the 3 stores 29
Figure 4.13: Reliability of stores 30
Figure 4.14: Process 31
Figure 4.15: Value for money of 3 stores 32
Figure 4.16: Staff of 3 stores 32
Figure 4.17: Personnel service of 3 stores 33
Figure 4.18:Customer Satisfaction levels of 3 stores 34 Figure 4.19: Satisfaction levels of 3 stores 35
Figure 4.22: Satisfaction level vs Gender 36
Figure 4.23: Satisfaction levels vs Age 36
viii Figure 4.25: Satisfaction levels vs Frequency(Percentage) 38
ix
LIST OF TABLES
Page Number
Table 4.1: Number of Questionnaires 19
Table 4.2: Elements of customer satisfaction 20
1
Chapter 1
Introduction
1.1 Background
Traditionally, companies have relied only on differentiation of products and services to retain their customers and also to satisfy the consumers. However, times have changed, due to fierce competition from new players entering the market, imitation of new features and increase in number of new offers, customers have acquired new choices and they have also become more price sensitive, which has forced marketers to adapt differentiated and customer oriented strategies in order to enable them to stand out in the competition and gain a competitive edge. According to Singh (2006), one of the fundamentally important drivers of organizational success is that enterprisers must take the needs and wants of their customers into account. That is the reason why the researcher such as Reicheld & Sasser (1990); Ciavolino & Dahlgaard (2007), Singh (2006); LaBabera & Mazursk (1983); Carpenter (2008); Bridson et al (2008) have paid attention to the importance of customer satisfaction, loyalty and retention have been continuously paid attention worldwide.
Yuen & Chan (2010) assert that in today‟s competitive grocery store sector, customer demands are bound to increase from time to time due to the improvement of service quality in parallel with product variety. Due to the tremendous growth of service industry in which retailing sector plays an important role, it is vital for retailers to understand the degree of importance of listening to the inner voice of customers´ needs to create, increase level of satisfaction. Ultimately, effective satisfaction leads to prospective long term relationship and loyalty through repeating purchase and recommendation, which helps retailers maintain their market share and position. Consumer´s needs have become sophisticated and it is imperative that grocery stores look for building long term and stable relationships with their customers as a way of driving satisfaction up since satisfaction does translate later into loyalty and retention. Chiara (2003) proposed that firms can obtain privileged information about customer needs by making use of the firms‟ customer relationship database such as loyalty card in order to help them to provide more satisfactory offering than their competitors. In addition, researchers claim that the cost of serving one loyal and satisfied customer is much lower than attracting a new customer (Zairi 2000; Reicheld & Sasser 1990, Heskett et al 1997
).
Sirohi et al (1998) and Yuen & Chan (2010) assert that once a firm concentrates on existing customers, it could lead to satisfaction and through this process the firm stands to gain positively in terms of creation of customer loyalty, increased customer patronage, positive word of mouth which generates publicity and making references and referrals.
2 1.2 Problem formulation
The service industry and in particular, the retail market has been vital to the world economy and undergone the ever intensified competition under recent crisis and economic turn-down period. The modern retail industry is booming across the world. Therefore, it is essential for retailers to
use strategies which focus on satisfying current customers.Supermarkets and Hypermarkets have
played an important role in food distribution since they appeared. For modern life, the existence of traditional markets has been gradually replaced by their descendent supermarkets and people depend on supermarkets for their basic grocery needs. Shopping at the grocery store has become a big deal and it is one of the most important food sources for many households. In addition, unlike previous studies that have focused more on service industry such as bank, healthcare, beauty etc, the researchers considered a supermarket setting which fully represents both product and service characteristics.
Additionally, this research sought to identify and analyze the elements of consumer satisfaction while focusing on their shopping experiences at 3different stores ICA, ICA Nära Torgkassen and Coop Forum. The research focused on these stores since they are typical samples of the most popular food distribution channels in Sweden. They are influential powerful retailers; one is positioned as largest supermarket and the other is hypermarket while ICA Nära is popular grocery store in Sweden in spite of its small size. The geographic area of research was limited to Gotland where most of the empirical investigation and data collection was conducted.
Customer satisfaction should be paramount for any firms marketing strategy. It is through satisfaction of customers that firms remain afloat and prosper. Customers have become an important part of any firm especially those in the grocery retail sector and many researchers have also placed emphasis on the importance of customers. Zairi (2000) cited in Singh (2006:1) said, “Customers are the purpose of what we do and rather than depending on us, we very much depend on them. The customer is not the source of a problem; we should not perhaps make that customer „should go away‟ because our future and our security will be put in jeopardy”. That is the main reason why organizations today are focusing on customer satisfaction and loyalty. According to Hansemark & Albinsson (2004) cited in Singh (2006:1), “satisfaction is an overall attitude towards a product provider or an emotional reaction to the difference between what customers expect and what they actually receive regarding the fulfillment of a need”. Kotler (2000) also define satisfaction as a person‟s feelings of pleasure, excitement, delight or disappointment which results from comparing a products perceived performance to his or her expectations.
Some researchers assert that satisfaction is most likely to influence repurchase intention through positive word of mouth whereas dissatisfaction encourages negative word of mouth and serves as reason for discontinuation of purchase and customer defection. Satisfied customers are likely to recommend to five or six people while dissatisfied ones have tendency to share their experiences to other ten people (Hoyer & MacInns 2001; La Barbera & Mazursky 1983). Similarly, Anton (1996) cited in Singh (2006) asserts that, satisfaction is positively associated with repurchase intentions which is linked to increasing ones likelihood of recommending a product or service,
3
loyalty and profitability”. Aaker (1995) suggests that one of the strategic aspects for organizational success is through customer satisfaction and loyalty.
Customer satisfaction once achieved leads to loyalty and retention of customers
.
Zairi (2000) cited in Singh (2006)suggests that “Customers are the purpose of what we do and rather than depending on us, we very much depend on them. The customer is not the source of a problem; we shouldn‟t perhaps make that customer „should go away‟ because our future and our security will be put in jeopardy”. That is the main reason why organizations today are focusing on customer satisfaction, loyalty and retention.1.3 Aim and Objective
- The aim of the paper was to identify and describe factors of customer satisfaction for supermarket and hypermarket. The research also measured level of satisfaction of the selected retailers ICA, ICA Nära Torgkassen and Coop Forum.
- Comparatively analyze customer satisfaction for those retailers.
Besides, the research helped the authors to enhance better understand of the constructs of customer satisfaction in retail industry. The outcome of the research provided useful insights for marketers particularly in retail sector to study and understand clearly customers´ needs so as to create and maintain higher satisfaction level for their purposes of strategic formulation of loyalty building and sales increase.
1.4 Research Questions
In accordance with those objectives, two main questions were raised as directive guidelines for the whole research:
What is the satisfaction level of customers at supermarkets?
What is the satisfaction level of customers at respective supermarkets (ICA Atterdags, ICA Nära Torgkassen and Coop Forum)?
1.5 Structure of the thesis
This research consisted of 5 chapters, such as introduction, literature review, methodology, data analysis, discussion and conclusion. The first chapter introduced the problem, purpose of this research. The second chapter Literature review provided concepts that facilitate to define research problems and question. The methodology mentioned about approach, method of data collection, questionnaire design, theoretical framework for analysis and sampling method. Chapter four was
4
analysis of collected data for customer satisfaction. The final section of the thesis concluded the findings of chapter four and answered the research questions; limitations of the research and recommendations for future research were presented.
The structure of the thesis is illustrated in figure 1.1
Figure 1.1 structure of thesis
Section 1
Introduction(Chapter 1) ↓
Section 2
Literature Review (Chapter 2) ↓
Section 3
Methodology(Chapter 3) ↓
Section 4
Data Analysis (Chapter 4) ↓
Section 5
Discussion and conclusions (Chapter 5) ↓
5 CHAPTER 2
LITERATURE REVIEW
In this chapter of the research, the authors gave a theoretical background of customer satisfaction and also explained all the factors which influence customer satisfaction in Supermarkets. This section described what a supermarket and hypermarket are. Section 2.1 described customer satisfaction using the available literature from other researchers; 2.2 described the different dimensions of customer satisfaction
Definitions Supermarket
According to the Webster International dictionary (1993), a Supermarket is a self-service store or independent retail market offering a wide variety of food and household merchandise, organized into departments. It is larger in size and has a wider selection than a traditional grocery store and it is smaller than a hypermarket or superstore.
Hypermarket
According to the Webster dictionary (1993) a hyper market is a superstore which combines a supermarket and a department store (where usually are sold products like apparel, furniture, appliances, electronics, and additionally select other lines of products such as paint, hardware, toiletries, cosmetics, photographic equipment, jewellery, toys, and sporting goods), being the result a very large retail facility which carries an enormous range of products under one roof, including full lines of groceries and general merchandise.
ICA
In Sweden, ICA is managed through independent retailers working in co-operation. Each of these retailers own and manage their stores but have agreements with ICA Sweden(www.ICA.se), which makes coordinated purchases, supports the retailers on issues concerning sales and efficiency improvements, and is responsible for logistics and joint marketing communications.
ICA is both large and small in size which allows the company to combine an entrepreneurial spirit with economies of scale. ICA‟s main business is retailing which is the main source of
6
its earnings. It consists of business models where the value chain begins and ends with the customer. Their goal is to create value everyday and consistently in every link of the chain. Like other organizations, ICA uses various tactics to attract and satisfy their customers. According to their website (www.ICA.se), ICA particularly pays attention to their Customers by listening to them, offering good prices, offering wide assortments and also tries to create personal offerings. The company also pays attention to the stores by trying to have the most inspiring stores, by creating common formats that can be adopted locally.
Our thesis focuses on ICA supermarket Atterdags whose format consists of a wide assortment for every day meals, prides in personal service of high quality and whose stores carry a wide range of fresh foods.
ICA Nära Torgkassen on the other hand is a small convenient store with a narrow product range, quality fresh foods and good service.
COOP
On their website, (www.coop.se) Coop is the name of the KF grocery retail group. Coop, together with the retail consumer societies accounts for 21.5% of the grocery retail market in Sweden with SEK32billion in sales and 7300 employees.
Coop Forum is a hypermarket that offers a broad range of goods with emphasis on foods. It is driven by a philosophy that customers should be able to find everything under one roof.
2.1 Customer Satisfaction
According to Hasemark and Albinsson (2004) cited in Singh (2006:1) “satisfaction is an overall attitude towards a product provider or an emotional reaction to the difference between what customers expect and what they actually receive regarding the fulfillment of a need”. Kotler (2000); Hoyer & MacInnis (2001) also define satisfaction as a person‟s feelings of pleasure, excitement, delight or disappointment which results from comparing a products perceived performance to his or her expectations.
Satisfaction means the contentment one feels when one has fulfilled a desire, need or expectation. Furthermore, Customer satisfaction can be a measure of how happy customers are with the services and products of a supermarket. Keeping customers happy is of tremendous benefit to companies. Satisfied customers are more likely to stay loyal, consume more and are more likely to recommend their friends to the business.
7
Ciavolino & Dahlgaard (2007) suggest that “customer satisfaction can be defined as the overall evaluation of the service performances or utilization.”
Customer satisfaction can also be measured using some questions like, considering all your experience of company X, how satisfied are you in general on a scale from completely satisfied to dissatisfied? Another question could be to what degree did company X fulfill your expectations? On a scale of much less than expected to much more than expected? ( Ryan et al 1995). According to Hoyer & MacInnis (2001) satisfaction can be associated with feelings of acceptance, relief, excitement and delight.
Furthermore, Zairi (2000) says that many studies have viewed the impact of customer satisfaction on repeat purchase, loyalty and retention and they have all echoed concern that customers who are satisfied are most likely to share their experiences with other people with regards to about five to six people.
Additionally, this research is supported by La Barbera & Mazarsky (1983) who also imply that satisfaction influences repurchase intentions whereas dissatisfaction is seen as a primary reason for customer defection or discontinuation of purchase. Hoyer & MacInnis (2001) also say that dissatisfied customers can choose to discontinue purchasing the goods or services and engage in negative word of mouth.
Since a lot of research has been performed in the field of customer satisfaction, many definitions have been formulated as to what Customer satisfaction entails. However, for the purpose of this paper while defining satisfaction, we refer to the customer‟s satisfaction with the stores which they visit often, with respect to ICA Supermarket Atterdags, ICA Nära and Coop Forum supermarkets/ hypermarket. According to MCGoldrick & Ho (1992); Walters & Knee (1989), store offer comprises of four dimension which are store merchandise, trading format, customer service and customer communication each of which is evaluated differently by consumers. They further state that merchandise refers to quality and price of the products carried by the store. Similarly, the trading format consists of elements like location, layout and atmosphere. Lastly, customer service includes the level of assistance provided by the retailer, the speed of service and friendliness of staff.
Customer satisfaction can be achieved by improving service quality. Ciavolino & Dahlgaard (2007) contend that service quality is the measure of service levels based o the attributes of the core product. Such attributes include; Facility layout- display of products, clean environment, clear labeling. Other attributes can be Location, Process - queue management, waiting time, express checkouts, supermarket operation hours, delivery time, additional services like parking, parent & baby facilities, and loyalty/membership cards, Product-
8 2.2. Dimensions of customer Satisfaction.
Satisfaction according to Hokanson (1995) is affected by many factors which include friendly employees, courteous employees, knowledgeable employees, and helpful employees, accuracy of billing, competitive pricing, service quality, good value and quick service.
For purposes of this study, we concentrate on nine dimensions of customer satisfaction which are Location, Additional Services, product quality, Service Quality, Facilities, Reliability, process, Value for money, Staff and Personnel service. Furthermore, the nine dimensions also consist of 21 elements which are used in the collection of data and analysis of results.
2.2.1 Location
The location of any store is always very important. Location can mean convenience and accessibility. Location can also refer to the number of stores in a particular geographical setting. According to Martinéz-Ruiz et al (2010:280), suggest that once a location is near to the home then transaction costs associated with purchase such as transport costs and time spent are likely to be reduced.
According to Reilly (1931) who developed Reilly law of retail gravitation which proposes that people are drawn to larger shopping thus larger cities tend to attract more customers to shop their than smaller ones therefore the need for supermarkets to consider location when putting up facilities. This is further supported by Craig et al (1984) who use the central place theory to explain how people living far away are attracted to larger stores which are centrally located in larger shopping malls offering more collection of goods and services than those stores within their own vicinity offering less goods and services.
2.2.2. Additional services
This dimension will consist of four elements membership card, parking lot, baby areas and delivery of goods. Martinéz-Ruiz et al (2010) assert that customers always look for convenience benefit in the modern environment. Additional services are essentially important in the retail business and play a role in determining customer satisfaction through creation of convenience. For example, Grewal et al (2002) concur that additional services like the availability of parking can create convenience for customers with vehicles thus leading to a positive effect on customer satisfaction. Other additional services like the membership card/loyalty card also provide access to discounts and promotional goods.
2.2.3. Product quality
Product quality according to Garvin (1987) is described using eight attributes which are: Performance which is refers to a products primary operating characteristics.
9
Features: These are additional features which are also known as the bells and whistles of the product.
Conformance which is described as the extent to which a product will operate properly over a specified period of time under stated conditions of use
Reliability: the probability that will operate properly over a specified period of time under stated conditions of use.
Durability: It is the amount of use a customer gets out of use of a product before it physically deteriorates or until replacement is preferable.
Serviceability: the speed competency and courtesy of repair.
Aesthetics: How a product appeals to all the five senses of a human.
Customer perceived quality: Customers perception of a products quality based on reputation of the firm.
For purposes of this study, we have used 3 elements to measure the dimension of product quality namely; product variety, freshness of products and durability. We follow this line because according to Yuen & Chan (2010) not all elements/ attributes used suggested by Garvin (1987) are relevant, while some are found to be less measureable. For example the elements of performance and features cannot be used in this study because of the difficulty in separating primary product characteristics secondary characteristics.
Variety, according to Dhar et al (2001) helps retailers to serve different tastes and preferences of its clients. Dellaert et al (1998) concedes that variety does not only help retailers attract more consumers but it can also motivate them to purchase more while at the store. If a retailer gives greater variety in product categories, it can improve the convenience of purchase in this way increasing customer satisfaction. Variety product selection can also help reduce the perceived costs like effort and travel time.
2.2.4. Facilities
Under this dimension we use three elements like display, music and clean and spacious atmosphere to measure the effect of supermarket facilities on customer satisfaction.
According to Inman et al (2009) a grocery store is described as a place of sensory stimuli where consumers find colorful product displays coupled with fruits and flowers with perfectly displayed packages of snacks and advertisements covering the floor. They further argue that some customers then use the in store stimuli as cues to remind them of what groceries they need and also assert that certain consumers enter shops without the intention of buying certain goods but
10
end up buying a particular set of goods because the in store stimuli has triggered unrecognized needs and desires leading to in store decision making.
This is supported by Dioiri (2007) who asserts that the sales outlets/supermarkets facilities are very important since they have the ability to influence or change the purchasing behavior of consumers; therefore extreme care has to be observed when making a decision on merchandising because 70 percent of purchase decisions are made during shopping.
Terblanche & Boshoff (2004) describe supermarket facilities as the sum of elements that contribute to a pleasant shopping atmosphere such as shop layout/ aisles that make it easy to move around, store cleanliness and well shaped product displays.
Because of increased competition in the market, retailers are being driven to improve their aisle and display management strategies. This is being done to improve company share of consumer purchases and wallet. Burke (2005) asserts that aisle management involves the effective placement of categories in the store aisles to improve customers´ shopping experience.
Sirohi et al (1998:237) found that good store facility design (overall appearance of the shop, cleanliness, departments in the right places and wide and well marked aisle directions) leads to enhanced perceptions of overall merchandise quality.
Furthermore, Yuen & Chan (2010) say that physical aspects such as a good store layout and attractive service materials give customers a good impression and attitude towards the store.
2.2.5 Reliability
Reliability refers to how much trust can be afforded the supermarket staff and organization for example through parameters like accurate billing.
“Reliability refers to the promises given by the store. If the store cannot keep or breaks the promises, it dissatisfies customers and results in negative word-of-mouth. In contrast, when the company is able to keep its promises, it increases customer confidence in the store and creates customer satisfaction and lead to loyalty”, (Yuen & Chan 2010:236).
2.2.6. Process
Process will be measured using three elements such as number of checkout counters/ express checkout counters, opening hours and queue waiting time at counters. It is important to manage these elements of process in service delivery as they can make or break Customer satisfaction. According to Katz et al (1991), waiting time in a retail store is an experience that can lead to consumer dissatisfaction. Consequently, Hui et al (1997) also assert that the former can negatively affect the store patronage behavior of a customer. Previous research by Kumar et al
11
(1997) finds that wait length expectations influence satisfaction with the waiting experience thus the need to find out how customers expectations of a wait influence their patronage decision. In their support, Taylor (1994) also finds that greater consumer satisfaction is obtained with shorter waiting periods. Thus there is need for supermarkets in particular to manage long queues especially during peak hours when the traffic in the stores is heavy.
2.2.7. Value for money
According to Ciavolino & Dahlgaard (2007), Value for money is the perceived level of quality relative to the price paid for a product or service. Value of money is based on competitive pricing of products, discounts awarded to customers, and promotions. Cronin & Taylor (1992) claimed that customer satisfaction is not only affected by customer services but also by price and convenience.
Additionally, several researches have been done the value for money and the value attached to it by customers. These studies also point out the difference between price and quality and how they influence perceived value, customer satisfaction and customer behavior.
Furthermore, Zeithaml (1988b) says that, “customer value for money is the overall assessment of the utility of a product based on perceptions based on what is received and what is given”.
Quantitative studies by Keaveny (1995) into switching behavior in services revealed results that more than half of customers defected because of poor price perception. While Varki & Colgate (2001) study of the banking industry also reached the same conclusion that price perception can directly influence customer satisfaction.
On the other hand, Sirohi et al (1998) define value as “what you get for what you pay for”. They also argue that value in supermarket shopping is attributed to various components such as quality, service, variety, nutrition, convenience, freshness and facilities. They liken their definition to that of earlier studies of Hauser & Urban (1986) on the utility per dollar measure of value.
Therefore, Woodruff (1997) & Slater (1997) suggest that there is need for companies to adjust their strategies towards delivering superior customer value as it is a strong driver of customer satisfaction, retention and profitability.
2.2.8. Staff
Employees are important for a company‟s marketing strategy. In this paper, the authors make use of two elements namely friendly helpful staff and knowledgeable& quick performance to explain the staff dimension. According to Gwinner et al (2005); Liao & Chuang (2004) say that the successful implementation of a company‟s marketing concept is to an essential degree dependent on the frontline employees because of their direct customer interaction.
12
While dealing with customers, employees are meant to be at their best behavior. They are meant to act in a particular way and some acts are either positive or negative. Employee behavior is vital in a service company since employees act as a link for the organization with its customers. Furthermore, Gwinner et al (1998) employees represent a critical factor in developing effective working relationships with customers. In their study, Lemmink & Mattson (1998) showed that the degree of personal warmth displayed by service employees towards customers was related significantly and positively to service quality perceptions and customer satisfaction.
2.2.9. Personnel service
Some researchers suggest that people like to socialize outside their homes for example Tauber (1972) asserts that certain groups of people like o shop at particular stores because the stores offer them opportunities to socialize with fellow shoppers and he also claims that shoppers prefer to shop at stores where they find friendly and courteous personnel.
Refers to the quality of service related to the core products. Quality will be measured using variables like personnel service, friendly staff, courteous and knowledgeable staff. The speed of solving problems is also an important variable. We also keep in mind the ability of staff to offer personalize service such as being able to recognize frequent customers and even greet them by name.
Clemmer (1990) describes service quality as a third ring of perceived value after the basic product or service and extended support services. Service can reduce the non monetary sacrifices made by shoppers such as time and convenience and also increase the benefits of shopping at a store in this case ICA and Coop Forum. Furthermore, perceived service quality has been found to have positive impact on perceived service value, (Bolton & Drew 1991).
13
CHAPTER 3
METHODOLOGY
In this chapter, methodology was explained in order to relate literature review (chapter 2) and the analysis of the data to be done for this research (chapter 4 and 5). In section 3.1 research question was defined. Section 3.2 explained approach, strategy and data collection methods. Section 3.3 was about research related questionnaire design. Theoretical framework for analysis was given in section 3.4. Sampling procedure for service quality related questionnaire was given in section 3.5.
3.1 Research questions
In the research, authors sought to analyze and identify the elements of consumer satisfaction regarding their shopping experiences at ICA Atterdags, ICA Nära Torgkassen and Coop Forum supermarkets through the eyes of the customer and to measure satisfaction levels for the respective supermarkets.
What is the satisfaction level of customers at supermarkets?
What is the satisfaction level of customers at respective supermarkets ( ICA Atterdags, ICA Nära Torgkassen and Coop Forum)?
3.2 Research Strategy and Data collection Method Research Type
This research was descriptive, which drew a picture of the topic and describes characteristics of a phenomenon or situation in its current state, namely customer satisfaction. Besides, the research sought to indentify relevant attributes of this phenomenon to answer the question what and how. In descriptive research, correlation, developmental design, observational studies, and survey research are used. For the research, survey plus observation were the suitable ways to capture the phenomenon at the moment. The selected approach was based on personal observation and shopping experiences from perspectives of customers when they do their grocery.
Time dimension
The research was a cross-sectional base due to time limitations which allowed researchers take a snapshot of aspects at a single point of time. This is considered as most consistent with a descriptive approach. Cross-sectional is simpler and less costly than longitudinal research which examines features over a long time framework (Saunders et al 2000). However, the disadvantage is cross-sectional cannot reflect the change process. Thus, the research was conducted upon
14
cumulative experiences and inner needs of customers at the two grocery stores. Customers had chance to express these needs and comments when they were asked to evaluate satisfaction attributes for ICA, ICA Nära and Coop Forum. Researchers did not place importance on how customer satisfaction would change in future as their objective of this research.
Method
Leedy & Ormrod (2001:14) defined research methodology as “the general approach the researcher takes in carrying out the research project”. The popular methods used in business researches were quantitative and qualitative methods.
Quantitative method is used to explain, predict phenomenon with measurable variables (Leedy & Ormrod 2001:101). Quantitative research also involves data collection that is typically numeric and the researcher tends to use mathematical models to analyze data. Creswell (2003:18) states, quantitative research “employ strategies of inquiry such as experimental and surveys, and collect data on predetermined instruments that yield statistical data”.
According to Bryman & Bell (2007) qualitative research emphasizes on words instead of large quantification and focuses on the individuals‟ interpretations of their social world. This approach also requires high involvement of participants´ observations from actual experiences (Creswell 1994).
This research adopted quantitative research since the authors aimed to identify various elements and measure level of customer satisfaction. It also focused on known variables and they described predictable features of the subject such as quality elements, store facilities, personnel service, price etc. In other words, quantitative is deductive approach, which prefers to analyze and test relationship between theory or researcher´s assumptions and the empirical research (Bryman & Bell 2007). Researchers aimed to analyze empirical result from the survey for reliable conclusion of satisfaction level measured at the three respective supermarkets. Measurement based on statistical evaluation on rate of importance of related dimensions which the researchers developed in the model before survey was conducted. The result was calculated with nature of mathematical application of quantitative research, namely with the help of Microsoft Excel tool.
According to Saunders et al (2000), quantitative takes less time to complete and it is normally possible to predict accurately the time schedules whereas qualitative research can be much more prolonged. Most of thesis studies were time constrained. Hence, quantitative approach was the preferred approach. In quantitative research, survey is a frequently used and universal approach because it covers a larger respondent population to collect data in highly economical way in comparison with qualitative. In addition, the authors also conducted interviews with managers of the two supermarkets ICA and ICA Nära to obtain better additional insights of the subject. However, the research was in favor of quantitative approach.
15
According to Ghauri et al (1995) qualitative methods are not just differentiated from quantitative in terms of “quantification”, but in reflecting on different perspectives, such as behavior, events, interactions, relationships among others. While quantitative provides measurement of reality, qualitative allows researchers explore the complexity of the research objects to get better understand. Besides, qualitative stresses in words, inductive approach and generalization (Bryman & Bell 2007).
Data collection
There are two sources of data for research, namely primary and secondary data. The primary data is relevant to the present study and usually collected by the researcher through communication methods or interaction with respondents and observation methods. For this kind of data, survey techniques were used to answer the research questions, which were based on a structured questionnaire.
Secondary data is gathered from previous studies through various sources such as articles, internet, organization‟s database, government surveys and enterprises etc. The advantage of secondary data is time saving and inexpensive in comparison with primary data.
However, secondary data may not suitable to a specific research since they are conducted for another study with different objectives (Ghauri & Gronhaug, 2007); in other words, they are universal for mass audiences. Therefore, researchers should use secondary data as reference tool for the first step before proceeding with their own research.
For this research, primary data was collected in accordance with research phenomenon and design of the authors. Since researchers investigated the constructs of customer satisfaction for Ica, ICA Nära and Coop in Visby- a limited geographic dimension, primary data was consistent with the research purpose. The approach was from the customers‟ perceptions; thus, it required interaction with customers. The use of primary data from the researchers‟ own surveys was logical access to interviews and get information from targeted respondents. The use of questionnaire was suitable in order to interact with respondents to get structured information and find out consumer satisfaction level from their perspectives. Data collection was conducted through interactive interviews with customers of the relative grocery stores.
3.3 Sample selection
Process of sampling was the next issue. As this is a cross-sectional study, most of the academic studies are cross sectional. This is also an academic research. Cross-sectional studies need less time to be completed. The researchers also have limited time to complete their research work and financial resources. As convenience samples are generally the cheapest and easiest to conduct. Convenience sampling is most often used during the exploratory phase of a research project and
16
is perhaps the best way of getting some basic information quickly and efficiently. So, convenience sampling was used to collect data.
Firstly empirical cases of the research were ICA, ICA Nära and COOP Forum respectively. In other words, sampling frame consisted of 3 grocery stores. Population was customers of those 3 retailers in Gotland. For the next step, the researchers decided a total sample size of 125 interviewees ( particularly 50 respondents for each of the 2 big-size retailers ICA and COOP and 25 for the small-size store ICA Nära) who were the consumers shopping at selected grocery stores. Sampling method was used to conduct survey was non probability. Most of the local residents in Gotland were shoppers of these three groceries stores; hence, it was only necessary to take frequency of doing shopping into account. The respondents were randomly selected as long as they were qualified for being customers of those relative supermarkets.
The researchers used questionnaire as a tool for data collection because this method assists to increase response rate (Saunders et al 2000). The respondents were asked “on site” at ICA, ICA Nära, COOP and randomly selected in the neighborhood of those stores.
3.4 Questionnaire Design
Appropriate data collection technique was the further issue. According to Kumar (1996), three resources for primary data collection are questionnaire, observation and interview. In this research, researchers combined these three techniques under a form of survey through questionnaires. Since potential respondents were scattered over a geographic area, the use of questionnaire was likely become most suitable and economical choice of collecting data. The research only served for purpose of an academic, popular business phenomenon without any financial fund resources. Thus, questionnaire was considered as the best way for both academic and financial reasons.
Saunders et al (2000) classify questionnaire as self-administered interview. Interviewer administered questionnaire consists of telephone questionnaire or structured interview. Self administered questionnaire may be online questionnaire, postal questionnaire or delivery and collection questionnaire. The authors decided to adopt delivery and collection questionnaire. Even though telephone or online surveys are time-saving, quicker collection and fewer efforts, respondents may not be as correctly targeted as and information is likely less reliable and administered than traditionally manual questionnaire.
Questionnaires had 2 versions both in English and in Swedish. Questionnaire consisted of structured questions (close ended). The apparent advantage of closed ended questions is that response rate is increased, time-saving for respondents and decreasing waiting cost for the surveyor. Obviously, respondents usually feel reluctant to take part in the interview if they are required to answer many open questions due to time limitation and inconvenience. Furthermore, as quantitative research is deductive for which researchers were able to predict and develop
17
model of attributive dimensions relating to research subject before handing out questionnaires to interviewees, the use of more closed ended questions are reasonable. For the sake of confidentiality, respondents were not asked to reveal their personal information except for age and gender under personal information heading. Questions used were brief, comprehensive and the use of jargon was avoided to increase understanding and interest of the respondents.
The core question emphasized 9 determinant dimensions which constitute satisfaction of customers under supermarket context. Those core valued dimensions included product quality, additional services, location, store facilities, value for money, process, reliability, staff and personnel service. Each dimension composed of few elements which described attributes of customer satisfaction in more details. There were total 21 elements categorized into relevant 9 dimensions. For this main question, respondents were asked to rate the importance of these elements in accordance with their satisfaction level by application of Linkert scale. The scale is from 1 to 5 (5 = extremely satisfied, 1= dissatisfied at all). In addition, interviewees were also asked about importance of store name for their choice of supermarket in accordance to the “image” component of the model.
3.5 Development of Theoretical Framework for Analysis
The theoretical framework theorizes the relationship among several factors relevant to the study. It is also known as the conceptual model. A researcher may use the theoretical framework to elaborate the relationships among variables, explain the logic underlying these relationships and describe the nature of the relationships.
Theoretical framework for development of customer satisfaction of relative retailers is given in Figure 3.1
Nine dimensions along with 21 relevant elements were developed to indentify attributes to customer satisfaction. Additional services include membership card, parking lot, baby areas and delivery of goods. Product quality consists of 3 elements regarding freshness of products (meat, vegetables and fruits), durability and product variety. The Facilities dimension contains 3 elements which are clean and spacious atmosphere, display and decoration, interior and music. Reliability consists of 2 elements such as accuracy of receipt, correct information of price signs and discount. Process includes 3 elements regarding number of check-out counters, express check-out.
18 Elements Location Membership card Parking lot Baby areas Delivery of goods Freshness of products Durability Product variety
Clean & spacious atmosphere
Display/decoration
Music/interior
Accuracy of receipt
Correct prices
No. checkout counters
Operation hour Queues-waiting at counters Competitive price Frequency of promotions/Discounts Friendliness Knowledgeable, quick performance Availability of staffs to offer help/ Recognizing loyal customers Dimensions Location Additional Services Product quality Facilities Reliability Process Value for money Staff Personnel Service
Customer
Satisfaction
19 CHAPTER 4
DATA ANALYSIS OF CUSTOMER SATISFACTION SURVEY
In this chapter, results from the analysis conducted on the data collected from three stores (ICA NÄRA, COOP, ICA) are presented. The survey questionnaires were delivered to the customers of the above said stores. Number of questionnaires delivered to customers of these stores is as follows,
Store Questionnaires
ICA NÄRA 25
COOP 50
ICA 50
Table 4.1: Number of Questionnaires 1
Each questionnaire consists of 21 elements relate to customer satisfaction for a grocery store. Respondents were asked to rate 5 point Likert scale for each element. Customer satisfaction was the only variable to measure. To measure customer satisfaction effectively, core question was developed base on 9 dimensions which are location (Q6LOC), additional services (Q6AS), product quality (Q6PQ), facilities (Q6FAC), reliability (Q6REL), process (Q6PRO), value for money (Q6VLF), staff (Q6STF), and personnel service (Q6PS). Each dimension has different number of elements. Location and personnel service are single dimensions which have 1 element for each. Additional services include 4 elements. Product quality has 3 elements. Facilities have 3 elements. Reliability consists of 2 elements. Process includes 3 elements. Value for money contains 2 elements. Staff has 2 elements.
Label Name
Q6LOC Location
Q6AS1 First element of Additional services: membership card Q6AS2 Second element of Additional services: parking lot Q6AS3 Third element of Additional services: baby areas
Q6AS4 Fourth element of Additional services: delivery of goods Q6PQ1 First element of Product quality: freshness of products
20 Q6PQ2 Second element of Product quality: durability
Q6PQ3 Third element of Product quality: product variety
Q6FAC1 First element of Facilities: clean& spacious atmosphere
Q6FAC2 Second element of Facilities: Display, decoration
Q6FAC3 Third element of Facilities: Music, interior
Q6REL1 First element of Reliability: Accuracy of receipt/ Receipt clarity
Q6REL2 Second element of facilities: correct information of price signs & discount
Q6PQ1 First element of Process: Number of check-out counters/ express check-outs Q6PQ2 Second element of Process: Operation hour
Q6PQ3 Third element of Process: Queues -waiting time at counters
Q6VLF1 First element of Value for money: Competitive price
Q6VLF2 Second element of Value for money: Frequency of promotions/ discounts
Q6STF1 First element of Staff: Friendliness, helpfulness
Q6STF2 Second element of Staff: Knowledgeable staff with quick performance
Q6PS Personnel service
Table 4.2: Elements of customer satisfaction
Score criteria: each element has 1 to 5 score (1= not satisfied at all; 5= extremely satisfied). Maximum score for each questionnaire of 21 elements is 105. Maximum score for each element assigned by the whole sample of 125 respondents is 625.
Summative Score = (Score obtained from Coop‟s Customers + Score obtained from ICA‟s customers + Score Obtained from ICA Nära‟s customers)
= (50*105 +50*105 + 25*105) = (13,125)
4.1 Data Analysis 4.1.1 Location
21
The first dimension was location. The summary score was 546, accounting for 87% while maximum score for this dimension is 625. This result shows that people were relatively high satisfied with location of supermarkets. In other words, they prefer to shop at the convenient supermarket.
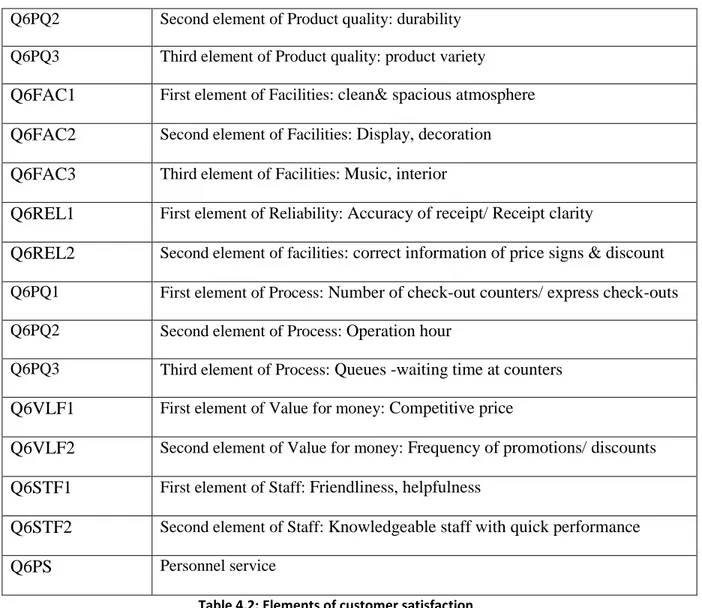
4.1.2 Additional services
The second dimension was additional services. Overall score assigned by respondents for this dimension was 1344 out of 2500 maximum score. Out of this assigned score, element Q6AS1, Q6AS2, Q6AS3 and Q6AS4 were assigned 404, 396, 246 and 298 score respectively. Element Q6AS1 has maximum score 404 which holds 30%, while Q6AS3 got lowest score 246 which is 18% of the score assigned by respondents across this dimension. This illustrated that customers like to have membership card to benefit from discounts or special offers. Whereas customers are dissatisfied with baby areas; thus retailers should provide more this service.
Figure 4.1: Additional services
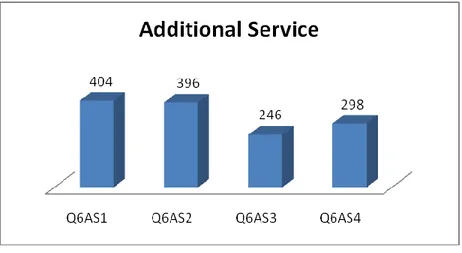
4.1.3 Product quality
The third dimension was product quality. Overall score assigned by respondents for this dimension was 1526. Out of this assigned score, element Q6PQ1, Q6PQ2 and Q6PQ3 were assigned 548, 482 and 496 score respectively. Element Q6PQ1 has maximum score 548 which accounts for 36%, while Q6PQ2 and Q6PQ3 got nearly equal scores which are 32% and 36 % of the score assigned by respondents across this dimension. Customers felt more
22
satisfied with freshness of products than durability and product variety. They paid more attention to freshness and category.
Figure 4.2: Product quality 4.1.4 Facilities
The fourth dimension was facilities. Overall obtained score assigned by respondents for this dimension was 1263. Out of this assigned score, element Q6FAC1, Q6FAC2 and Q6FAC3 got 496, 441and 326 score respectively. Element Q6FAC1 has maximum score 496 which holds 39%, while Q6FAC3 got lowest score 326 which equals to 26% of the score assigned by respondents across this dimension. This figure demonstrated that customers are most pleased with clean and spacious atmosphere of the supermarkets in general while music and interior is least satisfied.
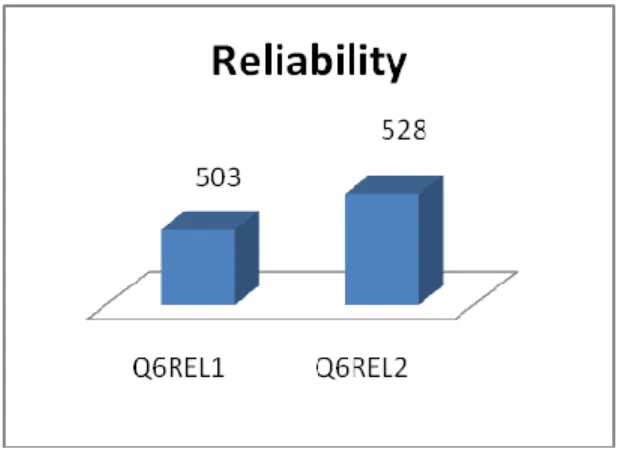
23 4.1.5 Reliability
The fifth dimension was reliability. Overall score obtained by respondents for this dimension was 1031. Out of this obtained score, element Q6REL1 and Q6REL2 were assigned 503 and 528 score for each. These 2 elements got nearly equal scores which accounted for 51% and 49 % of the score assigned by respondents across this dimension. Customer satisfaction was almost at same level for both accuracy of receipts and correct information of price signs and discounts.
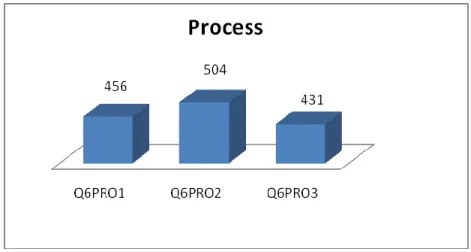
Figure 4.4: Reliability 4.1.6 Process
The sixth dimension was process. Overall score assigned by respondents for this dimension was 1391. Out of this assigned score, element Q6PRO1, Q6PRO2 and Q6PRO3 were assigned 456, 504 and 431 score respectively. Element Q6PRO2 had highest score 504 which accounts for 36%, while Q6PRO1 and Q6PRO3 got slightly lower scores 456 and 431, accounting for nearly equal percentages of 33% and 31 % across this dimension. This result showed that customer were most satisfied with operation hour of the stores and less content with number of check-out counters and queue or waiting time. The later factors were almost equal which shows that they were not as important as long as the opening hours were favorable. There was correlation in term of satisfaction levels between number of counters, express counters and waiting time at queues.
24 Figure 4.5: Process
4.1.7 Value for Money
The seventh dimension was value for money. Overall score obtained by respondents for this dimension was 904. Out of this obtained score, element Q6VFM1 and Q6VFM2 were assigned 458 and 446 score for each. These 2 elements got nearly equal scores which accounts for 51% and 49 % of the score assigned by respondents across this dimension. Respondents felt equivalently satisfied with competitive price and frequency of promotions or discounts.
Figure 4.6: Value for Money 4.1.8 Staff
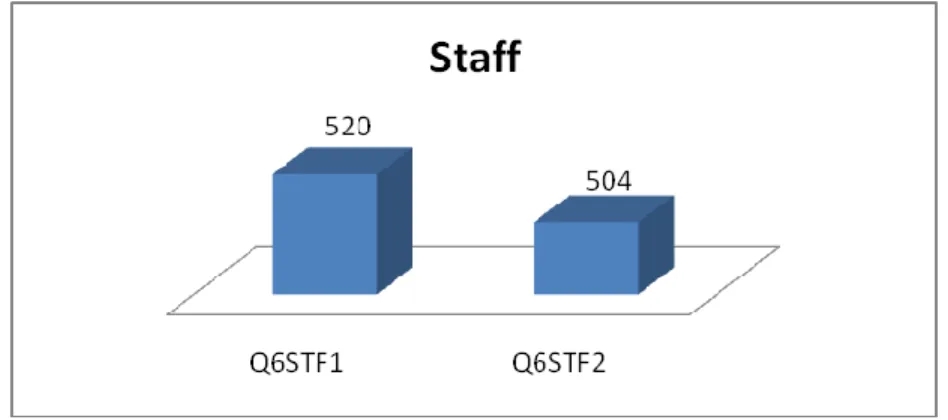
The eighth dimension was staff. The score obtained across this dimension was 1024. Out of 1024 score, element Q6STF1 and Q6STF2 got 520 and 504 score for each. These 2 elements accounted for nearly equivalent percentages of 51% and 49 % of the score assigned by respondents across
25
this dimension. Customer satisfaction was almost at same level for these 2 attributes, namely friendly, helpful staff and knowledgeable, quick performance.
Figure 4.7: Staff 4.1.9 Personnel Service
The last dimension was personnel service. The obtained score was 458, accounting for 73% while maximum score for this dimension is 625. This result showed that customers were fairly satisfied with personnel service provided by the retailers, such as availability of staffs to offer help and individual attention to frequent customers.
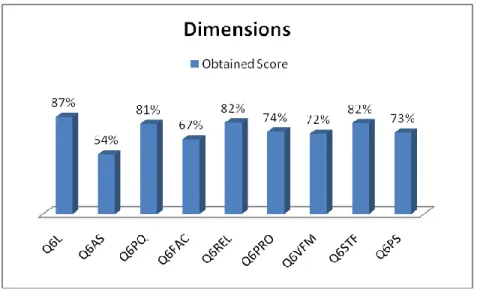
4.1.10 Summary
The score mentioned across each dimension is percentage of the maximum score of that dimension. As for example, the score obtained across dimension location is 546 and the maximum score across this dimension is 625, for additional services obtained score is 1344 and maximum score across this dimension is 2500,
Score across location = (546/625)*100 = 87%
Score across additional services= (1344/2500)*100= 54%
The score across each dimension was calculated through above mentioned method. After calculations, dimension location had obtained 87% score, additional services had score 54%, product quality had 81%, facilities had score 67%, reliability had 82% score , process had 74% score, value for money had 72% score, staff had 82% score and personnel service had 73% score. The dimension location had the highest score 87%, while additional services had lowest score 54%. This showed general trend that people were most satisfied with location and they like to buy from the most convenient supermarket; location is the most important factor for retailers business. According to law of retail gravitation proposed by Reilly, people usually like to shop at city center but for daily shopping, customers prefer to choose a local grocery store. In contrast, customers felt least satisfied with addition services. In other words, the retailers should focus on
26
both high score and low score dimensions. Thus, critical factors of customer satisfaction of selected supermarkets were location, staff, reliability, product quality and additional services.
Figure 4.8: Summary Dimensions
4.2 Comparative analysis of ICA Nära, ICA and COOP
In this section, comparative analysis of the 3 supermarkets ICA Nära, ICA and COOP was presented across above mentioned dimensions. In addition, the research demonstrated satisfaction levels in accordance with other complementary factors such as gender, age, frequency of visits and store name.
In relation to sample size of respondents from the 3 stores, the maximum score of each element was 250 for ICA, 250 for COOP and 125 for ICA Nära. The score obtained across each element was calculated in percentage of the total score of that element.
4.2.1 Location
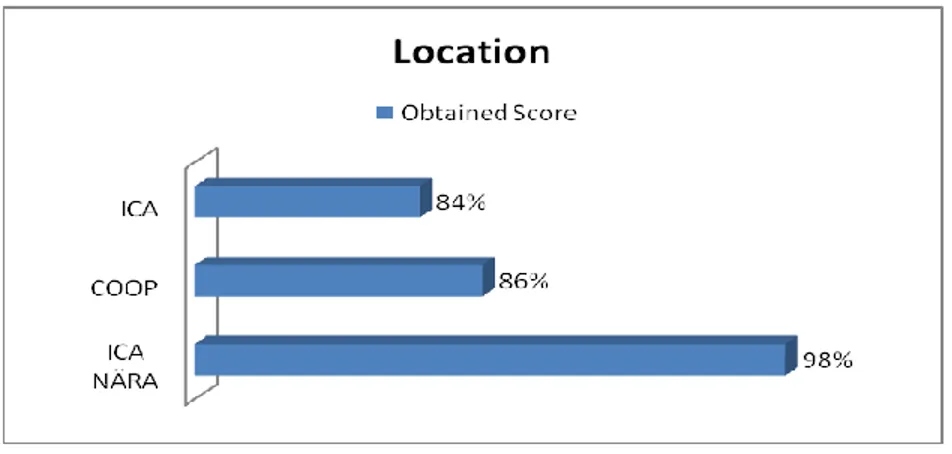
For the first dimension ”location”, the obtained score of ICA accounted for 84% of total score
across this dimension. COOP got 86 % and ICA Nära held the highest score equivalent to 98%.
Figure 4.9 showed that customer satisfaction of ICA Nära was very high since ICA Nära has a good location near to neighborhood. Customers were satisfied with ICA nearly as equally as COOP.
27 Figure 4.9: Location of 3 stores
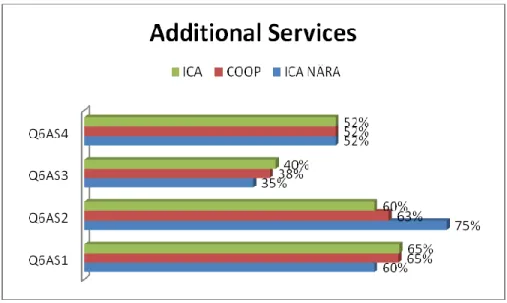
4.2.2 Additional services
Figure 4.10 showed customer satisfaction of 3 stores in relation to 4 elements of additional services. For the first element “membership card”, ICA Nära‟s customers felt less satisfied than of COOP and ICA at 60% in comparison to 65% of COOP and ICA respectively. Since COOP and ICA are the bigger retailers, their services in term of membership were likely to give more offers than ICA Nära.
However, ICA Nära got the highest percentage of obtained score at 75% with respect to the second element “parking lot”. COOP possessed slightly higher percentage of 63% than 60% of ICA. This result explained that customers were more satisfied with parking service at ICA Nära. It was unnecessary for them to use parking lot as most of them lived nearby the store.
The third element “baby areas” gave ICA highest rank of obtained score which accounted for 40%. COOP followed with 38% and ICA Nära was with 35%. These figures were accurate as ICA was the only store which had areas for baby keeping. Thus, customers were most pleased with ICA for this addition service.
For the fourth element “delivery of goods”, the 3 stores had equal obtained scores which were equivalent to 52%. Hence, customers were equally content with delivery of all supermarkets.
28 Figure 4.10: Additional services of 3 stores
4.2.3 Product quality
This dimension included 3 elements “freshness of products (meat, vegetables and fruits), “durability” and “product variety”. According to Figure 4.11, the general trend indicated that customers of all 3 stores were most satisfied with “freshness of products Q6PQ1”. They were less satisfied with “product variety Q6PQ3” and least satisfied with “durability Q6PQ2”.
Figure 4.11: Product Quality of 3 stores
Across 3 elements, ICA had the highest obtained scores out of total scores of each element while COOP and ICA Nära got nearly equal percentages of these obtained scores.
29
For first element “freshness of products”, ICA‟s obtained score out of overall score 250 was equivalent for 91%. COOP and ICA Nära accounted for 86% and 84% respectively. Customers felt highly satisfied with ICA since the supermarket had advantage of ecological products.
For second element “durability”, percentages of obtained scores assigned by respondents were 81% for ICA, 75% for COOP and 74% for ICA Nära.
Similarly, across the third element “product variety”, ICA got 82%; COOP and ICA Nära shared the same percentages of 78% of obtained scores.
In summary, customer satisfaction of ICA was highest; customers of COOP and ICA Nära were nearly equally satisfied across dimension of product quality.
4.2.4 Facilities
Facilities consisted of 3 elements such as “clean and spacious atmosphere Q6FAC1”, “display, decoration Q6FAC2”´and “music, interior Q6FAC3”.
Figure 4.12: Facilities of 3 stores
Across this dimension for ICA, element Q6FAC1got highest percentage at 82% of the maximum score for each element. Q6FAC2 accounted for 68% and Q6FAC3 got 52%. It implied that customers of ICA were most pleased with “clean and spacious atmosphere” and least with “music, interior”.
Across this dimension for COOP, element Q6FAC1got highest percentage at 80% of the maximum score for each element. Q6FAC2 accounted for 71% and Q6FAC3 got 52%. The result showed that customers of COOP were similarly most pleased with “clean and spacious atmosphere” and least with “music, interior”.
30
However, there was difference for ICA Nära in term of this dimension, Q6FAC1 got 78% while Q6FAC2 accounted for the highest percentage of 79% and Q6FAC3 held 49%. For ICA Nära, customers were most content with display of the store.
Figure 4.12 showed the general trend that customers of ICA and customers of COOP were most satisfied with “clean and spacious atmosphere” while ICA Nära‟s customers felt most satisfied with “display” of the store since they spent less time to find products with simple layout of such a small store.
4.2.5 Reliability
Across this dimension, ICA and ICA Nära showed the same trend that element Q6REL1 got lower percentage at 80% and 79% respectively of maximum score for this element. Q6REL2 accounted for remaining 86%. While COOP had equal percentages for both mentioned elements at 82% for each.
This result indicated that customers of ICA and customers of ICA Nära felt more satisfied with “correct information of price signs and discounts” than “accuracy of receipt”. For COOP, customers expressed the same satisfaction levels for the 2 elements.
Figure 4.13: Reliability of 3 stores
4.2.6 Process
According to Figure 4.15, the general trend demonstrated that customers of all 3 stores were most satisfied with “operation hour Q6PRO2”.
31 Figure 4.15: Process of 3 stores
For first element “number of counters, express counters Q6PRO1”, COOP got the highest percentage of obtained scores assigned by respondents with 77% . ICA followed with slightly lower percentage of 76% while ICA Nära got the lowest with 69%. Customers felt most satisfied with COOP since this store offered them shop express service with express check-out counter. Whereas ICA Nära had least counters which led to lower satisfaction of this element.
For second element “operation hour Q6PRO2”, COOP and ICA showed higher percentage of scores with 81% and 82% respectively than ICA Nära with 78%. It was logical that customers were more content with COOP and ICA as the 2 stores operated with longer hours than ICA Nära within a day.
Respondents were most satisfied with ICA regarding “queues and waiting time at counters Q6PRO3” with 77%. ICA Nära got 65% against COOP with 63% for this element. Even though ICA Nära had fewer counters than COOP, customers expressed higher satisfaction since they spent less time to wait at queues for payment than COOP.
4.2.7 Value for money
According to figure 4.15, COOP had the highest score for element Q6VFM1 which was 76%. ICA and ICA Nära got 74% and 73% respectively for this element. Similarly, COOP got percentage of 75 for Q6VFM2. ICA and ICA Nära shared the equal percentages of 74% of total score for the element Q6VFM2.
32 Figure 4.15: Value for Money of 3 stores
This result showed that customers were most satisfied with price of COOP as they agreed the price was more competitive than ICA and ICA Nära. For frequency of promotions and discounts, satisfaction level was almost the same for all stores. Besides, customers felt more satisfied and concerned more about price than frequency of promotion and discount.
4.2.8 Staff
For this dimension, ICA Nära got the same high percentages at 91% of obtained scores for both element Q6STF1 and Q6STF2. Hence, respondents expressed equal satisfaction for “friendly, helpful staff” and “knowledgeable staff with quick performance”. Besides, customers felt highly satisfied with staff of ICA Nära.