Page 1 of 4
ANALYSIS OF A COORDINATED MULTI-ECHELON INVENTORY
CONTROL SYSTEM
- A case study on its performance compared to the current inventory control system at Syncron
Oskar Callenås
Christian Lindén
Department of Industrial Management and Logistics,
Lund University, Lund Institute of Technology
SE-221 00 Lund, SWEDEN
ABSTRACT
Even though coordinated inventory control is becoming more well-known, it is relative unused by companies, despite obvious advantages. This article is based on the results of a master thesis written in 2010 at Lund University, in cooperation with the company Syncron. It illustrates the result of using coordinated inventory control compared to a currently used non-coordinated inventory control.
In the study, a coordinated model to calculate reorder points has been used to show the effects it would have on a distribution system compared to the current uncoordinated setup for one of Syncron’s customers. The impact from the different reorder points on the system was compared by simulations in the simulation software Extend.
The results of the project show that by using a coordinated control of the inventory system, the total inventory in the system is reduced significantly, with about 35%, while the service level most of the times are improved or at least maintained. Most of the inventory within the inventory system has shifted from the central warehouse out to the retailers.
1. BACKGROUND
Today, there is no effective and simple method to optimize the reorder points in a multi‐echelon inventory system. Some theoretical results on how the exact reorder point can be determined for a one-warehouse-multi-retailer system with an (R,Q)-policy exist, see e.g. (Axsäter, 2000). The drawback for this exact method is that it becomes computationally complex and it is almost impossible to use for larger systems with high demand and/or many retailers.
Syncron is currently controlling the ordering process (i.e. the reorder points) in a decentralized manner without any direct coordination between the different echelons. A team at the division of Production Management at Lund University has developed a procedure for calculating the reorder points in a similar manner but with a great potential for improved coordination. This coordinated method uses an induced backorder cost at the central warehouse and the method is based on the research presented in three different research articles. The first article deals with a model for the optimization of a multi-echelon inventory system with identical retailers, based on a simple assumption that the perceived stochastic lead-times at the retailers are replaced with the correct averages (Andersson, Axsäter, & Marklund, 1998). The second article describes how the problem can be solved for non-identical retailers (Andersson & Marklund, 2000). The third and last article examines how a simple closed form expression for estimating induced backorder cost of the central warehouse could make the model conceptually and computationally simpler to use (Berling & Marklund, 2006). The induced backorder costs at the central warehouse are developed and used earlier than in the third article, but the third article presents a method to do this in a manner that is computationally simple.
Page 2 of 4
This induced backorder cost at the central warehouse allows the multi-echelon inventory system to be broken down into several single-echelon inventory systems. The inventory system studied in this paper is illustrated in Figure 1 above and consists of one central warehouse and a number of retailers (the current simulation program allows up to eleven different retailers) where the central warehouse is refilled from an outside supplier.
In the study, real customer demand from one of Syncron’s customers was used. In total 135 articles were investigated. Those articles were chosen so that the actual material flow within the customer’s inventory system was well represented.
2. OBJECTIVE
The objective of the project was to evaluate the coordinated model for control of a multi‐echelon inventory system. Furthermore, the reduction of inventory level was analyzed, with the simulation software Extend, when the coordinated method was used instead of the uncoordinated method used by Syncron’s Supply Chain Planner (SCP) today. The project also evaluates how well the coordinated model fulfills the target service levels defined by Syncron’s customer.
3. METHODOLOGY
This project followed the work procedure of an operations research project described in (Hillier & Lieberman, 2005, p. 8). An operations research can be divided into the following six stages:
1. Defining the problem and collect relevant data 2. Create a mathematical model representing the
problem
3. Develop a methodology to develop a solution to the problem of model
4. Test the model and improve it 5. Prepare to implement the model 6. Implementation
Most of the work in this project has been devoted in the 4th step where the analytical model has been validated and tested in conjunction to an existing inventory control model (Syncron’s current model) with the simulation program Extend. The result of step four, which is presented in this paper, evaluates the two inventory control models against each other and offer advice for future implementations. The fifth and sixth step falls outside of the scope of this project and is therefore delimitated.
Since some of the steps were already done by others or existing software could be used, a limited amount of time in this project has been put on these steps. E.g. step two and three where the analytical model was developed and programmed at the division of Production Management at Lund University.
4. THEORETICAL FRAME OF REFERENCE
In the analytical model and in the simulation model, some assumptions are made which will be explained below. These assumptions are in line with those in the three articles described in the background.
Customer demand in the system takes place at the retailers who replenish their stocks from the central warehouse.
The supplier always has the required units in stock which means that the lead time to the central warehouse is constant.
Transportation times from the central warehouse to the retailers are considered to be constant.
Stockouts at all echelons is handled in accordance to a first-come-first-served policy and all facilities apply a (R,Q)-policy with continuous review.
All orders quantities are considered to be predetermined and fixed. Partial deliveries are allowed, though.
Customer demand at the retailers either follows a Normal, Poisson or compound Poisson distribution in the analytical model depending on setting.
Customer demand is assumed to follow a compound Poisson distribution in the simulation model.
The objective with the analytical model is to optimize the reorder points for the whole inventory system so that the total cost is minimized. This total cost for the system can be divided into two parts, the cost at the central warehouse and the cost at the different retailers.
The approach to solve this coordinated problem is to use an induced backorder cost, β, at the central warehouse, which make it possible to decompose the multi-echelon inventory problem into N+1 single echelon problems that are relatively easy to solve. The basic idea behind β is that the central warehouse should share the shortage costs at the retailers. The main parameters that affect β, except the
Page 3 of 4
shortage cost at the retailers, are the standard deviation of the demand at the retailers and the order sizes from the retailers.
The analytical method to optimize the reorder points for a multi-echelon inventory system can be summarized in the following five steps:
1. Determine demand distribution (D0) at CW
2. Determine the “induced” backorder cost (β) at CW
3. Determine reorder point at CW (R0) by cost
minimization given D0 and β treating the CW as
a single-echelon inventory model
4. Given R0 determine the expected lead-time to
each retailer (Li)
5. Determine reorder points at each retailer (Ri) by
cost minimization given Li treating each retailer
as a single-echelon inventory model (with constant lead-time = Li)
6. RESULTS
The 135 studied articles were grouped depending on the settings in the analytical model to be able to analyze the result from various angles. These settings and a more thorough presentation of the results from the simulations can be found in (Callenås & Lindén, 2010). Each article is represented in two of the four groups bellow.
Group 1. Contains all the 135 articles in the study. These were calculated with a normal distributed approach as customer demand at the retailers (denoted Approach 1). Group 2. Contains 109 articles out of the 135 in
Group 1 that in addition to been calculated with Approach 1, i.e. assumed normal distributed customer demand at the retailers, also were calculated with the empirically obtained Compound Poisson-distributed demand at the retailers (denoted Approach 2).
Group 3. Contains 15 articles out of the 135 in Group 1 that were not possible to calculate with the Compound Poisson-Empirical approach, due to time consuming calculations, and were instead calculated with the Negative Binominal approach as customer demand at the retailers.
Group 4. Contains 11 articles out of the 135 in Group 1 in which the reorder point could not be calculated for anymore settings than those in Group 1.
The articles in the second group were further grouped two times depending on demand type classification from the SCP (fast, slow and lumpy) and their total amount of demand.
Approach 2 is more computationally complex than Approach 1 and this is why the different groups have been created. The results with Approach 1 (i.e. with the normal approximation) compared with the SCP, shows that a coordinated inventory control can reduce the total inventory in the system with about 35%. The number of satisfied customers is almost in line with the target service level with Approach 1, something that the SCP does not achieve. It is on average a couple of percentage point below the target service level. Figure 2 below shows how the inventory is allocated between the different echelons with Approach 1. The inventory is reduced significantly at the central warehouse and increased at the retailer level.
Figure 2 – Inventory allocation with Approach 1.
When the articles were divided by demand type and size, a number of interesting results occurred. For fast articles, with a total customer demand between 1000 and 5000 units per year, the analytical model with the compound Poisson-Empirical setting as an approximation of customer demand (Approach 2) performed the overall best. This conclusion can be drawn because of its better robustness compared to Approach 1 in difference from target fillrate. Compared to the SCP, it reduces the total inventory by about 41%. However, the SCP meets target fillrate slightly better, but this small difference is compensated in Approach 2, with its large reduction in the total inventory. -83,7% 60,8% -34,8% -100% -50% 0% 50% 100% CW Retailers Total
Inventory Allocation
Page 4 of 4
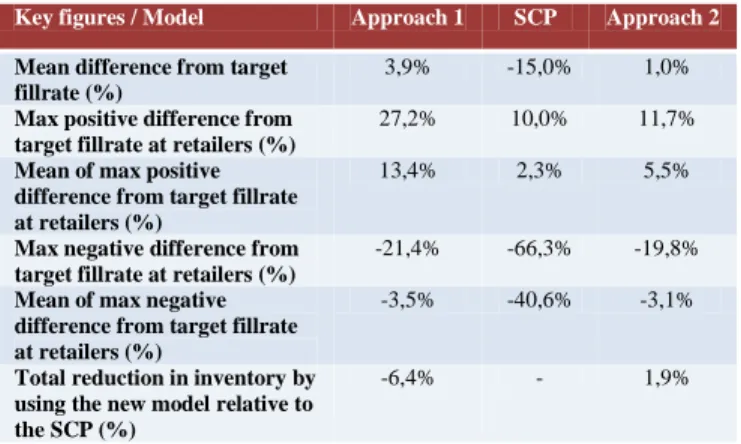
For the slow parts, with a total annual demand of less than 100 units per year, the results became more obvious. Both the analytical model and the SCP meet the target fillrate but Approach 2 reduces the inventory by over 47%. It is also a bit more robust, given the maximum deviations compared to Approach 1 and the SCP. Lumpy articles, with mostly a total demand of 100 to 1000 units per year, are not handled well by the SCP, which seems to have too low safety stock at the retailers for these articles. Table 1 gives an overview on these results.
Key figures / Model Approach 1 SCP Approach 2 Mean difference from target
fillrate (%)
3,9% -15,0% 1,0%
Max positive difference from target fillrate at retailers (%)
27,2% 10,0% 11,7%
Mean of max positive difference from target fillrate at retailers (%)
13,4% 2,3% 5,5%
Max negative difference from target fillrate at retailers (%)
-21,4% -66,3% -19,8%
Mean of max negative difference from target fillrate at retailers (%)
-3,5% -40,6% -3,1%
Total reduction in inventory by using the new model relative to the SCP (%)
-6,4% - 1,9%
Table 1 – Simulated results for lumpy articles.
According to the simulations, Approach 2 performs best if the different aspects are summarized for lumpy articles. Approach 1 meets target fillrate well but at the same time has a much higher positive deviation from the target fillrate, which can affect and raise the average fillrate for the system. Inventory reduction for Approach 2 is only slightly below 2 % for this group, and – 6 % for Approach 1, which also indicates low safety stock at the retailers.
7. CONCLUSIONS & RECOMMENDATIONS
From the simulation results, a conclusion can be drawn that the articles classified as slow and lumpy by the SCP should be controlled by the analytical model’s Approach 2 (compound-Poisson distributed setting as customer demand). If this is done, the target fillrate is achieved while the inventory is reduced by around 47% for the slow articles and approximately 2% for the lumpy articles. 2% for the lumpy articles doesn’t seem much, but for these articles Approach 2 meets target fillrate while the SCP is 11 - 19% below target fillrate.
The results also shows that 26 out of the 135 articles that could not be calculated quick enough with Approach 2 were all classified as fast by the SCP. Articles classified as fast by the SCP, should according to these results be controlled with Approach 1 (normal distributed setting as customer demand), which gives an inventory reduction on almost 40% compared to the SCP. The reason for this is
mainly that Approach 1 is less computationally complex than Approach 2 and Approach 1 can therefore be used for all articles classified as fast. The distinction between the approaches used for the different demand types minimize the risk of a reorder point calculation taking too long or crash when all the fast articles are calculated with Approach 1, even though Approach 2 sometimes gives a slightly better results for the fast articles that can be calculated with Approach 2.
The major advantage of the coordinated method compared to the uncoordinated method used by Syncron is its great savings potential by reducing the inventory at the same time as the service level most of the time is improved or at least maintained. The investment needed to implement the coordinated method in the SCP is relative small for Syncron. However the investment for the potential customers is unknown, which can be very big.
8. REFERENCES
Andersson, J., & Marklund, J. (2000). Decentralized
inventory control in a two-level distribution system.
European journal of operations research , 127, 483-506. Andersson, J., Axsäter, S., & Marklund, J. (1998).
Decentralized multiechelon inventory control. Production
and operations managment , 7 (4), 370-386.
Axsäter, S. (2000). Exact analysis of continious review
(R,Q)-ploicies in two-echelon inventory systems with compound Poisson demand. Operations Research , 48 (5), 686-696.
Berling, P., & Marklund, J. (2006). Heuristic
coordination of decentralized inventory systems using induced backorder costs. Production and operations
managment , 15 (2), 294-310.
Callenås, O., & Lindén, C. (2010). Analysis of a coordinated multi-echelon inventory control system.
Lund: Department of Industrial management & Logistics production management , Lund University.
Hillier, F., & Lieberman, G. (2005). Introduction to operations research. New York, USA: McGraw-Hill