1
Lead time analysis and reduction at Alfa
Laval DC Lund
Nils Wilhelmsson & Erik Dahlberg
Lund University, Faculty of Engineering Autumn 2012
Introduction
Company background
Alfa Laval is currently the world leader in heat transfer products but the company is also active in two other areas; separation and fluid handling (Alfa Laval, 2013a). Alfa Laval DC Lund is one of Alfa Laval’s distribution centers which provide the aftermarket with spare parts. The spare parts that Alfa Laval DC Lund supplies are used for the heat transfer business unit of Alfa Laval. DC Lund operates as a distribution center in the traditional sense but products are also manufactured on the same site. The ERP system Movex is used at all distribution centers globally as it is thought to have good support for warehousing.
The large majority of the articles handled at Alfa Laval DC Lund are plates and gaskets but there are also other articles such as bolts, frames (the blue parts in Figure 1), pumps etc. The size of the plates varies from 10x35cm to 120x300cm which demands flexibility in both production and in the warehouse. The heat exchangers work by running warm and cool liquid every other plate as can be seen in Figure 1. Plates are mounted on hangers and the heat exchanger is held together under a high pressure with large bolts (not shown in the figure).
2
In Figure 2 a heat exchanger plate can be seen. This particular plate has a glue-less clip-on gasket which means that the gasket is held in place by the black clips that can be seen as black extensions of the gasket at the edges of the plate. There is also another kind of gasket that is mounted using glue.
Figure 2: Heat exchanger plate with clip-on gasket (Alfa Laval, 2013b).
Order process
The order handling process starts when Alfa Laval DC Lund receives an order from the end-customer directly or from a sales office. If an order that arrives only contains articles that are held in stock, the articles are picked, packed and the order is shipped. If the order contains products that need to be manufactured the order process is different as can be seen in Figure 3. The parallelograms in the figure represent a registered event in Movex.
Figure 3: Manufacturing order process at Alfa Laval DC Lund. MO is manufacturing order
and CO is customer order.
Production
The production is divided into three work centers; C10, R10 and X10. These work centers are also present in Movex and contains different work operations in production. Different products require different work operations, meaning that all operations in a work center do not have to be performed. The C10 work center handles punching of article numbers as well as the mounting of the clip-on gaskets to plates. If any other operations are needed the production is carried out in the X10 work center. This includes punching of holes and article numbers, projection welding of hanger reinforcements, spot welding of plate strengtheners (only used on older plates), applying glue, mounting gaskets, putting the plates in the oven as well as inspecting the gaskets after the oven. Some gaskets that are used for mounting using glue need to be roughened, this operation is performed in the third work center, R10.
MO suggestion automatically
created
MO released MO entry date & time CO received
CO entry date & time
MO is printed and delivered to production Picking done Actual start date Production finished and order is put away Actual finish date
Picked, packed and shipped Production
3
Problem formulation
A problem today is that the time it takes Alfa Laval DC Lund to produce and send an order to a customer is perceived as too long. It is not known where in the process the majority of time is spent as well as what can be done to reduce it.
Purpose & Objective
The purpose is to perform a thorough analysis of the lead time for manufacturing orders from that the customer order arrives at Alfa Laval DC Lund to the customers theoretically receive delivery (based on predefined transportation/shipment time). The analysis should yield an overview of the lead time and pinpoint areas of improvement potential. A solution that will reduce lead time for manufacturing orders should be created and implemented. After the implementation of this solution further research areas should be identified and presented.
The main delimitations
Manufacturing orders connected with a customer order will be in focus No changes to suppliers, purchasing, sales or customer behavior will be made Analysis will be limited to Alfa Laval DC Lund
Analysis and improvements
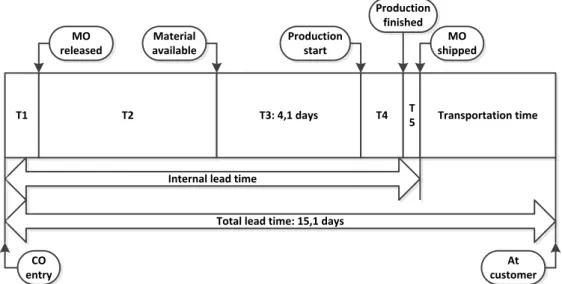
Data has been gathered through interviews, observations, literature studies and from measuring processes and extracting data from the ERP system’s database. To provide an overview of the lead time it was divided into six distinct measurements. In Figure 4 the overview of these lead time measurements can be seen. The values behind this figure have been calculated using the data extracted from Movex. The sizes of the measurements in the figure represent their part of the total lead time. This graphical overview is a powerful tool in determining where the largest parts of the lead time are positioned. It is also effective in providing an understanding of the lead time process. The measurement T2, which is supplier lead time, is the largest part of the total lead time. After this transportation time and the measurement T3, which is waiting time to start production, are roughly equal. Of these three measurements, which have the largest impact on the lead time, T3 is the only one within the scope of the project and it has therefore been analyzed further.
Figure 4: Overview of measurements, sizes roughly matching average times.
T1 T2 T3: 4,1 days T4 T
5 Transportation time
Internal lead time
Total lead time: 15,1 days
At customer CO entry MO released Material available Production start Production finished MO shipped
4
In the further analysis it was concluded that T3 could be divided into two parts; planned waiting time to start production and difference in actual and planned production time. Analysis of these revealed that planned waiting time to start production was due to capacity constraints in production and the difference in actual and planned production time was due to wrong production lead time in the ERP system Movex. To reduce the planned waiting time to start production an action plan to increase flexibility in the workforce was created. This solution will however take several months to finalize and has therefore been left to Alfa Laval DC Lund. To reduce the difference in actual and planned production lead time the production lead time in Movex was adjusted after identifying which products that should be changed. The products that could not be identified initially will be adjusted continuously. Computer based tools has been created and left to Alfa Laval DC Lund for this purpose.
Results
When all products with incorrect production lead times have been adjusted the benefits of the implemented solution will be a 30% decrease in internal lead time when material is available from start and a 10% decrease in internal lead time when material is not available from start. This will in turn generate a total of approximately 14 000 euro per year in savings from less tied up capital and profits from earlier revenue. The initial adjustment of production lead times has already yielded a significant lead time reduction. The analysis has also yielded information that Alfa Laval DC Lund can use to start new projects with the purpose to reduce lead time and/or improve their business.
Conclusions
It has been concluded that human interference with as well as wrong data in ERP systems drive lead times. The research also demonstrates the importance of working with the ERP system and using its features in a correct way instead of working beside and overriding it.
Scientific contributions
The results of this research are not generalizable, however this report provides a good methodology of how the lead time both efficiently and effectively can be analyzed and improved in businesses. If a project should be initiated with the intent to reduce lead time this is an efficient way of structuring the project. To perform the analysis the lead time should be divided into different but not to small and detailed processes. This will provide an overview (graphical is preferred) of the lead time and yield areas that could be improved. These areas should then, if possible, be broken down into even smaller processes. A root cause analysis should then be performed to find a solution that reduces lead time.
Further research areas
There are several areas that Alfa Laval DC Lund can and should improve some of which are: Reduce supplier lead times
Correct wrong data in Movex
Digitalize paper handling in production
Earlier and automated release of manufacturing orders to production
References
Alfa Laval, (2013a). About Alfa Laval. [Online] Available at: http://www.alfalaval.com/about-us/ [Accessed 2013-01-21].
Alfa Laval, (2013b). Products. [Online] Available at: http://www.alfalaval.com/solution-finder/products/ [Accessed 2013-01-21].