Excess success in
“Don’t count calorie labeling out: Calorie counts on the left
side of menu items lead to lower calorie food choices”
Gregory Francis
Department of Psychological Sciences, Purdue University, West Lafayette, USA
Evelina Thunell
Department of Clinical Neuroscience, Karolinska Institutet, Stockholm, Sweden Department of Psychological Sciences, Purdue University, West Lafayette, USA
Abstract
Based on findings from six experiments, Dallas, Liu, and Ubel (2019) conclude that placing calorie labels to the left of menu items influences consumers to choose lower calorie food options. Contrary to previously reported findings, they suggest that calorie labels can influence food choices, but only when placed to the left because they are in this case read first. If true, these findings have important implications for the design of menus and may help address the obesity pandemic. However, an analysis of the reported results indicates that they seem too good to be true. We show that if the effect sizes in Dallas et al. (2019) are representative of the populations, a replication of the six studies (with the same sample sizes) has a probability of only 0.014 of producing uniformly significant outcomes. Such a low success rate suggests that the original findings might be the result of questionable research practices or publication bias. We therefore caution readers and policy makers to be skeptical about the results and conclusions reported by Dallas et al. (2019).
Keywords: Calorie labeling, statistics, Test for Excess Success.
Many scientists take significant results that are replicated across multiple studies as strong sup-port for their conclusions. However, this interpre-tation requires that the studies have high power. For example, when conducting six independent studies, each with a power of 0.5, one should ex-pect only about half of the studies to produce sig-nificant results. It would be very rare for all six studies to produce significant results, namely 0.56 ≈ 0.016. When such excess success is observed in a publication, readers should suspect that the exper-iments were carried out using questionable
re-search practices (John et al., 2012; Simmons et al., 2011) or that some experiments with non-significant results were run but not reported (pub-lication bias; Francis, 2012a). A set of studies with too much success likely misrepresents reality, and conclusions from such studies should be discount-ed until non-biasdiscount-ed investigations can be per-formed.
Here, we use a Test for Excess Success (TES) analysis (Francis, 2013a; Ioannidis & Trikalinos, 2007; see also Schimmack, 2012) to show that the results of a recent article by Dallas et al. (2019)
2
seem too successful. While there are other meth-ods (see for example Renkewitz & Keiner, 2019) that aim to detect publication bias or questionable re-search practices, the TES analysis is currently the only approach that deals with multiple hypothesis tests from a single sample; something that is rele-vant for the findings reported in Dallas et al. (2019). Existing alternative methods must select just one test from each sample because they require inde-pendent statistics. However, it is not always clear which test should be selected, and the choice can make a big difference in the conclusions and inter-pretation (e.g. Bishop & Thompson, 2016; Erdfelder & Heck, 2019; Simonsohn et al., 2014; Ulrich & Mil-ler, 2015). Thus, we have opted for the TES, because it allows us to consider the full set of tests that Dallas et al. (2019) use to support their conclusions. Concerns about the TES analysis method (e.g., Morey, 2013; Simonsohn, 2013; Vandekerckhove, Guan, & Styrcula, 2013) have been addressed in (Francis, 2013a, 2013b) where it is argued that the criticism reflects misunderstandings about the test or about the notion of excess success. In particular, some critics have been concerned that the TES only confirms what is already known, since all studies are biased in some way. While the critics may be correct in the broadest sense of the term bias, here we use the TES to identify bias that spe-cifically undermines the claims of the original study. We suspect that the authors of papers with results that seem too good to be true did not real-ize that their reported findings were actually in-compatible with their claims. Thus, the TES analy-sis, as used here, provides previously unknown insights into the interpretation of their studies. Some critics have also been concerned that there may be a “file drawer” of TES analyses of studies that did not show signs of bias, and that selective reporting of TES analyses of studies that did show signs of bias undermines the Type I error control of the method in the same way that publication bias can give a false representation of the strength of an effect. While there surely is a file drawer of TES analyses, it does not matter for interpreting a given data set. In general, a conclusion that a set of stud-ies seems to be biased should be made relative to the conclusions of the original authors: When ap-plying the TES, we can draw conclusions about the presence of bias in a set of studies even if other, unrelated, analyses of other studies do not indicate
any bias, or are not analyzed or reported. In fact, just as in experimental studies, publication bias across TES analyses becomes a problem only if the conclusions are wrongly generalized (to, say, all publications from a concerned author, all articles published in a certain field, or all articles in a cer-tain journal). In the present study, the TES file drawer is not a problem because we are drawing conclusions about the set of studies in Dallas et al. (2019) relative to the original authors’ conclusions, and we are thus analyzing the whole population of interest. Finally, some forms of the TES pool effect sizes across studies and thus do not behave well when there is heterogeneity of effect sizes (Renkewitz & Keiner, 2019); a characteristic shared by many other methods for investigating question-able research practices. Here, we use a version of the TES that estimates power for each individual study rather than pool effect sizes. Thus, this con-cern does not apply to our current analysis.
Based on six successful studies, Dallas et al. (2019) conclude that consumers opt for lower calo-rie food items when calocalo-rie information is dis-played on the menu – but only when it is placed so that it is read before the food names. According to the authors, previous failures to show an effect of calorie labeling on menus can be attributed to the fact that the calorie information was placed to the right of, and were thus read after, the food names. Dallas et al. (2019) correctly argue that their con-clusions could have important implications for pol-icy making to address the obesity crisis in America and elsewhere (Sunstein, 2019). However, the im-plications are only valid if the conclusions are valid, and the excess success of their findings under-mines the credibility of the conclusion.
Material and Methods
The mean, standard deviation, and sample size for each condition in each experiment reported by Dallas et al. (2019) and an associated corrigendum (Dallas et al., 2020) are reproduced in Table 1, to-gether with the key hypotheses used to support their theoretical conclusions. (The corrigendum corrected the sample size of the right label condi-tion in study 1 and the sample size, mean, and standard deviation for the no label condition in study 3. We used these corrected values for our
satisfied the hypotheses, thereby providing uniform support for the conclusions. Namely, in five of the studies (studies 1, 2, S1, S2, and S3), participants ordered fewer calories when calorie labels were placed to the left of food names, as compared to when they were placed on the right side. The re-maining study (study 3) reported a corresponding effect for Hebrew readers (who read from right to left rather than left to right), so that calorie labels on the right (vs. left) led to lower calorie choices. Studies 1, S2, and S3 included a third condition with no calorie labels, and the number of calories or-dered in the left condition was also significantly lower than this no label condition.
We evaluated the plausibility of all six studies producing uniform success, by computing esti-mates of experimental power for replications of each of the studies. These power estimates are based on the statistics reported by Dallas et al. (2019) and the corrigendum (Dallas et al. 2020), so our analysis starts by supposing that the reported findings are valid and accurate. Since the studies are statistically independent, we can then compute the probability of the full set of studies being uni-formly successful by multiplying the power esti-mates of the individual studies.
We first describe how to calculate the experi-mental power of the studies that used a single hy-pothesis test (study 2 and study S1). In this case the reported t value and sample sizes can be converted to a Hedges’ g standardized effect size (Hedges’ g is similar to Cohen’s d, but with a correction for small sample sizes). For example, the conclusion of study 2 in Dallas et al. (2019) is based on a significant two-sample t-test between the left and right calorie conditions, with g = 0.25. Based on this value, the power of a future experiment for any given sample size is easy to calculate. We used the pwr library (Champely et al., 2018) in R to compute power for a replication experiment that uses the same sample sizes as the original study. Alternatively, the power could be computed from the means, standard
devi-lator in Francis (2018) or similar tools. The same procedure applies to study S1.
It is more complicated to estimate the power when a study’s conclusions depend on multiple hypothesis tests. Studies 1, 3, S2 and S3 in Dallas et al. (2019) are based on at least three significant hy-pothesis tests. We describe the procedure for study 1, which is representative of our approach. In study 1, a significant ANOVA was required to indicate a difference across conditions (left, right, or no calo-rie labels). In addition, the conclusions required both a significant contrast between the left and right calorie label conditions and a significant con-trast between the left and no calorie label condi-tions. Because multiple tests are required for the results to fully support the conclusions, there is no single standardized effect size that can be used to compute the power of the study. Instead, we ran simulated experiments that drew random samples of the same size as the original study from normal distributions with population means and standard deviations matching the statistics reported by Dal-las et al. (2019). We then performed the three tests that were used in the original study on the simulat-ed data. The process was repeatsimulat-ed 100,000 times to give a reliable measure of the proportion of sim-ulated experiments that found significance for all three tests. This proportion was then used as an estimate of the overall power of the study.
The same procedure was used for studies 3, S2, and S3, using the respective reported statistics. Some of these studies comprised additional media-tion analyses, which we did not include in our TES analysis (the provided summary statistics do not contain enough information to generate simulated data for these tests). Since all of the mediation ef-fects were in agreement with the conclusions in Dallas et al. (2019), including them in our analysis could only further reduce the estimated power.
Simulation source code written in R (R core team, 2017) for all of the analyses is available at the Open Science Framework: https://osf.io/xrdhj/.
4
Results
The rightmost column in Table 1 shows the es-timated power for each of the studies in Dallas et al. (2019). Each study has a power of around 0.5, so replication studies with the same sample size as the original studies should produce significant results only about half of the time, assuming that the population effects are similar to the reported sam-ple effects. Thus, even if the position of calorie la-bels does influence food selection, it is very unlike-ly that six studies like these would consistentunlike-ly show such an effect. Indeed, the probability of all
six studies being successful is the product of the power values in Table 1, which is only 0.014.
How could Dallas et al. (2019) find positive re-sults in all their studies when this outcome was so unlikely? One possible explanation is publication bias: Perhaps Dallas et al. (2019) ran more than six studies, but did not report the studies that failed to produce significant outcomes. Such selective re-porting is problematic (Francis, 2012b). Consider the extreme case where there is no effect at all: Because of random sampling, some studies will still produce significant results. Certainly, it is mislead-ing to only report these false positives and leave out the majority of studies that did not show a sig-nificant effect. Another possible explanation is that
Table 1. Supporting hypotheses, statistical properties, and estimated power for the tests in the TES analysis of the six studies in Dallas et al. (2019).
Study Supporting hypotheses Left
Calorie Placement
Right No label Power
1 Main effect of calorie information μleft < μright μleft < μnocalories x̄= 654.53 s = 390.45 n = 45 x̄= 865.41 s = 517.26 n = 54 x̄= 914.34 s = 560.94 n = 50 0.4582 2 μleft < μright x̄= 1249.83 s = 449.07 n = 143 x̄= 1362.31 s = 447.35 n = 132 --- --- 0.5426
3 Main effect of calorie information μleft > μright μnocalories > μright x̄= 1428.24 s = 377.02 n = 85 x̄= 1308.66 s = 420.14 n = 86 x̄= 1436.79 s = 378.47 n = 81 0.3626 S1 μleft < μright x̄= 185.94 s = 93.92 n = 99 x̄= 215.73 s = 95.33 n = 77 --- --- 0.5358
S2 Main effect of calorie information μleft < μright μleft < μnocalories x̄= 1182.15 s = 477.60 n = 139 x̄= 1302.23 s = 434.41 n = 141 x̄= 1373.74 s = 475.77 n = 151 0.5667
S3 Main effect of calorie information μleft < μright μleft < μnocalories x̄= 1302.03 s = 480.02 n = 336 x̄= 1373.15 s = 442.49 n = 337 x̄= 1404.35 s = 422.03 n = 333 0.4953
range of conducted analyses. A typical example of this approach is when researchers use several methods for outlier exclusion and then only report the one that resulted in the most favorable out-come. As another example, researchers may run their analysis on a set of data and then decide whether to gather more data based on the outcome of this intermediate analysis (e.g., stop if the results are significant and otherwise gather more data). Because this procedure results in multiple tests, the Type I error rate is inflated (Simmons et al., 2011).
The selective reporting strategies described above are unfortunately rather common (John et al., 2012). We cannot know how Dallas et al. (2019) achieved their excessively successful results, but we can conclude that this set of studies does not make a plausible argument in support of the au-thors’ conclusions. We recommend that scientists generally ignore the findings and conclusions of Dallas et al. (2019). New studies will be required to determine whether calorie label position actually has the hypothesized effect on food choices.
Designing new studies
A scientist planning new studies on calorie label position might be tempted to base a power analysis on the results of Dallas et al. (2019). We show how this can be done, but we also caution readers that findings exhibiting excess success likely overesti-mate the reported effect size (Francis, 2012b; Sim-mons et al., 2011). Therefore, this approach likely overestimates experimental power and underesti-mates the necessary sample sizes.
For simplicity, we consider only the main com-parison in the studies of Dallas et al. (2019): a differ-ence in calories ordered depending on whether the calorie information was presented before or after the food names (in terms of reading direction). We used the reported means and (pooled) standard deviation to compute a standardized effect size (Hedge’s g) for each study, and ran a meta-analysis to pool the effect sizes across experiments (source code is at the Open Science Framework). As an aside, a meta-analysis might not actually be appro-priate for these studies because they differed in a number of potentially important methodological
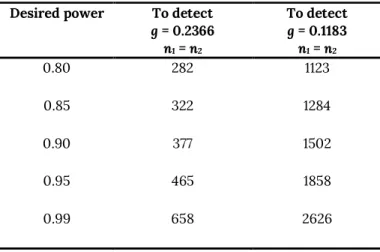
tion was to order an entrée and a drink, while in others the menu only included entrées, or entrées and desserts. Still, the reported standardized effect sizes have mostly overlapping confidence intervals, and the meta-analysis will give a rough estimate of the effect size that might exist for a new study. Researchers who feel that the full meta-analysis is not appropriate might pool the data in other ways. The standardized effect size for the individual ex-periments in Dallas et al. (2019) varies from 0.15 to 0.45, with smaller effect sizes for the studies with larger sample sizes. In a meta-analysis, studies with larger sample sizes carry more weight. Taking this weighting into account, the pooled effect size is g* = 0.2366.
The second column of Table 2 shows the sample size per condition needed to achieve a specified power in a single study, based on the pooled effect size. To achieve 80% power, a new study should use 282 participants per condition; only one (study S3) out of the six studies in Dallas et al. (2019) had at least this many participants. To achieve 90% power, sample sizes larger than any of the six stud-ies (377 participants per condition) are required. Since these sample sizes are based only on the main comparison of left versus right positions of the calorie labels, new studies that also include the left vs. no labels comparison or mediation analysis will require even larger sample sizes.
As noted above, the excess success analysis sug-gests that the pooled effect size is based on studies that most likely overestimate the effect size. A cau-tious scientist might therefore want to suppose that the population effect is smaller than the meta-analysis estimate: say, by one half. The third col-umn of Table 2 shows the corresponding required sample sizes. In this case, to achieve 80% power for detecting a difference between the two calorie label placements, a sample size of 1123 participants per condition is needed. For an experiment to have 90% power, it would need to have 1502 participants in each condition. Of course, power is not the only important characteristic of an experiment. One issue is that in the menus used by Dallas et al. (2019), placing the calorie labels after the food item name tended to place the label next to the item price. Having two number items next to each other introduces visual clutter that can make it difficult for viewers to parse out relevant information (Shive
6
& Francis, 2008). It is possible that viewers better process the calorie information when it is present-ed before the food name simply because it is then presented far from the price information. Bleich et al. (2017) describe a number of additional challenges in studying the impact of calorie labels on food choices.
Table 2. Sample sizes required for a new study in-vestigating left/right placement of calorie labels to have a desired power.
Conclusions
Dallas et al. (2019) note that their findings may have important implications for policies regarding calorie labels and their possible impact on obesity. However, such implications are only valid if the reported data support their conclusions. Given the inherent variability in data collection, some non-significant results are highly likely when conduct-ing experiments like their six reported studies - even if the effect of calorie label position is real and similar in magnitude to what they report. The ex-cess sucex-cess in the reported studies, i.e. the lack of non-significant results, indicates that something has gone wrong during data collection, analysis, reporting, or interpretation, perhaps unbeknownst to the authors (Gelman & Loken, 2014). We there-fore advise readers to be skeptical about the results and conclusions reported by Dallas et al. (2019).
Author Contact
Corresponding author: Gregory Francis, gfran-cis@purdue.edu, ORCID: https://orcid.org/0000-0002-8634-794X.
Evelina Thunell, evelina.thunell@ki.se, ORCID: https://orcid.org/0000-0002-9368-4661
Conflict of Interest and Funding The authors declare no competing interests.
Author Contributions
GF and ET contributed to conception and inter-pretation. GF developed the analyses and wrote the code. GF and ET wrote the article and approved the submitted version for publication.
Open Science Practices
This article earned the Open Materials badge for materials openly available. It has been verified that the analysis reproduced the results presented in the article. The entire editorial process, including the open reviews, are published in the online sup-plement.
References
Bishop, D. V. M., & Thompson, P. A. (2016). Problems in using p-curve analysis and text-mining to detect rate of p-hacking and evidential value. PeerJ, 4, 4:e1715.
https://doi.org/10.7717/peerj.1715
Bleich, S. N., Economos, C. D., Spiker, M. L., Ver-cammen, K. A., VanEpps, E. M., Block, J. P., Elbel, B., Story, M., & Roberto, C. A. (2017). A systematic review of calorie labeling and
modi-Desired power To detect
g = 0.2366 n1 = n2 To detect g = 0.1183 n1 = n2 0.80 282 1123 0.85 322 1284 0.90 377 1502 0.95 465 1858 0.99 658 2626
consumer and restaurant behavior. Obesity, 25(12), 2018–2044.
https://doi.org/10.1002/oby.21940 Champely, S., Ekstrom, C., Dalgaard, P., Gill, J.,
Weibelzahl, S., Ford, C., & Volcic, R. (2018). Package ‘pwr’: Basic functions for power analy-sis description.
Dallas, S. K., Liu, P. J., & Ubel, P. A. (2019). Don’t count calorie labeling out: Calorie counts on the left side of menu items lead to lower calo-rie food choices. Journal of Consumer Psycholo-gy, 29(1), 60–69.
https://doi.org/10.1002/jcpy.1053
Dallas, S. K., Liu, P. J., & Ubel, P. A. (2020). Corri-gendum: Don’t count calorie labeling out: calo-rie counts on the left side of menu items lead to lower calorie food choices. Journal of Con-sumer Psychology, 30(3), 571–571.
https://doi.org/10.1002/jcpy.1162
Erdfelder, E., & Heck, D. W. (2019). Detecting evi-dential value and p-hacking with the p-curve tool: A word of caution. Zeitschrift Fur Psycho-logie / Journal of Psychology, 227(4), 249–260. https://doi.org/10.1027/2151-2604/a000383 Francis, G. (2012a). Publication bias and the failure of replication in experimental psychology. Psy-chonomic Bulletin and Review, 19(6), 975–991. https://doi.org/10.3758/s13423-012-0322-y Francis, G. (2012b). Too good to be true: Publication
bias in two prominent studies from experi-mental psychology. Psychonomic Bulletin & Re-view, 19, 151–156.
https://doi.org/10.3758/s13423-012-0227-9 Francis, G. (2013a). Replication, statistical
con-sistency, and publication bias. Journal of Math-ematical Psychology, 57(5), 153–169.
https://doi.org/10.1016/j.jmp.2013.02.003 Francis, G. (2013b). We should focus on the biases
that matter: A reply to commentaries. Journal of Mathematical Psychology, 57(5), 190–195. https://doi.org/10.1016/j.jmp.2013.06.001 Francis, G. (2018). Power for independent means.
IntroStats Online (2nd edition).
https://introstatsonline.com/chapters/calcul ators/mean_two_sample_power.shtml Gelman, A., & Loken, E. (2014). The statistical crisis
in science. American Scientist, 102(6), 460–465. https://doi.org/10.1511/2014.111.460
ploratory test for an excess of significant find-ings. Clinical Trials, 4(3), 245–253.
https://doi.org/10.1177/1740774507079441 John, L. K., Loewenstein, G., & Prelec, D. (2012).
Measuring the prevalence of questionable re-search practices with incentives for truth tell-ing. Psychological Science, 23(5), 524–532. https://doi.org/10.1177/0956797611430953 Morey, R. D. (2013). The consistency test does
not-and cannot-deliver what is advertised: A com-ment on Francis (2013). Journal of Mathematical Psychology, 57(5), 180–183.
https://doi.org/10.1016/j.jmp.2013.03.004 Renkewitz, F., & Keiner, M. (2019). How to detect
publication bias in psychological research. Zeitschrift Für Psychologie, 227(4), 261–279. https://doi.org/10.1027/2151-2604/a000386 Schimmack, U. (2012). The ironic effect of
signifi-cant results on the credibility of multiple-study articles. Psychological Methods, 17(4), 551–566. https://doi.org/10.1037/a0029487
Shive, J., & Francis, G. (2008). Applying models of visual search to map display design. Interna-tional Journal of Human-Computer Studies, 66(2), 67–77.
https://doi.org/https://doi.org/10.1016/j.ijhc s.2007.08.004
Simmons, J. P., Nelson, L. D., & Simonsohn, U. (2011). False-positive psychology: Undisclosed flexibil-ity in data collection and analysis allows pre-senting anything as significant. Psychological Science, 22(11), 1359–1366.
https://doi.org/10.1177/0956797611417632 Simonsohn, U. (2013). It really just does not follow,
comments on Francis (2013). Journal of Mathe-matical Psychology, 57(5), 174–176.
https://doi.org/10.1016/j.jmp.2013.03.006 Simonsohn, U., Nelson, L. D., & Simmons, J. P.
(2014). P-curve: A key to the file-drawer. Jour-nal of Experimental Psychology: General, 143(2), 534–547. https://doi.org/10.1037/a0033242 Sunstein, C. R. (2019). Putting the calorie count
before the cheeseburger. Bloomberg Opinion. https://www.bloombergquint.com/view/calo rie-counts-on-menus-might-work
Team, R. C. (2017). R: A language and environment for statistical computing. R Foundation for Sta-tistical Computing.
8
Ulrich, R., & Miller, J. (2015). p-hacking by post hoc selection with multiple opportunities: Detecta-bility by skewness test?: Comment on Simon-sohn, Nelson, and Simmons (2014). Journal of Experimental Psychology: General, 144(6), 1137– 1145. https://doi.org/10.1037/xge0000086 Vandekerckhove, J., Guan, M., & Styrcula, S. A.
(2013). The consistency test may be too weak to be useful: Its systematic application would not improve effect size estimation in meta-analyses. Journal of Mathematical Psychology, 57(5), 170–173.