EMPLOYMENT OF MATERIAL FLOW
ANALYSIS IN OPTIMIZATION OF E-WASTE
MANAGEMENT SYSTEMS
Inga Gurauskienė,
Žaneta Stasiškienė
Kaunas University of Technology, Lithuania
ABSTRACT
Waste of electrical and electronic equipment (e-waste) is the outcome of the technological progress in electronic industry determining the exponential growth in amount and variety of the electrical and electronic products (EEE), the growth of economical welfare and unsustainable consumption. E-waste management systems (MS), implemented in the EU countries are not able to cope with the e-waste problem properly, especially in the new EU member countries. The best case scenarios of e-waste MSs from advanced countries could not be transposed directly to the countries behind the requirements of efficiency. The analysis of particular e-waste MS is essential for evaluation of its complexity and peculiarity.
The aim of this paper is to represent the research of agent based material flow analysis (MFA) in the e-waste MS, as the measure to reveal the potential points for improvement. MFA was performed as a flow of goods (EEE).
The case study of MFA employment for the Lithuanian e-waste MS represents the following benefit: 1) estimation of the real EEE flows, including amounts of e-waste generated; 2) detection of the roots of inefficiency; 3) starting point to perform structural selection of relevant impact factors determining the current operation of the system. The study demonstrates that agent based EEE flow analysis incorporating life cycle thinking approach for the national e-waste MS gives a broader view to the system than the administrative system used to cover. Therefore employment of EEE flow analysis is useful for improvement of the e-waste MS.
KEYWORDS
Electrical and electronic equipment waste (e-waste); Material flow analysis; e-waste management system; improvement.
1 INTRODUCTION
Rapid technology change, tremendous growth in production of electrical and electronic equipment (EEE) products, low initial costs have resulted in a fast-growing surplus of electrical and electronic equipment waste (e-waste) all over the world [1, 2]. E-waste is one of the fastest growing waste fractions [3]. Currently e-waste constitutes 1% of municipal waste in the US [4] and 4% in the EU [5]. E-waste MSs having been implemented according the requirements of legislation (EU Directive 2002/96/EC on waste electrical and electronic https://doi.org/10.15626/Eco-Tech.2010.054
equipment (WEEE)) in the EU member states are not efficient enough according to the data on e-waste collection rates which differs a lot between EU member countries (from 1 to 12 kg for person per year). The implementation of the WEEE Directive in the EU has intention to increase the rate of recycling. Most of the e-waste MSs tend to promote the recycling – producers are concerned about the collection rates, not about the prevention and education of consumers. Hence recycling is not of the highest priority by the waste hierarchy, accordingly it should be complimented by preventive measures (eco-design [6], extended producer responsibility and etc.), which could resolve the issues associated with the current level of existing and potential e-waste generation [7].
The data observed in e-waste MSs are concerned with the inflow of the obsolete EEE collected for recycling, discounting the contribution of illegal EEE supply and possible alternative e-waste disposal actions. Underestimating the alternative e-waste flows a great gap emerges between the amounts of e-waste generated and the share of e-waste that is collected separately for appropriate disposal or recycling [8]. Therefore the analysis of EEE flows within the e-waste MS is essential trying to find out the reasons of inefficiency and making the solutions how to tackle with the detected problems. The old management adage “you can’t manage what you don’t measure” is proved at the e-waste MS as well.
Material flow analysis (MFA) [3] method is widely recognized as one important and necessary step for reducing the impact of human on the environment [4, 5]. It has been applied in various human-environment systems like waste systems on purpose to assess different waste management measures ecologically and economically [6-8], evaluate the usefulness of waste as raw materials, or reveal optimization potentials to achieve policy goals more efficiently. MFA is widely used in waste management research at the substance level as the tool to trace the flows of particular materials and to manage the resource use of these materials creating closed loops in the resource consumption is relevant to e-waste MSs as well. Concerning great variety of materials EEE is compound of, it could be incomplete to manage the whole flow of e-waste according to few substances. Some studies have been made concerning the material flow of particular categories of EEE, especially information technologies (IT) [9-11] or making research on several the most popular EEE [10] [12, 13]. There is a lack of studies investigating the overall flows of e-waste [11, 13] and electronic equipment in the particular region especially incorporating the EEE flows in the life cycle (LC) stages before collection of e-waste.
E-waste is intermediate stage of the life cycle or anthropogenic stock of materials, according to the life cycle thinking approach (LCThA) [14]. E-waste recycling is environmentally preferable option [15] [16] as environmental impact of recycling is negligible as compared to the impact of primary production. Therefore the e-waste management could be handled as the material flow management, wherein the MFA is its foundation. The strategic management concept for e-waste or EEE flows in a regional context is based on the character of the flows and the agents involved in the system, making direct and indirect influence to the flows. Activities before the recycling process in e-waste MS are also significant and makes a great impact to the recycling process [17]. Employment of EEE flow analysis could trace all alternative EEE flows on purpose to avoid the inappropriate treatment of waste. Efficient e-waste management, using the LCThA [18] is the underpinning to sustainable resource management and vice versa.
The purpose of this study is to show the importance of national EEE flows’ estimation, evaluating the real efficiency of the system, the potential to increase the efficiency and to propose optimal measures the stakeholders could implement in order to obtain efficiency of e-waste MS. There is assigned a set of indicators in the study, describing the efficiency. Generally the efficiency of e-waste MS in this study is explicable according to the sustainable resource management concept: creation of closed EEE and material flows inside the system, coordinating the actions of stakeholders. The lack of reliable data about the system poses a challenge to policy makers wishing to design an e-waste management strategy and to an industry wishing to make rational investment decisions [3]. The main idea of this study – the inventory of real EEE flows and their distribution between separate stakeholders enables to choose adequate decisions for optimization of e-waste MS. According to Jain, A. [9], e-waste inventory and its future projections within a geographical area provide the basis for planning, design and implementation of e-waste management.
2 MATERIALS AND METHODS
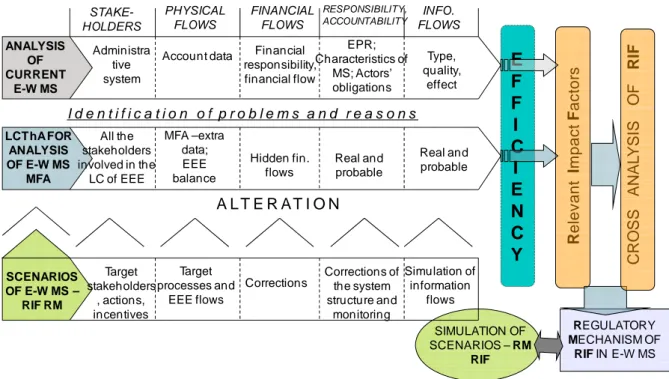
The research has been performed according to the developed model (see Figure 1) incorporating following stages: (1) Statistical analysis of current administrative e-waste MS – unfolds the strengths and weaknesses of the system; (1) MFA of e-waste MS – discloses reasons of inefficiency; (3) Efficiency assessment is performed simultaneously with the evaluations described above, in accordance with determined indicators of efficiency; (4) Investigation of relevant impact factors (RIF) of the system; (5) Cross impact analysis of RIF; (6) Identification of RIF regulatory mechanisms determining the current operation of e-waste MS; (7) Simulation of scenarios adjusting RM RIF for e-waste MS improvement; (8) Evaluation of alteration in efficiency of e-waste MS according to the scenarios.
REGULATORY MECHANISM OF RIF IN E-W MS C R O SS AN AL YSI S O F RI F R elev ant Im pac t F ac to rs STAKE-HOLDERS ANALYSIS OF CURRENT E-W MS E F F I C I E N C Y PHYSICAL FLOWS FINANCIAL FLOWS RESPONSIBILITY, ACCOUNTABILITY INFO. FLOWS LCThAFOR ANALYSIS OF E-W MS MFA SIMULATION OF SCENARIOS – RM RIF Administra tive system
Account data Financial responsibility, financial flow EPR; Characteristics of MS; Actors’ obligations Type, quality, effect All the stakeholders involved in the LC of EEE MFA –extra data; EEE balance I d e n t i f i c a t i o n o f p r o b l e m s a n d r e a s o n s Hidden fin. flows Real and probable Real and probable SCENARIOS OF E-W MS – RIF RM A L T E R A T I O N Target stakeholders , actions, incentives Target processes and EEE flows
Corrections Corrections of the system structure and
monitoring
Simulation of information
flows
Figure 1. Model for increasing of e-waste management system efficiency
All the segments of the model complement each other with the additional information and different approach at the system and evaluation of the efficiency. The aim of this
methodology is to evaluate the real efficiency of e-waste MS, using the broader approach then the administrative e-waste MSs used to practise and to identify relevant impact factors determining the current operation of e-waste MS.
This paper aims to present the first four stages mentioned above, whereas the full representation of the model could exceed the extent of scientific paper.
Using the MFA on a good level within geographical boundary, it helps to model the e-waste MS as the structured agent based system (chain) connecting different stages of the LC of EEE and associated stakeholders with the physical, information and responsibility flows between them. This methodology is based on approach of mass balance in each process (LC stage) and whole the system generally. The additional methodologies are used to gain these data: survey of the agents, modelling of the possible flows and paths, using available statistical data and empirical evaluations from literature reviews.
The activity of the agents at the MFA system is described as different kind of processes influencing the EEE flows: the activity of EEE usage and accumulation of obsolete EEE is described as the process with the stock; the processes with multiple outcomes describe possible options for the agent, defined by transfer coefficients. Flow indicator tables are created in order to indicate the overall distribution of the system flows systematically. Identification of relevant impact factors (RIF) is the outcome of the system efficiency evaluation, where the factors having the greatest influence on the operation of the system are distinguished.
2.1 System boundaries
There are distinguished two main options to describe the research area of e-waste MS: regional and life-cycle approach [19]. Regional system boundaries are used in this study, as it is mainly applicable on a national waste management level which could help to generate a simplified scheme of all the national e-waste MS. The LCThA is applied to figure the flow of EEE at all the possible stages (processes) of the LC in the area of one state. Some of the processes were constructed as the subsystems – as a set of other processes inside. It helps to investigate EEE flows within the process and to detect the sources of particular flow rate. A temporal system boundary is one year for the evaluation of annual flows. As the e-waste MSs operate since the 2005 midyear, the data of the period 2006-2008 are investigated in order to display the trend of the efficiency of e-waste MS.
2.2 Materials and data collection
MFA requires detailed data as the function of time in order to depict all the flows and distribution within different processes. The e-waste MSs implemented at the level of country generally has few monitoring points. It helps to indicate the efficiency of the system according to the legal requirements – collection targets. But it makes nothing with the efficiency and real potential of the system. These data are used for setting agent based processes system. This part of research helps to enclose the primary problems.
Second, the data have been collected in order to evaluate the current flows using MFA methodology. Primary data for this study was collected from the different sources of information: national department of statistics, environmental protection agency, literature review, survey and interviews with different stakeholders of the system. The secondary data –
evaluations (surveys) and calculations according to the proofed methodologies have been made in order to identify the data underestimated before in order to evaluate initial flow rate input/output of every process. There were used both types of flow data: absolute (flow amount) and relative (flow rate), because data on some absolute flow amount are unavailable and the data on flow rate cover it. However flow amount data were necessary to balance input and output flows in the final chart of MFA.
The data on EEE supply to the market and e-waste collection to the official e-waste treatment sector are gathered at the national level in the official statistics and monitoring data. These data are comprehensive, reflecting the amounts of EEE by the category. It is quite difficult, not time-efficient to gather the data on all EEE stock at the consumption process, so-called “indicator-appliances” (IA) are used. The main criterion for IA selection is the amount of EEE sold and the amount e-waste generated. In this study 14 types of EEE (fridge, freezer, washing machine, dishwasher, electric cooker, microwave, vacuum-cleaner, iron, personal computer, lap top, mobile phone, TV, video recorder/player, video/foto camera) [20, 21],[22], [23], [24] are chosen which correspond for 80 mass-percent for all supplied EEE to the national market and 90 mass-percent for all collected e-waste. Making the assumption that the amount of IA constitutes 90% of all the EEE in use, the total amount has been calculated. The following results of the case study also describe the total EEE flows. The average life time data and average weight of EEE were estimated according to the literature review [20, 21],[22], [23], [24].
Potential amount of e-waste is essential indicator evaluating the efficiency of the e-waste MS. The e-waste inventory and assumptions was performed using approved batch leaching method (see equation 1). Batch leaching method is widely used and is suitable having data about the stocks and average lifetime of particular EEE. It was applied by EEA (2002) [25], Kumar & Shrihari [26].
( )
( )
[
StockB C t StockB B t]
Tav t EEEw( )= 2 + 2 / (1) Where: EEEw - wasteStockB2C – stocks of EEE at the households = amount of households * EEE
penetration rate/100 = population/ average amount of residents at the household * EEE penetration rate/100
StockB2B - amount of workplaces * penetration rate/100
Tav - average lifetime of EEE
This method is also used in any of the processes to evaluate the flow rate. The real values of flows have been computed according to the flow rate (transfer coefficients) using the software.
The software for substance flow analysis STAN, designed by the scientists of Vienna University of Technology [27] was used as a tool to perform MFA and to represent the results.
2.4 Evaluation of efficiency
The evaluation of efficiency is based on qualitative and quantitative parameters, according to the different layers (stakeholders, physical flows, responsibility and etc), described in the model. The first of all the current e-waste MS is evaluated using the data observed in it; the second step was to perform MFA where more possible flows’ paths and broader spectrum of stakeholders is involved. There were designated the following indicators in order to evaluate the e-waste MS. I group of indicators (for analysis of administrative e-waste MS): (1) Stakeholders of the current e-waste MS; (2) E-waste collected/EEE supplied; (3) E-waste collected/population; (4) National collection rate; (5) Monitoring points in the e-waste MS (data sources); (6) Collection options. II group of indicators (MFA analysis): (1) Stakeholders of EEE flow system; (2) Share of single process input/stock/output from the total input/stock/output of system; (3) Alternative (informal) collection options and its share.
3 RESULTS AND DISCUSSION
3.1 Case study: Lithuanian e-waste management system
Lithuanian e-waste MS have been chosen as an example to represent the utility of MFA as a measure disclosing specific problems of particular e-waste MS and contributing for improvement of e-waste MS. Lithuania has implemented e-waste MS in 2005 according to the requirements of WEEE directive. Lithuania is one of several new EU member countries having problems with efficient implementation of EU requirements on waste treatment.
3.2 Description of the Lithuanian e-waste management system, state of the art
The inefficiency of Lithuanian e-waste MS is proved according to the reports of Environmental Agency and national statistic data. National collection rate determines the unconformity to the national and European laws requirements, also detecting the inefficiency of the created national e-waste MS. The E-waste MS in Lithuania is based on the principle of extended producer responsibility (EPR) realized as individual or collective responsibility. Current system involves the following stakeholders: producers/importers, dealers, consumers, e-waste collectors, e-waste recyclers and municipalities and governmental organizations, regulating the system. Most of the producers/importers exercise the individual responsibility (90%), while those having card-carrying with the producers/importers entities (10%) represent the greatest share of EEE market (70%).
The producers/importers are responsible for the financing of e-waste collection and recycling. The recycling targets as well as the amount of e-waste, the producers must to finance, are set by the Lithuanian Ministry of Environment. The methodology for the evaluation of national recycling tasks is based on the recycling rate of EU (4 kg/capita ann.) and population at the particular year. The national e-waste collection task is apportioned between the producers/importers as the collection rate. Consequently, the e-waste recycling differs every
year and it depends on the following variables: population; consumption rate and planned amount of EEE to be supplied.
The current system of financing has significant drawbacks making the influence for the collection rate: (1) the collection rate is related to the amount of new EEE supplied to the market, and it is directly related to the economical welfare; (2) the less EEE is supplied, the greater share producers/importers has to pay for the recycling of e-waste; (3) there is no motivation to collect more e-waste above the recycling rates.
The results of the current e-waste MS disclose the disability of the system to reach the goals of e-waste collection and recycling rates (~3kg/person/a.).There were not obtained the necessary collection rate since 2006, though the national collection rate has been fulfilled. The reason is the difference between the planned and real amounts of EEE supplied to the market. The problem arise in case when the demand decreases reducing the amount of EEE sold, and the designated e-waste collection rate is inadequate to fulfil the national requirements for the e-waste collection.
The collection system is insufficient: most of e-waste is collected at the cities, because of various collection options. Whereas the inhabitants of province have less collection points and the lack of information is identified. Therefore the great share of obsolete EEE is stored at home or disposed in inappropriate way.
The estimation made above, shows the inefficiency of the system, but the causes and the potential to reach the EU collection rate is not assessed. The paths of residual e-waste and amounts are not clarified. The obvious problem could not be resolved without the analysis of its reasons. Further the MFA is used as measure anticipating to disclose the roots of inefficiency and to define the potential of improvements.
3.3 EEE flow analysis in Lithuania
First the EEE flow chart has been defined incorporating the basic processes: EEE supply, consumption and formal e-waste treatment; and adding extra processes: supply of reusable EEE, obsolete EEE, informal e-waste treatment and landfill (see figure 1). The subsystems were set in the following processes: EEE supply, Consumption and Obsolete EEE. The import/export flows to/from the system are considered respectively as amount of EEE supplied to the market and amount of e-waste recycled in the region of analyse. The research has been explored for the period of three years: 2006 – 2008 describing the prime situation of implemented e-waste MS. The data and MFA of the 2008 have been described at this paper as indicator one.
Primarily, the results of general MFA analysis are presented, and after going further in-depth analysis the findings are disclosed. Reverse representation of the results is applied in order to unfold the significance of in-depth analysis of the e-waste MS. According to the law of mass conservation, the input to the system is equal to the output plus change in stock. The distribution of the investigated system was as follows (see Equation 2):
Input (100%) = ∆Stock (66%) + Output (34%) (2)
The distribution shows that two thirds of the input is accumulated in the system stock every year. If the equation was analysed in general, many different interpretations could be made.
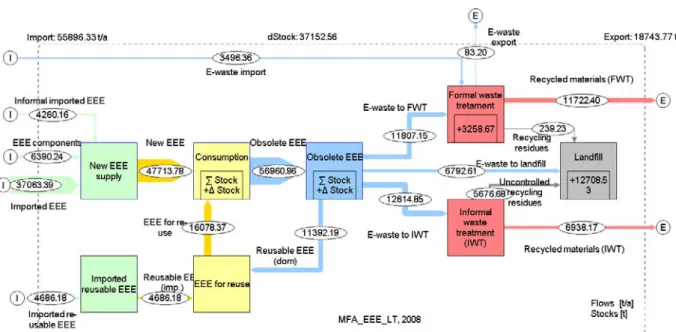
Therefore e-waste MS should be analysed in depth, investigating the relations between different processes and flows between them. The figure of MFA chart (see Figure 2) represents the main processes and flow distribution. The influence of each process to the system can be identified using graphical representation of the results as the Sankey diagram, representing the distribution of the flows (see Figure 2) and summarizing the flow rates using mass balance approach (see Table 1).
Table 1. MFA indicators of e-waste MS
Input ∆Stock Output
Process share of system Σinput share of system Σstock share of system Σinput share of system Σoutput Total 100% 66% 100% 34% 100%
Supply of new EEE 85% Supply of re-usable EEE 8% Consumption 12% 18% Obsolete EEE 25% 39% Formal WM sector 6% 6% 9% 21% 63% Informal WM sector 13% 37% Landfill 23% 34%
Figure 2. EEE flow in the regional e-waste MS
It was educed that: (1) New products consist 85% from the total system input, while the rest 8% of input is import of reusable products, and 6% constitutes the import of e-waste; (2) The “Obsolete EEE” and “Landfill” make greater contribution to the suspension of EEE flow inside the system than the “Consumption” process. Unfortunately, the increase of stock in landfill means the lost flow of EEE and resources as well. That is the primary evidence about inefficiency of e-waste collection system; (3) The investigation disclosed distribution of recyclable obsolete EEE: the share of EEE recycled in formal sector is 63%, and informal sector process – 37%. From the system point of view, accordingly 21% and 13%. The intention of the e-waste recycling system to channelize most of obsolete EEE to the formal recycling is not realized.
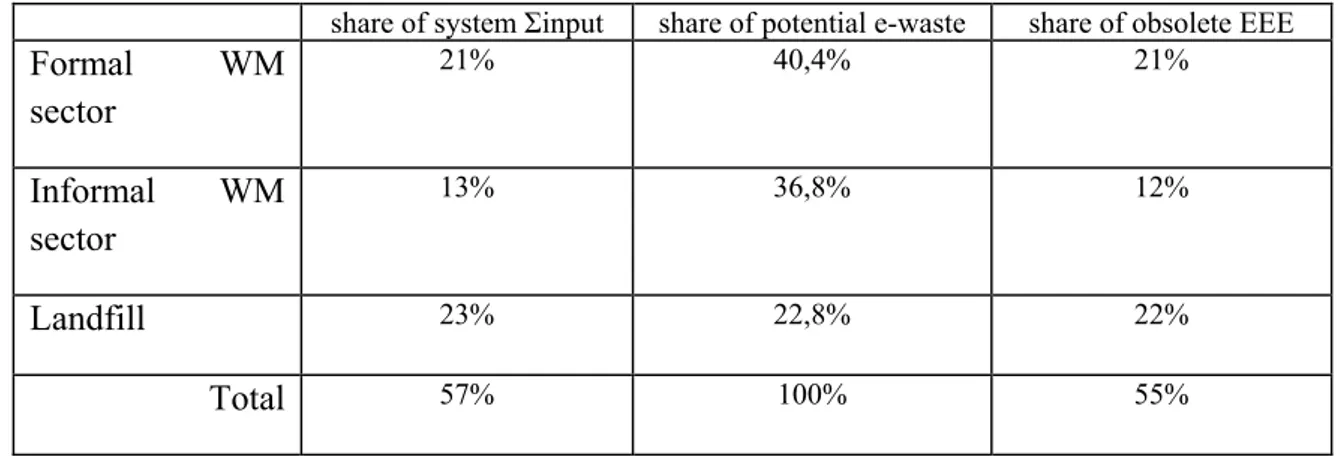
Considering the stocks in process “consumption”, storing of obsolete EEE and formal waste treatment (FWT) processes as EEE delay the potential e-waste flow at the investigative time period is the sum of landfilled, and recycled EEE (57% from all the supplied EEE). The rate of e-waste recycled at the FWT from the potential e-waste is equal to 40.4% (see Table 2).
Table 2. Evaluated amount of potential e-waste
share of system Σinput share of potential e-waste share of obsolete EEE
Formal WM sector 21% 40,4% 21% Informal WM sector 13% 36,8% 12% Landfill 23% 22,8% 22% Total 57% 100% 55%
Further the analysis in depth, describing the flows inside the processes (subsystems) is exercised in order to evaluate stakeholders’ behaviour and other possible EEE paths. There were composed subsystems and charts depicting them (they were not included in the paper for avoiding overload of the paper).
The subsystem of process “EEE supply” discloses the distribution of EEE supplied to the market from various suppliers: (1) formal EEE supply constitutes 89%, whereof 12% - from national EEE production in the EEE market; (2) 11% of new EEE comes from unidentified EEE suppliers in the Lithuanian EEE market, which are not observed at the e-waste MS. This share of producers/importers eludes the financial responsibility in e-waste MS.
The analysis of “consumption” process demonstrates: (1) the distribution of supplied EEE between household (85%) and non-household (15%) users; (2) the amount of EEE in use (stock); (3) the difference between input and output as the delta stock, representing changes of EEE amount in use, per year; (4) the potential of obsolete EEE (~57 000 t/a.): B2B – 27%, B2C – 73%. The methodology of batch leaching has been used at this stage in order to evaluate potential of obsolete EEE, on the basis of the data from the National department of statistics on penetration of IA at the consumption process (B2B and B2C). It was identified that the potential amount of obsolete EEE per household has increased from 24 kg in 2005, until 28 kg in 2008, while one habitant generates accordingly 10-12 kg of obsolete EEE per year (when the average household size - 2.47 habitants). The contribution of particular EEE is determined by the product of EEE penetration and average weight divided by the average life span. Consequently personal computer makes greater contribution to the e-waste flow than the larger equipment like fridge which is used for the longer period of time.
The process “obsolete EEE” is the most complex and complicated subsystem. That is the essential subsystem in e-waste MS, describing the behaviour of consumers and disclosing the causes of current efficiency of the collection system. According to the questionnaires 28% of the users are used to store obsolete EEE as the valuable stuff. It was estimated that the leaching from this process is 10%, estimating the average period of store – 10 years. EEE retired from the primary use is donated or sold for other users personally; therefore it is not accounted at the national statistics. According to the market research and the questioners, 20% of EEE is reused – the closed loop is created between the processes “Consumption” and “Obsolete EEE”. The rest amount of EEE is equal to the amount of e-waste generated per
year. As the amount of e-waste collected at the formal e-waste treatment sector is known (it constitutes 21%), the rest amount of e-waste generated is distributed as follows: (1) 22% for illegal e-waste treatment sector – it is collected by informal collectors and developers, as well as picked off from municipal mixed waste by poor people as the source of metals; (2) 12% for the landfills. Assuming that the poor people pick of the largest equipment for dismantling, half of that amount is directed to the illegal treatment.
3.4 Identification of relevant impact factors
The following characteristics of e-waste MS identified in the study are as a groundwork for identification of relevant impact factors (IF):
– The real amount of e-waste generated per year is 3 times above the collected at the FWT. The main reason – e-waste disposal alternatives, the consumers are used to exercise. – There is no formal reuse market in Lithuania. The informal market of reusable EEE could
lead to the leaching of EEE to informal EEE treatment.
– The behaviour of consumer to put a value to the obsolete EEE, suspend one third of obsolete EEE flow. That is conditioned by the attitude of consumer and the lack of information about possible e-waste treatment options.
– The great share of e-waste at the landfills indicates the immaturity of separate waste collection system.
– Unaccountable share of supplied EEE flow influence the amount of e-waste to be recycled. It is difficult to quantify the second hand EEE supply as well; therefore the need for additional monitoring points is unclosed. These data are essential in order to evaluate the potential to implementation of preventive environmental measures at the production stage.
– There is no relevancy between amount of EEE supplied and e-waste collected in Lithuanian e-waste MS in the time period 2005 – 2008. It shows inefficiency of MS, where the collection rate is the main driver and limit growth in collection.
– There were not detected reverse flows of recycled materials or dismantled EEE inside the national EEE flow system. All the e-waste collected at the FWT sector is recycled to the secondary materials for export market.
As the waste management systems are composed of interacting socioeconomical, environmental and technological aspects, four categories of impact factors have been distinguished in order to reflect all the mentioned aspects in the systematic analysis of e-waste MS: (1) physical flow characteristics; (2) stakeholders; (3) driving factors; (4) limiting factors. The first IF category corresponds to MFA indicators and it represents the results of EEE flow analyses. The second group of IF include all the stakeholder having the influence on the EEE flows. Driving factors – includes aspects initiating or maintaining the operation of e-waste MS. Limiting factors define the technological, financial or behaviour boundaries for the efficient operation of the system.
The future research is supposed to be made deeper on the analysis of relevant IFs and their regulatory mechanisms in order to coordinate the actions of each stakeholder of the system, despite the individual measures implemented by them. The cooperation is essential in order to coordinate the complex economical environmental and social system of e-waste management.
The problems and relevant IFs identified at this paper are as the initial point for improvements. Quantitative data on the material flows condition the development of improvement strategies. The expansion of e-waste MS to the national EEE flow system, using MFA allowed identifying and quantifying the system strengths and weaknesses, disclosing the possible causes. The MFA enabled to detect the relevant IFs of the system which are the core regulators of the system. Therefore the particular measures for e-waste MS improvement should be pointed on them after deeper analysis of their interactions. The results of the study depicted the following advantages of MFA in evaluation of e-waste MS: detection of all the relevant stakeholders and processes; identification of EEE flow distribution; assessment of the quality of the available data and the identification of gaps in the data. The MFA is requisite for evaluation of the e-waste MS and initial point for improvements.
REFERENCES
[1] Robinson, B.H., E-waste: An assessment of global production and environmental impacts. Science of The Total Environment, 2009. 408(2): p. 183-191.
[2] Røpke, I., New technology in everyday life - social processes and environmental impact. Ecological Economics, 2001. 38(3): p. 403-422.
[3] Brunner PH and R. H., Practical Handbook of Material Flow Analysis (Advanced Methods in Resource & Waste Management). 2004: Lewis Publishers.
[4] Binder, C.R., From material flow analysis to material flow management Part II: the role of structural agent analysis. Journal of Cleaner Production, 2007. 15(17): p. 1605-1617.
[5] Binder, C.R., From material flow analysis to material flow management Part I: social sciences modeling approaches coupled to MFA. Journal of Cleaner Production, 2007. 15(17): p. 1596-1604.
[6] DoBerl, G., et al., Long-term assessment of waste management options - a new, integrated and goal-oriented approach. Waste Management Research, 2002. 20(4): p. 311-327.
[7] Streicher-Porte, M., et al., Material flow and economic analysis as a suitable tool for system analysis under the constraints of poor data availability and quality in emerging economies. Clean Technologies and Environmental Policy, 2007. 9(4): p. 325-345. [8] Truttmann, N. and H. Rechberger, Contribution to resource conservation by reuse of
electrical and electronic household appliances. Resources, Conservation and Recycling, 2006. 48(3): p. 249-262.
[9] Kang, H.-Y. and J.M. Schoenung, Estimation of future outflows and infrastructure needed to recycle personal computer systems in California. Journal of Hazardous Materials, 2006. 137(2): p. 1165-1174.
[10] Nnorom, I.C. and O. Osibanjo, Electronic waste (e-waste): Material flows and management practices in Nigeria. Waste Management, 2008. 28(8): p. 1472-1479. [11] Yoshida, A., T. Tasaki, and A. Terazono, Material flow analysis of used personal
computers in Japan. Waste Management, 2009. 29(5): p. 1602-1614.
[12] Oguchi, M., et al., Product flow analysis of various consumer durables in Japan. Resources, Conservation and Recycling, 2008. 52(3): p. 463-480.
[13] Yang, J., B. Lu, and C. Xu, WEEE flow and mitigating measures in China. Waste Management, 2008. 28(9): p. 1589-1597.
[14] Korhonen, J., Special issue of the Journal of Cleaner Production, [`]From Material Flow Analysis to Material Flow Management': strategic sustainability management on a principle level. Journal of Cleaner Production, 2007. 15(17): p. 1585-1595.
[15] Huisman, J., C.B. Boks, and A.L.N. Stevels, Quotes for environmentally weighted recyclability (QWERTY): Concept of describing product recyclability in terms of environmental value. International Journal of Production Research, 2003. 41(16): p. 3649-3665.
[16] Hischier, R., P. Wäger, and J. Gauglhofer, Does WEEE recycling make sense from an environmental perspective?: The environmental impacts of the Swiss take-back and recycling systems for waste electrical and electronic equipment (WEEE). Environmental Impact Assessment Review, 2005. 25(5): p. 525-539.
[17] Staniskis, J. and Z. Stasiskiene, An integrated approach to environmental education and research: a case study. Clean Technologies and Environmental Policy, 2006. 8(1): p. 49-58.
[18] Miliute, J. and J.K. Staniskis, Application of life-cycle assessment in optimisation of municipal waste management systems: the case of Lithuania. Waste Management Research, 2010. 28(4): p. 298-308.
[19] Chancerel, P., Substance flow analysis of the recycling of small waste electrical and electronic equipment - An assessment of the recovery of gold and palladium, in Institut für Technischen Umweltschutz. 2009, Technische Universität Berlin: Berlin, Germany. p. 162.
[20] Betts, K., Producing usable materials from e-waste. Environmental Science & Technology, 2008. 42(18): p. 6782-6783.
[21] Cobbing, M., Toxic Tech: Not in Our Backyard. Uncovering the Hidden Flows of e-waste. Report from Greenpeace International. 2008: Amsterdam.
[22] Huisman, J., Magalini, F., Kuehr, R., Maurer, C., Delgado, C., Artim, E. Stevels, A.L.N.,, 2008 Review of Directive 2002/96 on Waste Electrical and Electronic Equipment (WEEE), in Final Report. 2008, United Nations University: Bonn, Germany.
[23] Laffely, J., Assessing cost implications of applying best e-waste recovery practices in a manual disassembly material recovery facility in Cape Town, South Africa, using process-based cost modelling. 2007, EPFL / Empa: Lausanne / St.Gallen Switzerland. [24] Kunzler, B., Elektronikschrott in der Schweiz 2001. 2001.
[25] EEA, Waste from electrical and electronic equipment (WEEE) – Quantities, dangerous substances and treatment methods., E.E. Agency, Editor. 2002: Copenhagen.
[26] Kumar, P. and S. Shrihari. Estimation and Material Flow Analysis of Waste Electrical and Electronic Equipment (WEEE) - A Case Study of Mangalore City, Karnataka, India. in International Conference on Sustainable Solid Waste Management. 2007. Chennai, India.
[27] TU-Vienna. STAN - Software for Substance Flow Analysis. Available from: