*
DiVA
http://uu.diva-portal.orgThis is an author produced version of a paper published in Journal of
Evolutionary Biology. This paper has been peer-reviewed but does not
include the final publisher proof-corrections or journal pagination.
Citation for the published paper:
Abbott, Jessica K.; Stéphanie Bedhomme; Adam K. Chippendale ”Sexual conflict in wing size and shape in Drosophila melanogaster" Journal of Evolutionary Biology, 2010, Vol. 23, Issue: 9, pp. 1989-1997 http://dx.doi.org/10.1111/j.1420-9101.2010.02064.x
Sexual conflict in wing size and shape in Drosophila melanogaster
By Jessica K. Abbott1,2*, Stéphanie Bedhomme1,3, and Adam K. Chippindale1
1. Department of Biology Queen‟s University Kingston, Ont. K7L 3N6 Canada 2. Current address:
Department of Animal Ecology Evolutionary Biology Centre (EBC) Uppsala University
Norbyvägen 18D
SE-752 36 Uppsala, Sweden Email: jessica.abbott@ebc.uu.se Phone: +46 18 471 2938
Fax: +46 18 471 6484 3. Current address:
Evolutionary Systems Virology Group
Instituto de Biología Molecular y Celular de Plantas (CSIC-UPV) Campus UPV, CPI 8E, lab. 3.0.4
Ingeniero Fausto Elio s/n, 46022 València, Spain *author for correspondence
ABSTRACT 1
Intralocus sexual conflict occurs when opposing selection pressures operate on loci expressed 2
in both sexes, constraining the evolution of sexual dimorphism and displacing one or both 3
sexes from their optimum. We eliminated intralocus conflict in Drosophila melanogaster by 4
limiting transmission of all major chromosomes to males, thereby allowing them to win the 5
intersexual tug-of-war. Here we show that this male-limited (ML) evolution treatment led to 6
the evolution (in both sexes) of masculinized wing morphology, body size, growth rate, wing 7
loading, and allometry. In addition to more male-like size and shape, ML evolution resulted in 8
an increase in developmental stability for males. However females expressing ML 9
chromosomes were less developmentally stable, suggesting that being ontogenetically more 10
male-like was disruptive to development. We suggest that sexual selection over size and 11
shape of the imago may therefore explain the persistence of substantial genetic variation in 12
these characters and the ontogenetic processes underlying them. 13
14
Keywords: intralocus sexual conflict, ontogenetic sexual conflict, Drosophila melanogaster, 15
geometric morphometrics, sexual size dimorphism, experimental evolution 16
INTRODUCTION 18
19
The existence of sexual dimorphism is, in and of itself, evidence that the two sexes have had a 20
history of disruptive selection. Recently it has been suggested that constraints on the evolution 21
of sexual dimorphism as a result of genetic correlations between the sexes may impose a 22
substantial load on the fitness of one or both sexes (Prasad et al. 2007; Rice 1984). This 23
„gender load‟ may sometimes be detectable as a negative intersexual genetic correlation for 24
fitness, and evidence for such a pattern of covariation across the sexes has accumulated in the 25
last decade in a variety of sexual organisms in both the laboratory and the field (reviewed in 26
Bonduriansky & Chenoweth 2009; and Cox & Calsbeek 2009). Nonetheless, intralocus sexual 27
conflict is, and will probably always be, difficult to measure because of: (1) the composite 28
nature of fitness and the virtual certainty of an admixture of trait-specific intersexual genetic 29
correlations affecting it; (2) the fact that maintenance of sexually antagonistic genetic 30
variation requires specific, locus-dependent (i.e. autosomal or sex-linked) relationships 31
between the selection coefficients on males and females; and (3) a variety of environmental 32
and genetic factors which will tend to make intersexual correlations positive (Bonduriansky & 33
Chenoweth 2009; Cox & Calsbeek 2009). 34
35
One way to observe intralocus sexual conflict as an evolutionary force is to manipulate the 36
relative intensity of selection on the two sexes. We followed the approach of Rice (1996) to 37
eliminate female gene expression in D. melanogaster by limiting virtually the entire genome 38
(all but the dot chromosome IV; <1% of the genome) to males. Under this male-limited (ML) 39
experimental evolution scheme, the X-chromosome and both the major autosomes behave like 40
a single large Y-chromosome in that they are transferred from father to son and are never 41
expressed in females. This lets us harness the genome-wide power of many loci to augment 42
the benefits of sex-limitation, and allows loci polymorphic for male-benefit / female-43
detriment alleles to be positively selected. After a number of generations of ML evolution, 44
the ML-selected chromosomes can then be expressed in both males and females in order to 45
test their effects in a standardized genetic background. ML evolution should generate 46
populations approaching the best masculine phenotypes available from that fraction of the 47
standing variation in the ancestral populations. In accordance with the predictions from 48
intralocus sexual conflict, it has previously been found that release from selection upon 49
female function led to a burst of male-specific adaptation: the fitness of males increased and 50
the fitness of females inheriting ML genotypes decreased (Prasad et al. 2007). These evolved 51
fitness differences were accompanied by phenotypic shifts towards the male optimum 52
(inferred from the direction of extant sexual dimorphism) in developmental time and body 53
size (Prasad et al. 2007). Gains in male fitness were mediated by increased attractiveness and 54
mating success (Bedhomme et al. 2008) and not by postcopulatory sexual selection (S. 55
Bedhomme, unpublished data), therefore directing our attention to aspects of behaviour and 56
the physical phenotype related to courtship and mating. 57
58
Because ML evolution resulted in a shift towards the male optimum for previously studied 59
traits, this method should be useful for studying other traits exhibiting substantial sexual 60
dimorphism in Drosophila, such as body size. Unlike vertebrates, sexual size dimorphism 61
(SSD) in which females are larger than males is the rule rather than the exception in the 62
Arthropoda, and is proximately explained by differences in growth rate rather than 63
development time (Blanckenhorn et al. 2007). The main hypotheses offered to explain this 64
pattern are fecundity selection in females, female anautogeny (where females must feed 65
before oviposition, Blanckenhorn et al. 2007), selection for protandry (Maklakov et al. 2004), 66
and a higher cost of production of male gonadal tissue (Miller & Pitnick 2003). A fifth 67
hypothesis has occasionally been advanced, connecting small male size to direct benefits 68
accruing from sexual selection, such as mate-finding (Brandt & Andrade 2007). Drosophila 69
melanogaster displays the typical arthropod pattern for SSD, but more strikingly, males are
70
not only smaller than females, but also take longer to mature, making them substantially 71
slower-growing (Blanckenhorn et al. 2007). There is evidence that fitness is positively 72
associated with locomotor activity in males, and that this is a sexually antagonistic trait, with 73
more active females experiencing reduced fitness (Long & Rice 2007). One potential 74
explanation for this result is that smaller males excel in chasing, harassment, or courtship 75
displays involving speed or agility, but their daughters inherit only the negative effects of 76
small size on fertility. A second related hypothesis is that while females benefit from rapid 77
growth in terms of fertility selection, males benefit from slower growth because it promotes 78
higher ontogenetic fidelity and resulting morphological quality. This latter „selection for 79
perfection‟ model (Chippindale et al. 2003), suggests that the risks of rapid growth are not 80
just those associated with increased feeding rate and exposure to predators, but also risks 81
associated with developmental accidents. In this model, the risks associated with rapid 82
growth are outweighed by the benefits for females, but not for males, since male fitness may 83
be substantially negatively impacted by developmental accidents that render them further 84
from the optimal size or shape, and/or more asymmetrical. 85
86
Developmental stability is the ability of an organism to buffer its phenotype against genetic or 87
environmental disturbances encountered during development and is usually measured as the 88
inverse of the mean fluctuating asymmetry (FA, Clarke 1998). The selection for perfection 89
model predicts that this sort of developmental buffering should be more important for males 90
than for females. More specifically, in the context of the male-limited (ML) evolution 91
experiment, we expect that ML males will (1) be more symmetrical than Control males and 92
that (2) evolve to be closer to the male phenotypic optimum inferred from extant sexual 93
dimorphism in size and shape (i.e. have smaller wings which are more masculine in shape). 94
To investigate these hypotheses, we carried out a geometric morphometric analysis of wing 95
morphology. Wing morphology was chosen as an appropriate trait to measure when looking 96
for evidence of intralocus sexual conflict since it is known to be subject to sexual selection in 97
males (Taylor & Kekic 1988) and lends itself well to landmark-based methods (Klingenberg 98
& McIntyre 1998) and fluctuating asymmetry analysis (Breuker et al. 2006; Palmer 1994; 99
Palmer & Strobeck 2002). 100
101
METHODS 102
103
We expressed ML and Control (C) haploid genomes („hemiclones‟ consisting of the major 104
autosomes and the X chromosome) from 4 replicate lines in both sexes after 82 generations of 105
experimental ML evolution (Prasad et al. 2007). We assayed fitness and investigated 106
intralocus sexual conflict and developmental stability in wing morphology. For more details 107
about ML evolution and the production of flies for fitness and morphological measurements, 108
please see Supplementary Information. 109
110
Female fitness was measured as follows: females were isolated as virgins and housed in 111
groups of 10 along with five competitor females from a replica of the base stock (LHM) 112
homozygous for the relatively benign recessive scarlet eye marker (called LHst) and were 113
provided with 10 mg of yeast/vial. On day 12 post egg-lay, females were combined with 20 114
males from LHst for 18 h, after which they were separated from the males and the ML females 115
were allowed to oviposit for 20 h (LHst females were discarded). The progeny eclosing from 116
these vials were counted 12 days later. Female fitness was therefore measured as total 117
number of adult offspring produced after competition for a limited resource (yeast). Fifteen 118
such vials were set up per population, and final sample size was 119 vials. 119
120
To measure male fitness, males were harvested 11 days post-oviposition. Ten males from ML 121
(or C) populations were combined with 10 males from LHst population. Fifteen such vials 122
were set up per population. On day 12 post egg lay, males were combined with 15 virgin 123
clone-generator females and allowed to interact for 18 h after which the females were 124
separated from the males and allowed to oviposit for 18 h. The progeny from the two types of 125
males can be distinguished because of their eye color. Twelve days later, the fraction of 126
progeny sired by the focal males (ML or C) within each vial was scored, and this proportion 127
was used as a fitness measure. Fifteen such vials were set up per population, and final sample 128
size was 115 vials. 129
130
Male and female fitness were measured in different currency. In order to be able to include 131
the two fitness measures in a same analysis, we calculated mean values for each sex within 132
each replicate population (ML and C values pooled), and then divided the values for each 133
sample by the appropriate mean in order to get sex-specific relative fitness values. Mean 134
relative fitness values for each combination of sex, replicate population, and selection regime 135
were calculated (N=16) and then were analyzed using a factorial ANOVA in JMP, with sex 136
(M or F), selection regime (C or ML), and their interaction (sex*sel) as fixed factors. 137
138
Individuals slated for morphological analysis were frozen and stored individually in 139
eppendorf tubes at -20°C until they could be processed. Wings were mounted by hand on 140
glass microscope slides using double-sided tape. Sample size was 965 individual flies 141
(between 48 and 73 per population/sex/selection regime). After wing removal, flies were 142
dried for at least 24 hours in a 65°C drying oven before being individually weighed to the 143
nearest 0.0001 g on a Cahn C-31 microbalance. Eleven landmarks were selected for 144
geometric morphometric analysis (Figure 1A). These landmarks are similar to those used in 145
other studies of wing morphology (Breuker et al. 2006; Gidaszewski et al. 2009). However 146
some landmarks on the proximal part of the wing that have been used in previous studies were 147
not included here as it was sometimes difficult to remove the wing without damaging this 148
area. Wings were photographed and digitized twice (non-successively) to account for error 149
due to distortion by camera/microscope lenses and variation in the placement of landmarks 150
(Klingenberg & McIntyre 1998). Unfortunately it was not possible to entirely control for 151
error caused by the mounting process, but individuals with wings that were damaged or 152
creased in any way were excluded from the analysis. Also, because wings were mounted and 153
digitized in a random order, improvements in mounting/digitizing technique over time cannot 154
be the cause of any systematic differences between groups. Geometric morphometric analysis 155
(digitization of landmarks, procrustes superimposition, relative warp analysis, and 156
visualization of shape differences) was carried out in the tps suite of programs by F. James 157
Rohlf (tpsUtil, tpsDig, tpsRelw, tpsRegr and tpsSplin) which are freely available at 158
http://life.bio.sunysb.edu/morph/. 159
160
Centroid size was used as a measure of wing size, and wing shape was analysed using relative 161
warp scores (details below). Note that centroid size, despite being a linear measure, is very 162
highly correlated with wing area (r = 0.99, P < 0.0001) for this dataset. Wing loading was 163
calculated as dry mass/wing centroid size, and allometric slopes were obtained by regressing 164
wing size on body mass for each combination of sex, replicate population, and selection 165
regime. Because previous results found differences in body mass between ML and Control 166
flies (Prasad et al. 2007) we were interested in investigating allometric slopes to see if 167
differences in wing size could simply be attributed to the evolution of differences in body 168
size. 169
170
Developmental stability in wing size was examined using fluctuating asymmetry (FA) 171
analysis (Palmer 1994; Palmer & Strobeck 2002). Because male and female Drosophila 172
melanogaster differ substantially in size, size-standardized wing size asymmetry values were
173
calculated via ln(R)-ln(L) (Palmer & Strobeck 2002). We carried out analysis on both 174
standardized data (i.e. using ln(R)-ln(L) values) and raw data (i.e. using raw size and shape 175
values), but since results were qualitatively similar for both datasets, only the standardized 176
analysis is presented in detail here. Before any tests of wing size FA were performed, an 177
ANOVA was carried out to quantify and test the different components of asymmetry: error, 178
FA, and directional asymmetry (DA; see Palmer & Strobeck 2002 for details). FA was large 179
relative to error variance and therefore significant (F964, 1394 = 8034, P < 0.0001), and although 180
there was significant DA (F1, 1394 = 63.77, P < 0.0001), this was probably mostly due to the 181
large size of the dataset (Palmer & Strobeck 2002). The side*wing size effect was very small 182
(Cohen‟s d = 0.0194), indicating that DA was much smaller than the average deviation around 183
the mean. It was therefore not deemed necessary to correct for DA (Palmer & Strobeck 184
2002). Signed asymmetry values were normally distributed. Mean absolute asymmetry 185
values for each combination of sex, replicate population, and selection regime were calculated 186
(N=16) and then were analyzed using a factorial ANOVA in JMP, with sex (M or F), 187
selection regime (C or ML), and their interaction (sex*sel) as fixed factors (this is equivalent 188
to Levene's test; Palmer & Strobeck 2002). 189
190
Similarly, mean values for each combination of sex, replicate population, and selection 191
regime were calculated (N=16) for all other univariate traits (wing size, wing loading, body 192
mass, allometry, and fitness) and then were analyzed using a factorial ANOVA in JMP, with 193
sex (M or F), selection regime (C or ML), and their interaction (sex*sel) as fixed factors. 194
This design is the same as that used for a previous analysis of data from these populations 195
(Prasad et al. 2007). The mean values used in the analysis of univariate traits are reported in 196
Supplementary table S1. For the analysis of wing shape, we carried out a MANCOVA 197
analysis of a similar design, but with centroid size included as a covariate to control for 198
allometry. Because the MANCOVA was performed on mean values there were too few 199
degrees of freedom to calculate standard multivariate statistics for this analysis when carried 200
out on the matrix of all partial warps plus the uniform component. We therefore analysed 201
shape using relative warps (i.e. principal components of shape), and included as many in the 202
model as possible, under the constraints provided by the limited number of degrees of 203
freedom. We were able to include the first 11 relative warps (of 18) as dependent variables in 204
the model, which explained over 95% of the variation in shape in our dataset. 205
206
RESULTS 207
208
We found evidence of phenotypic masculinization as a result of ML-evolution for all 209
univariate traits. Males had smaller wings than females (Table 1A, Figure 2A), lower body 210
mass (Table S2A, Figure S1A), and lower wing loading (Table S2B, Figure S1B), and parallel 211
changes were seen as a result of ML evolution such that ML individuals of both sexes had 212
smaller wings (Table 1A, Figure 2A), lower body mass (Table S2A, Figure S1A), and lower 213
wing loading (Table S2B, Figure S1B) than Controls. The difference between the sexes in the 214
allometric relationship between wing size and body mass was not significant, but the change 215
in this relationship as a result of ML-evolution was still in the direction of extant sexual 216
dimorphism (Table 1B, Figure 2B), mostly due to an increase in slope in ML females. There 217
were no significant sex*sel interactions for any of these traits, indicating that the degree of 218
sexual dimorphism was unchanged as a result of ML evolution. 219
220
Both the sexes and the selection treatments differed in wing shape (Table 2), and qualitatively 221
similar patterns of phenotypic masculinization appeared to have been achieved via different 222
evolutionary pathways. In males, the size of the proximal part of the wing was reduced and 223
the distal part was increased relative to females (Figure 1B). A similar pattern of reduction of 224
the proximal part of the wing and increase of the distal part was seen in ML individuals 225
relative to Controls (Figure 1C), but this general result was achieved via a different pattern of 226
displacement of wing vein intersections compared to the difference due to sexual dimorphism. 227
Again, there was no indication of any change in the degree of sexual dimorphism in shape for 228
ML individuals. This means that although the visualization in Figure 1C was calculated using 229
pooled data from both sexes, the pattern is the same even if the sexes are plotted separately 230
(consistent with the non-significant sex*selection interaction term in Table 2). 231
232
We also found increased fitness in ML males, and decreased fitness of females carrying ML-233
evolved chromosomes, consistent with earlier results from this system (Prasad et al. 2007; 234
Table 1C, Figure 2C). Interestingly, there was a significant sex*selection interaction effect in 235
FA (Table 1D): the rank order of ML and C groups switched between the sexes (Figure 2D) 236
such that ML males had lower FA than C males, while the opposite was true for females. 237
This pattern paralleled the changes seen in fitness (Figure 2C) rather than size (Figure 2A). 238
ML-expressing males were more symmetrical for wing size than Control males were, 239
however females showed decreased developmental stability (higher size FA) when they 240
carried ML chromosomes, despite being smaller than control females (Figure 2A, Table 1). 241
DISCUSSION 243
244
We reproduce the earlier result that male-limited (ML) selection leads to increased total 245
fitness of males, and decreased fitness of females experimentally expressing ML 246
chromosomes. We also found support for our two specific predictions about the evolution of 247
size and wing morphology. First, ML males were indeed more symmetrical than C males, 248
reflecting higher developmental stability. Second, we found that ML evolution proceeded in 249
the direction of extant sexual dimorphism for all univariate traits, and that wing shape 250
evolution evolved in a manner qualitatively similar to the direction of sexual dimorphism. 251
However the change in wing shape as a result of ML evolution was achieved through a 252
different pattern of displacement of wing vein intersections relative to the difference in shape 253
between males and females. These results suggest that the average male in the ancestor or 254
control populations is displaced from the optimal phenotype, presumably by counter-selection 255
in females since evolution in wing morphology occurred once selection on females was 256
removed. Hence, although the effects of selection regime were still generally smaller than sex 257
differences, we saw morphological evidence for a gender load resulting from intralocus sexual 258
conflict. 259
260
Results on allometric relationship between wing size and body mass suggest both that a 261
number of inter-related aspects of the developmental program have changed as a result of ML 262
evolution, and that a reduction in body size is not the proximal explanation for the evolution 263
of smaller wings in ML individuals. Our results also provide further experimental evidence 264
that intersexual genetic correlations for wing size/shape and body mass traits must be high, 265
since there was no change in the degree of sexual size dimorphism as a result of ML evolution 266
for these traits (no significant sex*sel interactions, Table 1A-B, Table 2, and Table S2A-B). 267
This is consistent with previous research on Drosophila melanogaster which has shown that 268
intersexual genetic correlations for wing and body size traits generally range from 0.6 to 1 269
(Cowley & Atchley 1988; Cowley et al. 1986; Karan et al. 2000; Karan et al. 1999; Reeve & 270
Fairbairn 1996), with a mean around 0.8 (Poissant et al. 2009, supplementary information). 271
272
Previous analysis of wing shape in a number of Drosophila species suggests that wing 273
morphology is relatively evolutionarily labile (Gidaszewski et al. 2009), and this is consistent 274
with our results since differences in wing size, wing shape, wing loading, and allometry 275
evolved on a short time scale. However the lack of change of the degree of wing shape 276
dimorphism as a result of ML evolution suggests that intersexual genetic correlations for 277
shape are high. Shape changes should therefore evolve much more readily as a result of 278
sexually congruent selection than as a result of sexually antagonistic selection. Wing loading 279
is a trait which exhibits both plastic and genetic variation (Frazier et al. 2008; Gilchrist & 280
Huey 2004; Powell et al. 2010), so the observed change in wing loading on a short time scale 281
seen here is consistent with previous results but is (to our knowledge) novel in detecting 282
changes in wing loading due to sexual selection rather than ecological adaptation. The wing 283
shape results also suggest that a functionally similar result (i.e. a decrease in the area of the 284
proximal part of the wing and increase in the area of the distal part of the wing) has been 285
achieved via different ontogenetic pathways. This is consistent with previous results for wing 286
size evolution in Drosophila, where analogous clines in wing size are found in European and 287
North American populations, but the clines are a result of size increases in different portions 288
of the wing on each continent (Gilchrist et al. 2001). Similarly, differences in wing size can 289
be a result of either differences in cell size or in cell number, and contrasting patterns have 290
been found in natural populations (James et al. 1995) and as a result of selection experiments 291
(Partridge et al. 1994). There do not seem to be strong constraints on the evolution of wing 292
morphology in Drosophila (Gidaszewski et al. 2009; Mezey & Houle 2005), so these 293
examples of functionally similar trait values achieved in different ways (both from previous 294
research and from our own results) are probably the result of differences in time scale. 295
Divergence on short time scales (i.e. in the laboratory or in new environments) should 296
proceed in the direction of the most readily available genetic variation (that is, along 297
evolutionary lines of least resistance, Schluter 1996) while divergence on longer 298
(evolutionary) time scales should result in optimization of trait values. 299
300
Our results also raise several important questions about the genetic basis of developmental 301
stability, as well as potential causal relationships between FA and fitness. Stressful conditions 302
can increase fluctuating asymmetry (Parsons 1992; Santos et al. 2006; Soto et al. 2008), so 303
the increase in wing size FA in ML females is consistent with the idea that phenotypic 304
masculinization is stressful for females. An alternative explanation for increased FA in 305
females would be that the ML treatment alters the mutation-selection balance in populations, 306
so that females are free to accumulate mutations at female sex-limited loci. This would make 307
reduced fitness and increased FA a by-product of mutation accumulation at female-specific 308
loci. While we cannot discount this hypothesis outright, only a small proportion of loci are 309
expected to be female limited (Parisi et al. 2003), and a previous analysis of the effects of 310
sex-specific selection indicated that most of the decline in the unselected sex could be 311
attributed to a combination of sexually antagonistic loci and mutations that were deleterious 312
in both sexes (Morrow et al. 2008). The consistency of results across independent replicate 313
populations also argues against mutation accumulation at female-limited and female-biased 314
loci as the sole explanation for a reduction in female fitness under ML, although it certainly 315
may have played a role. Similarly, although the ML-evolution laboratory protocol does not 316
preclude adaptation to the Y-chromosome and the translocated chromosomes 2 and 3 found in 317
the clone generator females (see Supplementary Information for more details), such 318
adaptation would not explain the sex-specific nature of the fitness and FA results. The 319
selection for perfection model suggests that males should be selected for increased 320
developmental stability relative to females, but other studies have found higher FA in males 321
in a number of different taxa (Bonduriansky 2009; Breuker et al. 2007; Davis & Grosse 2008; 322
Söderman et al. 2006; Vishalakshi & Singh 2006), and mean male wing size FA was indeed 323
slightly higher than mean female wing size FA in our Control populations. This makes the 324
increase in developmental stability we observed in ML males particularly striking, since it 325
suggests that intralocus sexual conflict is an important factor in determining levels of 326
developmental stability between the sexes. 327
328
The role of FA in mate choice has been widely discussed, and, in particular, the application of 329
this population parameter to the study of individual variation has been called into question 330
(e.g. Houle 1998, but see also Hansen et al. 2006). We unfortunately cannot deduce from the 331
data at hand whether wing size FA contributed directly to increases in ML male fitness via 332
female choice of more symmetrical males, or increased success in intrasexual competition 333
(Møller & Thornhill 1998). Alternatively, FA may simply serve as an indicator trait of high 334
genetic quality/attractiveness, for example if FA is not under direct selection but is negatively 335
correlated with other sexually selected traits (Bonduriansky 2009; Markow & Ricker 1992). 336
ML males evolved increased fitness through higher mating frequency, and behavioural 337
observations have shown that they obtain matings with females with lower courtship effort 338
per copulation (Bedhomme et al. 2008). This does not appear to be related to differences 339
between ML and C populations in CHCs (cuticular hydrocarbons; S. Bedhomme, A.K. 340
Chippindale, N.G. Prasad, M. Delcourt, J.K. Abbott, M.A. Mallet and H.D. Rundle, 341
unpublished data), so we can conclude that some other aspect of attractiveness or general 342
vigour related to precopulatory sexual selection has improved. Interestingly, recent research 343
has shown that in mice, loci coding for environmental robustness (insensitivity of the trait to 344
environmental variation) are almost universally sex-specific (Fraser & Schadt 2010). 345
Whether this is also true in Drosophila is currently unknown, but sex-specificity of 346
environmental robustness loci is certainly consistent with our results. 347
348
Intralocus sexual conflict will manifest itself when positive intersexual genetic correlations 349
prohibit a response to disruptive selection on the sexes for different phenotypic optima. 350
Consistent with this, ML selection not only led to smaller males, but to increased 351
development time, reflecting a decrease in growth rate through both of its components. At the 352
same time, the wing generally evolved increased phenotypic masculinization (both in terms of 353
size and shape), and the developmental stability of ML males increased. Both of these general 354
results were consistent with our expectations from the selection for perfection model 355
discussed above. Because we saw coordinated changes in female morphology when 356
expressing ML chromosomes, but reduced fitness and lower levels of developmental stability, 357
this provides experimental evidence of strong intersexual genetic correlations for the 358
characters themselves but to differing mechanisms of homeostasis in growth and ontogeny 359
within the two sexes. 360
361
ACKNOWLEDGEMENTS 362
363
Financial support was provided by the Swedish Research Council (to JKA), NSERC (to 364
AKC), a Lavoisier Award from the French government (to SB), and by Queen‟s University 365
ARC Awards (to JKA and SB). Thanks to three anonymous reviewers and Nelly 366
Gidaszewski for helpful comments, to Göran Arnqvist for useful suggestions regarding the 367
analysis of wing shape, and Lea Bond for the use of the microbalance. 368
Reference List 369
370
Bedhomme, S., N. G. Prasad, P.-P. Jiang and A. K. Chippindale. 2008. Reproductive behavior 371
evolves rapidly when intralocus sexual conflict is removed. PLoS One, 3: e2187. 372
Blanckenhorn, W. U., A. F. G. Dixon, D. J. Fairbairn, M. W. Foellmer, P. Gibert, K. van der 373
Linde, R. Meier, S. Nylin, S. Pitnick, C. Schoff, M. Signorelli, T. Teder and C. Wiklund. 374
2007. Proximate causes of Rensch's rule: does sexual size dimorphism in arthropods result 375
from sex differences in development time? Am. Nat., 169: 245-257. 376
Bonduriansky, R. 2009. Condition dependence of developmental stability in the sexually 377
dimorphic fly Telostylinus angusticollis (Diptera: Neriidae). J. Evol. Biol., 22: 861-872. 378
Bonduriansky, R. and S. F. Chenoweth. 2009. Intralocus sexual conflict. Trends Ecol. Evol., 379
24: 280-288. 380
Brandt, Y. and M. C. B. Andrade. 2007. What is the matter with the gravity hypothesis? 381
Funct. Ecol., 21: 1182-1183.
382
Breuker, C. J., P. M. Brakefield and M. Gibbs. 2007. The association between wing 383
morphology and dispersal is sex-specific in the glanville fritillary butterfly Melitaea cinxia 384
(Lepidoptera: Nymphalidae). European Journal of Entomology, 104: 445-452. 385
Breuker, C. J., J. S. Patterson and C. P. Klingenberg. 2006. A single basis for developmental 386
buffering of Drosophila wing shape. PLoS One, 1: 7. 387
Chippindale, A. K., A. L. Ngo and M. R. Rose. 2003. The devil in the details of life-history 388
evolution: instability and reversal of genetic correlations during selection on Drosophila 389
development. J. Genetics, 82: 133-145. 390
Clarke, G. M. 1998. The genetic basis of developmental stability. IV. Individual and 391
population asymmetry parameters. Heredity, 80: 553-561. 392
Cowley, D. E. and W. R. Atchley. 1988. Quantitative genetics of Drosophila melanogaster. 393
II. Heritabilities and genetic correlations between sexes for head and thorax traits. Genetics, 394
119: 421-433. 395
Cowley, D. E., W. R. Atchley and J. J. Rutledge. 1986. Quantitative genetics of Drosophila 396
melanogaster. I. Sexual dimorphism in genetic parameters for wing traits. Genetics, 114:
549-397
566. 398
Cox, R. M. and R. Calsbeek. 2009. Sexually antagonistic selection, sexual dimorphism, and 399
the resolution of intralocus sexual conflict. Am. Nat., 173: 176-187. 400
Davis, A. K. and A. M. Grosse. 2008. Measuring fluctuating asymmetry in plastron scutes of 401
yellow-bellied sliders: the importance of gender, size and body location. Am. Midl. Nat., 159: 402
340-348. 403
Fraser, H. B. and E. E. Schadt. 2010. The quantitative genetics of phenotypic robustness. 404
PLoS One, 5: e8635.
405
Frazier, M. R., J. F. Harrison, S. D. Kirkton and S. P. Roberts. 2008. Cold-rearing improves 406
cold-flight performance in Drosophila via changes in wing morphology. J. Exp. Biol., 211: 407
2116-2122. 408
Gidaszewski, N. A., M. Baylac and C. P. Klingenberg. 2009. Evolution of sexual 409
diimorphism of wing shape in the Drosophila melanogaster subgroup. BMC Evolutionary 410
Biology, 9: 110.
411
Gilchrist, G. W. and R. B. Huey. 2004. Plastic and genetic variation in wing loading as a 412
function of temperature within and among parallel clines in Drosophila subobscura. 413
Integrative and Comparative Biology, 44: 461-470.
414
Gilchrist, G. W., R. B. Huey and L. Serra. 2001. Rapid evolution of wing size clines in 415
Drosophila subobscura. Genetica, 112-113: 273-286. 416
Hansen, T. F., A. J. R. Carter and C. Pélabon. 2006. On adaptive accuracy and precision in 417
natural populations. Am. Nat., 168: 168-181. 418
Houle, D. 1998. High enthusiasm and low r-squared. Evolution, 52: 1872-1876. 419
James, A. C., R. B. R. Azevedo and L. Partridge. 1995. Cellular basis and developmental 420
timing in a size cline of Drosophila melanogaster. Genetics, 140: 659-666. 421
Karan, D., J.-P. Morin, P. Gibert, B. Moreteau, S. M. Scheiner and J. R. David. 2000. The 422
genetics of phenotypic plasticity. IX. Genetic architecture, temperature, and sex differences in 423
Drosophila melanogaster. Evolution, 54: 1035-1040.
424
Karan, D., J.-P. Morin, E. Gravot, B. Moreteau and J. R. David. 1999. Body size reaction 425
norms in Drosophila melanogaster: temporal stability and genetic architecture in a natural 426
population. Genetics, Selection, Evolution, 31: 491-508. 427
Klingenberg, C. P. and G. S. McIntyre. 1998. Geometric morphometrics of developmental 428
instability: analyzing patterns of fluctuating asymmetry with Procrustes methods. Evolution, 429
52: 1363-1375. 430
Long, T. A. F. and W. R. Rice. 2007. Adult locomotory activity mediates intralocus sexual 431
conflict in a laboratory-adapted population of Drosophila melanogaster. Proc. R. Soc. Lond. 432
B Biol. Sci., 274: 3105-3112.
433
Maklakov, A. A., T. Bilde and Y. Lubin. 2004. Sexual selection for increased male body size 434
and protandry in a spider. Anim. Behav., 68: 1041-1048. 435
Markow, T. A. and J. P. Ricker. 1992. Male size, developmental stability, and mating success 436
in natural populations of three Drosophila species. Heredity, 69: 122-127. 437
Mezey, J. G. and D. Houle. 2005. The dimensionality of genetic variation for wing shape in 438
Drosophila melanogaster. Evolution, 59: 1027-1038.
439
Miller, G. T. and S. Pitnick. 2003. Sperm-female coevolution in Drosophila. Science, 298: 440
1230-1233. 441
Møller, A. P. and R. Thornhill. 1998. Bilateral symmetry and sexual selection: a meta-442
analysis. Am. Nat., 151: 174-192. 443
Morrow, E. H., A. D. Stewart and W. R. Rice. 2008. Assessing the extent of genome-wide 444
intralocus sexual conflict via experimentally enforced gender-limited selection. J. Evol. Biol., 445
21: 1046-1054. 446
Palmer, A. R. 1994. Fluctuating asymmetry analyses: a primer in Markow, T. A. (ed) 447
Developmental instability: its origins and evolutionary implications. Kluwer, Dordrecht,
448
Netherlands. 449
Palmer, A. R. and C. Strobeck. 2002. Fluctuating asymmetry analyses revisited in Polak, M. 450
(ed) Developmental instability: causes and consequences. Oxford University Press, Oxford, 451
UK. 452
Parisi, M., R. Nuttall, D. Naiman, G. Bouffard, J. Malley, J. Andrews, S. Eastman and B. 453
Oliver. 2003. Paucity of genes on the Drosophila X chromosome showing male-biased 454
expression. Science, 299: 697-700. 455
Parsons, P. A. 1992. Fluctuating asymmetry: a biological monitor of environmental and 456
genomic stress. Heredity, 68: 361-368. 457
Partridge, L., B. Barrie, K. Fowler and V. French. 1994. Evolution and development of body 458
size and cell size in Drosophila melanogaster in response to temperature. Evolution, 48: 459
1269-1276. 460
Poissant, J., A. J. Wilson and D. W. Coltman. 2009. Sex-specific genetic variance and the 461
evolution of sexual dimorphism: a systematic review of cross-sex genetic correlations. 462
Evolution, 64: 97-107.
463
Powell, A. M., M. Davis and J. R. Powell. 2010. Phenotypic plasticity across 50 MY of 464
evolution: Drosophila wing size and temperature. Journal of Insect Physiology, 56: 380-382. 465
Prasad, N. G., S. Bedhomme, T. Day and A. K. Chippindale. 2007. An evolutionary cost of 466
separate genders revealed by male-limited expression. Am. Nat., 169: 29-37. 467
Reeve, H. K. and D. J. Fairbairn. 1996. Sexual size dimorphism as a correlated response to 468
selection on body size: an empirical test of the quantitative genetic model. Evolution, 50: 469
1927-1938. 470
Rice, W. R. 1984. Sex chromosomes and the evolution of sexual dimorphism. Evolution, 38: 471
735-742. 472
Rice, W. R. 1996. Sexually antagonistic male adaptation triggered by experimental arrest of 473
female evolution. Nature, 381: 232-234. 474
Santos, M., D. Brites and H. Laayouni. 2006. Thermal evolution of pre-adult life history 475
traits, geometic size and shape, and developmental stability in Drosophila subobscura. J. 476
Evol. Biol., 19: 2006-2021.
477
Schluter, D. 1996. Adaptive radiation along genetic lines of least resistance. Evolution, 50: 478
1766-1774. 479
Söderman, F., S. van Dongen, S. Pakkasmaa and J. Merilä. 2006. Environmental stress 480
increases skeletal fluctuating asymmetry in the moor frog Rana arvalis. Oecologia, 151: 593-481
604. 482
Soto, I. M., V. P. Carreira, E. M. Soto and E. Hasson. 2008. Wing morphology and 483
fluctuating asymmetry depend on the host plant in cactophilic Drosophila. J. Evol. Biol., 21: 484
298-609. 485
Taylor, C. E. and V. Kekic. 1988. Sexual Selection in a Natural Population of Drosophila 486
melanogaster. Evolution, 42: 197-199.
487
Vishalakshi, C. and B. N. Singh. 2006. Fluctuating asymmetry in certain morphological traits 488
in laboratory populations of Drosophila ananassae. Genome, 49: 777-785. 489
490 491
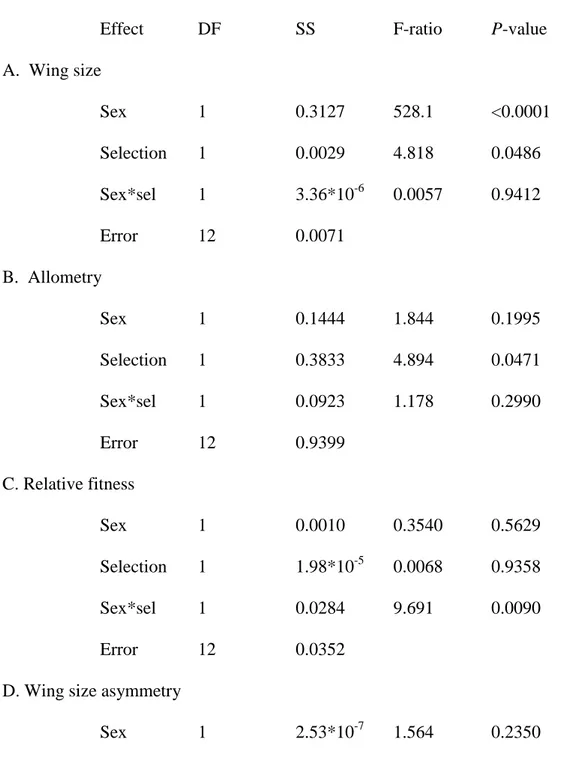
Table 1: Statistical significance of analysis of A. Wing size, B. The slope of the allometric relationship between body mass and wing size, C. Relative fitness, and D. Wing size
asymmetry. All measures were analysed using factorial ANOVAs on population mean values in JMP, with sex (M or F), selection regime (C or ML), and their interaction (sex*sel) as fixed factors. Degrees of freedom, sums of squares, F-ratios and P-values are reported for all effects.
Effect DF SS F-ratio P-value
A. Wing size Sex 1 0.3127 528.1 <0.0001 Selection 1 0.0029 4.818 0.0486 Sex*sel 1 3.36*10-6 0.0057 0.9412 Error 12 0.0071 B. Allometry Sex 1 0.1444 1.844 0.1995 Selection 1 0.3833 4.894 0.0471 Sex*sel 1 0.0923 1.178 0.2990 Error 12 0.9399 C. Relative fitness Sex 1 0.0010 0.3540 0.5629 Selection 1 1.98*10-5 0.0068 0.9358 Sex*sel 1 0.0284 9.691 0.0090 Error 12 0.0352
D. Wing size asymmetry
Selection 1 4.26*10-8 0.2640 0.6167
Sex*sel 1 9.03*10-7 5.594 0.0357
Table 2: Results of MANCOVA analysis of wing shape. Wing shape was analysed using the first 11 relative warps (i.e. principal components of shape) as the dependent variables, with sex (M or F), selection regime (C or ML), and their interaction (sex*sel) as fixed factors. Wing size (centroid size) was also included as a covariate to control for shape differences due to allometric effects. Numerator and denominator degrees of freedom, test statistics (Wilks‟ λ or F-ratio), and P-values are reported for all effects; Wilks‟ λ is reported for effects with DF > 1, and F-ratio is reported for effects with DF = 1. There were significant effects of both sex and selection regime on wing shape, as well a significant allometric effect of wing size on wing shape.
Effect Num DF Den DF Wilks‟ λ F-ratio P-value
Whole model 44 5.78 9.04*109 0.0012 Intercept 11 1 754.8 0.0284 Sex 11 1 1928 0.0178 Selection 11 1 3157 0.0139 Sex*sel 11 1 29.85 0.1419 Wing size 11 1 760.6 0.0283
Figure 1: Landmark locations (A) and wing shape differences (B-C). A. Locations of the 11 landmarks used in this study. B. Visualization of the difference in wing shape between the sexes. Arrows indicate the direction of change from female configuration to male in Control individuals. For the sake of clarity, the difference in shape between the sexes has been exaggerated by a factor of three. C. Visualization of the change in wing shape as a result of male-limited (ML) evolution (males and females pooled). Arrows indicate the direction of change from Control configuration to ML for both sexes. The difference in shape between selection regimes is smaller than between the sexes, so the difference in shape between ML and C groups has been exaggerated by a factor of 10 for the sake of clarity. The change in shape resulting from ML evolution is qualitatively similar to the extant sexual dimorphism for shape, in that both involve an increase in the size of the distal part of the wing, and a decrease in the size of the proximal part of the wing.
Figure 2: Sex by selection interaction in A. Wing size, B. Allometry, C. Relative fitness, and D. Developmental stability (measured as the inverse of the population mean fluctuating asymmetry of wing size). A. Males have smaller wings than females, and ML individuals have smaller wings than Control individuals. This is consistent with previous results for body size. B. The slope of the regression of wing size on body mass was higher for ML flies than for C flies. This suggests an evolutionary change not only in isolated traits, but in a number of interrelated aspects of the developmental program. C. Male fitness was measured as the proportion of the progeny sired by experimental males when in competition with standard competitor males for the access to females. Female fitness was measured as the total progeny produced after experimental females had been in competition with standard competitor females for access to food resources. To make male and female data comparable, fitness is expressed relative to the mean fitness for each sex within each replicate population. The ML
evolution procedure led to an increase in male fitness and a decrease in female fitness, confirming the presence in the ancestral population of sexually antagonistic variation and a gender load. D. ML males have higher developmental stability than C males, while the pattern is reversed for females (i.e. ML females have higher FA than C females; data shown is standardized for size differences, but the pattern is similar for raw data). This suggests that experimental ML evolution has resulted in an increase in developmental stability in males at the cost of a decrease in developmental stability in females. Error bars denote SEs.
Sexual conflict in wing size and shape in Drosophila melanogaster:
Supplementary information
By Jessica K. Abbott1,2*, Stéphanie Bedhomme1,3, and Adam K. Chippindale1
1. Department of Biology Queen‟s University Kingston, Ont. K7L 3N6 Canada 2. Current address:
Department of Animal Ecology Evolutionary Biology Centre (EBC) Uppsala University
Norbyvägen 18D
SE-752 36 Uppsala, Sweden Email: jessica.abbott@ebc.uu.se Phone: +46 18 471 2938
Fax: +46 18 471 6484 3. Current address:
Evolutionary Systems Virology Group
Instituto de Biología Molecular y Celular de Plantas (CSIC-UPV) Campus UPV, CPI 8E, lab. 3.0.4
Ingeniero Fausto Elio s/n, 46022 València, Spain *author for correspondence
SUPPLEMENTARY METHODS 493
494
Male-limited evolution protocol 495
496
The derivation of the male-limited (ML) lines and their matching controls (C) is described in 497
detail elsewhere (Prasad et al., 2007). Briefly, the ancestral population is the LHM population, 498
a laboratory-adapted outbred population (Chippindale & Rice, 2001). Four large 499
subpopulations were derived from the ancestralpopulation and maintained in isolation for 10 500
generations. From each of these populations, one pair of selected (ML1- 4) and control (C1-4) 501
populations was initiated. Selected and control populations bearing the same numerical 502
subscript were therefore more closely related to one another through their common ancestry 503
and subsequent handling than to other selected or control populations. To initiate an ML 504
population, 1040 haplotypes, consisting of chromosomes I (X), II, and III, but not the tiny 505
chromosome IV (i.e. more than 99% of the genome in total, hereafter referred to as 506
haplotypes) were sampled using “clone generator females” carrying a compound X(C(1)DX, 507
y, f), a Y chromosome from the LHM base population, and a homozygous-viable translocation 508
of the two major autosomes (T(2:3)rdgc st in ri pp bw). These chromosomal constructs and
509
the absence of molecular recombination in male D. melanogaster mediate the transmission of 510
the haplotypes from father to son. The males carrying a translocation and a wildtype 511
haplotype originally sampled from LHM were crossed each generation to “clone generator 512
females”. In this way, these haplotypes were transmitted from father to son only, the grand-513
maternal haplotypes being discarded every generation. Efforts were made to standardize the 514
effective population size between selected (ML) and control (C) populations by maintaining 515
the same number of haploid genomes in each. Finally, the same maintenance protocol was 516
used for C and ML populations, except that the C populations had normal transmission of 517
genetic material from one generation to the next, via both males and females. This 518
experimental protocol completely prevented recombination in the ML populations, which 519
could slow down their rate of adaptation due to genetic hitchhiking, mutation accumulation, 520
and background selection. To prevent this, in each generation 4% of the genomes were passed 521
through a series of crosses in which the ML haplotypes were expressed in females, allowing 522
them to recombine (Prasad et al., 2007). Because this „recombination loop‟ constantly 523
received new ML-selected chromosomes, females in it were carrying ML chromosomes from 524
the previous generations of selection. These recombined ML haplotypes were then 525
reintroduced into the general ML population. 526
527
All flies were reared at 25°C in 50% relative humidity in a 12:12h light/dark cycle under 528
moderate densities of approximately 150 larvae per vial. 529
530
Generation of males and females expressing ML and C genotypes. 531
532
At generation 82 of experimental evolution, flies were collected to start a series of three 533
crosses necessary to generate the individuals for fitness measurements and wing morphology 534
analysis. Males from the ML selection treatment were first crossed to the clone generator 535
females described in the main text. The F1 males produced from this cross were then mated 536
to females that were homozygous for a balancer X chromosome (FM7) and translocation (T 537
(2 : 3)rdgc st in ri pp bw). F2 females that were heterozygous for the balancer X but 538
homozygous for the translocation were then back-crossed to the F1 males. The offspring of 539
this third cross were therefore males and females carrying one ML or C haplotype and the 540
translocation of chromosomes 2 and 3 used to evolve the ML populations. 541
SUPPLEMENTARY RESULTS 543
544
Both the sexes and the experimental groups differed in dry body mass (Table S1A). Males 545
were significantly smaller than females, and ML individuals were smaller than C individuals 546
(Figure S2A). This is similar to previous results for dry body mass (Prasad et al., 2007). The 547
pattern was the same for wing loading. Females had higher wing loading than males and C 548
had higher wing loading than ML (Table S2B, Figure S1B). 549
550
REFERENCES 551
552
Chippindale, A. K. and Rice, W. R. 2001. Y chromosome polymorphism is a strong 553
determinant of male fitness in Drosophila melanogaster. Proc. Nat. Acad. Sci. USA 98: 5677-554
5682. 555
556
Prasad, N. G., Bedhomme, S., Day, T., and Chippindale, A. K. 2007. An evolutionary cost of 557
separate genders revealed by male-limited expression. Am. Nat. 169: 29-37. 558
559 560 561
Table S1: Means for each combination of population, sex, and selection regime for all univariate traits. Loading is short for wing loading.
Population Sex Selection Body mass Wing size Loading Allometry Fitness FA
1 Female Control 0.3864 2.280 0.1694 0.3937 1.061 0.0042 1 Male Control 0.2480 2.031 0.1221 1.256 0.9461 0.0050 2 Female Control 0.4388 2.317 0.1892 0.4202 1.103 0.0038 2 Male Control 0.2453 2.039 0.1203 0.3993 0.8998 0.0042 3 Female Control 0.4261 2.347 0.1816 0.3331 1.040 0.0044 3 Male Control 0.2469 2.061 0.1198 1.007 1.042 0.0047 4 Female Control 0.4103 2.316 0.1770 0.5837 1.024 0.0042 4 Male Control 0.2358 2.014 0.1172 0.4355 0.9386 0.0037 1 Female ML 0.3930 2.289 0.1715 0.7412 1.038 0.0046 1 Male ML 0.2312 1.996 0.1158 1.323 1.036 0.0039 2 Female ML 0.3629 2.319 0.1564 1.133 0.8989 0.0046 2 Male ML 0.2304 2.048 0.1124 0.8471 1.100 0.0036 3 Female ML 0.3813 2.263 0.1686 0.9944 0.9679 0.0039
3 Male ML 0.2265 1.991 0.1138 0.9049 0.9575 0.0034
4 Female ML 0.3675 2.287 0.1606 0.7077 0.9776 0.0049
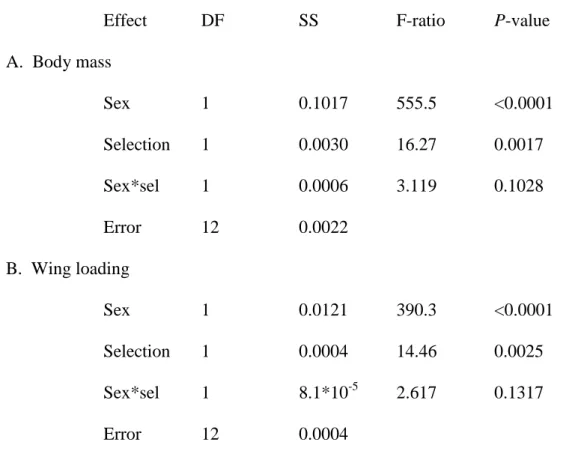
Table S2: Statistical significance of analysis of A. Body mass, and B. Wing loading. Mean values for each combination of sex, replicate population, and selection regime were first calculated and then were analyzed using a factorial ANOVA in JMP, with sex (M or F), selection regime (C or ML), and their interaction (sex*sel) as fixed factors. Degrees of freedom, SS, F-ratios and P-values are reported for all effects.
Effect DF SS F-ratio P-value
A. Body mass Sex 1 0.1017 555.5 <0.0001 Selection 1 0.0030 16.27 0.0017 Sex*sel 1 0.0006 3.119 0.1028 Error 12 0.0022 B. Wing loading Sex 1 0.0121 390.3 <0.0001 Selection 1 0.0004 14.46 0.0025 Sex*sel 1 8.1*10-5 2.617 0.1317 Error 12 0.0004
Figure S1: Differences between the sexes and experimental groups in A. Dry body mass, and B. Wing loading. Males were smaller than females, and ML individuals were smaller than C individuals. Similarly, females had higher wing loading than males and C had higher wing loading than ML. Error bars denote SEs.