Tracing the hydrologic connection between Turquoise Lake and local mine dewatering tunnels with dissolved sulfur hexafluoride (SF₆)
11
0
0
Full text
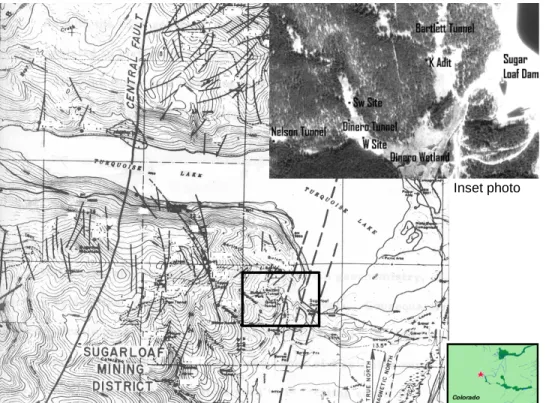
(2) Tracing the Hydrologic Connection between Turquoise Lake and Local Mine Dewatering Tunnels with Dissolved Sulfur Hexafluoride (SF6). Located within the Sugar Loaf District of Colorado’s mineral belt, the area surrounding Turquoise Lake was mined extensively beginning in the 1880’s for silver and gold. Mining operations continued through the late 1940’s with continuous operations from certain mines as late as 1920 (Singewald 1955). The largest ore-producing mine in the district was the Dinero, whose tunnel extends over 1,100 meters to connect with the Dinero shaft and the network of mine workings it once served. Associated with the ore-producing veins are zones of intense deformation characterized by dense faulting and alteration of the granite host rock (Singewald 1955). A major local structure is the Central Fault, which is a large normal fault of unknown displacement associated with the Rio Grande Rift. This fault has been mapped through the Sugarloaf district, continuing beneath Turquoise Lake, and on through St. Kevin district immediately to the north (Figure 1; Craig 1980). Several other minor faults and fractures of the same general orientation that splay off the Central Fault have been mapped through the district (Craig 1980). After construction and subsequent expansion of the Sugar Loaf Dam, a noticeable increase in the area of wetlands below the Dinero and Bartlett tunnels was observed in aerial photographs of the area. In a survey from July 2000, the Dinero wetlands were found to have an area of 44,300 m2 (August et al. 2002). The resultant increase raised concern over the quantity and quality of water discharging into and out of the wetlands from the tunnels themselves and the associate mining complex. As of November 2003, the tailing piles of the Dinero Tunnel and Nelson Tunnel have been effectively removed from communication with the tunnel discharge waters, which should have the desired effect of improving water quality. However, the tunnel discharge water itself still contains elevated levels of dissolved metal, most notably zinc, iron, and manganese and, therefore, remains a water quality concern (Kern and Stednick 1993). In addition, a watershed accounting of the contributing area of the tunnels greatly underestimates the quantity of water, raising the question of a connection with Turquoise Lake (Kern and Stednick 1993). Due to the timing of the increased wetland area and the close association between the mine workings and fractures it was hypothesized that the reservoir itself was contributing to water discharges in the area seeps and tunnels, including the Dinero and Bartlett.. 2. Study Objectives The objective of this study was to apply a tracer to Turquoise Lake in order to determine the nature of the hydrologic connection with the Dinero and Bartlett wetlands. The tracer of choice for this experiment was sulfur hexafluoride, which has been used in a variety of experiments, including situations involving drinking water supply (Gamlin et al. 2001), large water body degassing experiments (Wanninkhof et al. 1985), and several month to year long groundwater tracing applications (Gamlin et al. 2001).. 85.
(3) Engblom, Sanford and Stednick. Inset photo. Figure 1: Map of Turquoise Lake and mining districts selected faults. Inset photo showing sample locations relative to Sugar Loaf Dam. Adapted from Craig (1980).. 2.1.. Traditional Tracers Traditional conservative tracers, such as bromide salt and fluorescent dyes, are effective in experiments involving smaller source areas but may not behave conservatively in all situations, especially those involving low pH and high dissolved mineral content (Clark et al. 1996). Although the water of Turquoise Lake has exceptionally low concentrations of dissolved minerals due to its close proximity to the snow-melt source, the water chemistry of the mine drainage is high in dissolved minerals with potential to interfere with salt and dye tracers. In attempting to use a large lake as the source for a groundwater tracer, a sufficient quantity of tracer is required to create the several orders magnitude change in concentration possible between source and sampling point. In addition, since Turquoise Lake is an important recreational lake and water supply, the applied tracer must not interfere in any way with the intended uses of the water and with aquatic life by introducing toxins or other chemical changes (such as color). 2.2. Sulfur Hexafluoride SF6 is a fully fluorinated, inert compound that is primarily produced for use in electrical insulators, which has the corollary effect of making it an efficient and long-lived greenhouse gas (Ravishankara et al. 1993). However, since SF6 is solely an anthropogenic molecule, atmospheric background concentrations are relatively low with current concentrations of <3 ppt (parts per trillion) by volume (Vulvana et al. 2002). It is nonpolar, inert, and nontoxic, with a detection limit of around 10-14 mol L-1 that allows for detection at long distances from the source and precise measurements in water over a concentration range of 6 orders of magnitude (Clark et al. 1996). 86.
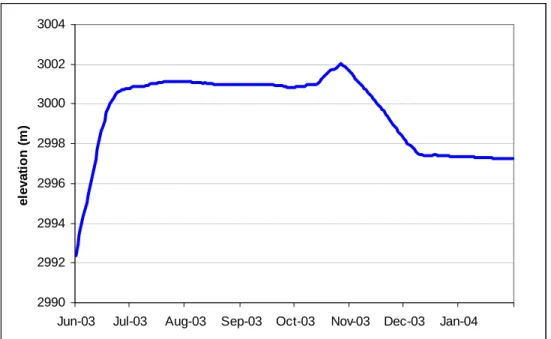
(4) Tracing the Hydrologic Connection between Turquoise Lake and Local Mine Dewatering Tunnels with Dissolved Sulfur Hexafluoride (SF6). The chemical inertness and resistance to chemical and thermal degradation is particularly important due to the large change in water chemistry between lake-source water and discharge waters. The main drawback to using SF6 is its relative high volativity and related low solubility. The dimensionless Henry’s constant for SF6 is 121.7 for water at 10°C, nearly 5 times that of oxygen at the same temperature (Wilson and MacKay 1993). Thus, the presence of a gas phase, or unsaturated conditions, may significantly retard or outright remove the tracer as it preferentially moves into the gas phase (Fry et al. 1995). Gamlin et al. (2001) noted a 47% (± 4%) loss of SF6 concentration over a 2.8 meter drop structure along the Santa Ana River due to mixing and atmospheric exposure. In the case of the present study and the unknown nature of the fracture-tunnel flow paths, a similar response of lowering the tracer concentration is possible, particularly as water drains from fractures to the tunnel as open channel flow or exposed thin sheet flow.. 3. Experimental Methods 3.1.. Tagging Turquoise Lake The commencement of the experiment was timed according to the highest lake levels, which traditionally occur in the month of July, in order to trace the movement of the water when the pressure from the lake is the greatest and the potential connection to the mine areas the highest. In July 2003, the reservoir stabilized at an elevation of 3,001 meters (Figure 2) and a reservoir volume at approximately 70% of capacity (1.1 X 10⁸ m3). Reservoir levels began to fall the last week of October and continued until the lake was completely frozen over the first week of December 2003. Over the course of 10 hours, split between 2 days (July 24th and 30th, 2003), approximately 166 moles of SF6 gas were bubbled directly into the waters of Turquoise Lake. The injection apparatus consisted of an array of 5 sparging stones spanning 1 meter connected via 6.35 mm copper tubing to a cylinder of 99.99% pure SF6 positioned in a small boat. The apparatus was lowered to a depth of approximately 3 meters for the July 24th session and the boat was rowed back and forth across the lake for 6 hours. More time was spent bubbling tracer at the western end of the reservoir because several mine adits are located immediately above the shoreline along the steep, fractured rock shoreline and because this is where Lake Fork Creek enters. It was hoped that the incoming currents would help distribute the tracer throughout the lake. The July 30th 4-hour session continued with the same basic setup in a small fishing boat with outboard motor set at a slow trolling speed and more uniform distribution around the lake.. 87.
(5) Engblom, Sanford and Stednick. 3004 3002. elevation (m). 3000 2998 2996 2994 2992 2990 Jun-03. Jul-03. Aug-03. Sep-03. Oct-03. Nov-03. Dec-03. Jan-04. Figure 2: Lake elevation over the course of the tracer experiment.. 3.2.. Sample Collection 3.2.1 Lake Samples. Lake water samples were collected at a depth of 3 meters at six different locations identified by Global Positioning System (GPS), and one shoreline surface sample and one location selected for a depth profile where samples were taken from depths of 1, 3, 5 and 7 meters. Using a kayak for transportation, a Wildco-type water sampler fitted with a rubber septum was lowered to the appropriate depth and sampled directly using a 20 cc perfektum® micro-mate glass syringe fitted with a temporary needle. The needle was subsequently removed, the syringe capped with a rubber septum and submerged in an icebox filled with non-lake water (to eliminate storage contamination). After adequate homogenization of the tracer throughout the lake and a coincident turning of the weather that made kayak trips less feasible, samples were drawn directly from the shoreline at the surface. Preliminary attempts to transport samples on a warm day from the 3,000 meters elevation of Leadville, CO to analysis facilities in Fort Collins, CO below 1,500 meters resulted in undesired air bubbles forming in several samples. The problem was resolved by adding as small bead of silicon to the syringe plunger to act as a gasket that prevents any gas exchange. All samples were analyzed within 6 days with the majority of samples analyzed within 48 hours. Duplicate samples analyzed one week later showed no loss of SF6 concentration, confirming adequate sample preservation. 3.2.2. Groundwater Samples. Several groundwater sources, including the Dinero and Bartlett tunnels, were sampled beginning July 24th, 2003, the day of the first injection (Figure 1). While all tunnels are actively discharging water, the Bartlett and Nelson tunnels have both collapsed at their openings. The Dinero tunnel has collapsed approximately 50 meters back with an intact opening, while the K-adit remains completely intact, though slightly modified by its present owner. In addition to the mine sites, 88.
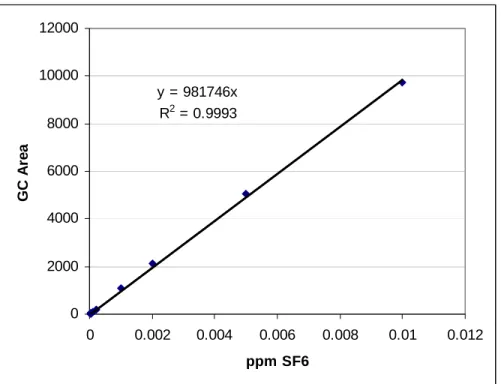
(6) Tracing the Hydrologic Connection between Turquoise Lake and Local Mine Dewatering Tunnels with Dissolved Sulfur Hexafluoride (SF6). two groundwater seeps were identified and sampled throughout the experiment, with one, the W-site, moving slightly according to the remediation progress of the Dinero tailings pile. All samples were taken using the 20 cc syringes with silicon bead and rubber septum caps. The syringes were filled directly from the flowing source of water in such a way so that all air bubbles were displaced by water. Samples were preserved and analyzed in the same manner as the lake samples. Background samples from both the reservoir and mine sites were collected prior to injection. 3.3. Sample Analysis The SF6 concentration in the headspace was measured using a Hewlett-Packard 5890 Series II gas chromatograph (GC) equipped with an electron capture detector (ECD) and 30 meter HP Molsiv, 0.53 mm internal diameter molecular sieve column. The oven temperature was set at 40°C, inlet port temperature at 250°C, and ECD temperature at 300°C. Nitrogen gas was used as the carrier gas at a flow rate of 5.8 mL min-1. SF6 eluted from the column in 80.4 seconds, followed by the oxygen-air peak at 92.5 seconds, creating adequate separation between the two peaks and allowing for relatively quick processing of samples. Air and pure nitrogen blanks were run every tenth sample to ensure no contamination or residual SF6 was left in the column. A 1.0 cc pure nitrogen headspace was added to each 20 cc sample syringe and allowed to warm to room temperature (22°C). Equilibrium between the water and headspace was achieved by 3 minutes of violent shaking of the syringe prior to sampling. 10 µL aliquots, drawn directly from the headspace, were immediately injected into the GC, which automatically calculates the integrated peak area associated with amount of SF6. According to Henry’s Law (where Henry’s Constant is equal to the concentration in the gas phase divided by the concentration in the water phase) 99.4% of the dissolved SF6 mass will move from the dissolved phase of the sample into the headspace. Using the Ideal Gas Law for the conditions present during sample analysis (atmospheric pressure at 1,500 m elevation is 0.818 atm; Weast 1983) and the known concentration of SF6 in the headspace in parts per million (ppm), a calculation can be made for the concentration of dissolved SF6 in the water sample in moles per liter. The uncertainty determined with field duplicate and laboratory replicates was ±5.5%. 3.4. Standard Calibration A 1 part per million SF6 (±5%) standard from Scott Specialty Gases was used to develop a calibration curve relating the integrated peak area calculated on the GC to known concentrations in parts per million (Figure 3). All injections were made using 10 µL Hamilton gas-tight syringe flushed with nitrogen between each sample. The necessary dilutions of the standard were made using a 50 mL syringe capped with a rubber septum and mixed with varying amounts of pure nitrogen and standard.. 89.
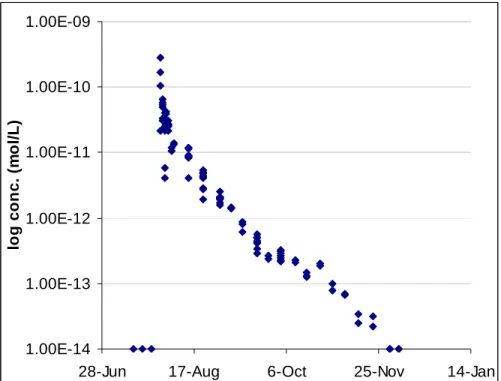
(7) Engblom, Sanford and Stednick. 12000 10000 y = 981746x R2 = 0.9993. GC Area. 8000 6000 4000 2000 0 0. 0.002. 0.004. 0.006. 0.008. 0.01. 0.012. ppm SF6. Figure 3: Calibration Curve for SF6 using dilutions of 1 ppm standard. Dilutions represented cover the full range of concentrations encountered in all samples and carried out to the detection limit (0.1 parts per billion in air). The regression significance value was determined to be <0.0001.. 4. Results 4.1.. Tagging Turquoise Lake In a lake gas exchange experiment, Wanninkhof et al. (1987) estimated that 10% of the volume of SF6 injected into Mono Lake actually dissolved into the water with the remaining 90% escaping directly into the atmosphere in bubbles. The hope for this experiment was that the cold water of Turquoise Lake, even during the summer months, would allow more SF6 to dissolve in the water. The initial 4 days of sampling across Turquoise Lake saw a range of concentrations (30 to 64x10-12 mol L-1 on day 1). The average concentration of lake samples taken approximately 20 hours after the second injection was 50x10-12 mol L-1, which equates to a total of 5 moles SF6 dissolved in the water. By the second week, all samples taken at depth of 3 meters were within 10% concentration of each other, with the same for the depth profiles by the third week. Taking this initial mixing process into account, the overall concentration versus time curve for the SF6 in Turquoise Lake displays an exponential decay trend with concentrations dropping below the detection limit of 2x10-14 mol L-1 18 weeks after the initial injection (Figure 4).. 90.
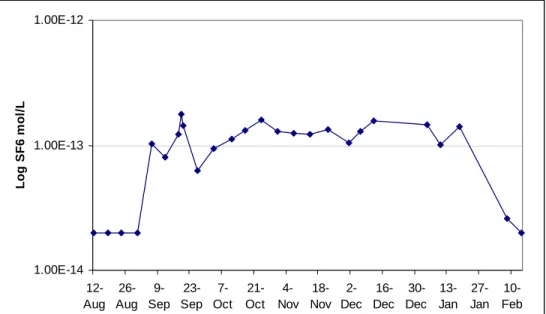
(8) Tracing the Hydrologic Connection between Turquoise Lake and Local Mine Dewatering Tunnels with Dissolved Sulfur Hexafluoride (SF6). 1.00E-09. log conc. (mol/L). 1.00E-10. 1.00E-11. 1.00E-12. 1.00E-13. 1.00E-14 28-Jun. 17-Aug. 6-Oct. 25-Nov. 14-Jan. Figure 4: Turquoise Lake SF6 concentrations during the course of the experiment (log conc. vs. time). Notice the wide range in concentrations from samples taken the first week after the injection. The overall shape of the curve is best fit as an exponential decay curve, or a straight line on this logarithmic plot. The main cause of concentration decay is due to natural degassing of the water over time.. Bartlett Tunnel SF6 Detection The collapsed opening of the Bartlett Tunnel is at an elevation of 2,991 meters, 10 meters below the average elevation for Turquoise Lake during the experiment. The tunnel itself trends to the northwest for a distance of 420 meters towards the main zone of mineralization and fractures with no information available concerning how much has collapsed or remains open. It is located 600 meters away from the closest point in Turquoise Lake with other potential flow paths up to 1700 m away. With this being the case, hydraulic gradients for the potential flow paths that connect to the lake range from 0.006 to 0.017. Several productive veins that Bartlett Tunnel served trend to the northeast in a direction towards the lake with fracture openings likely along the same trend (Singewald 1955). Throughout the study, the tunnel has continuously discharged water at a rate ranging from 0.8 to 1.0 L s-1. Despite a lesser amount of underground mine workings and penetration compared to the Dinero Tunnel, the SF6 tracer arrived at the Bartlett Tunnel 45 days after the initial injection with SF6 detected through January 2004 (Figure 5). The resultant travel velocity based on this arrival time is 13 m day-1. 4.2.. 91.
(9) Engblom, Sanford and Stednick. Log SF6 mol/L. 1.00E-12. 1.00E-13. 1.00E-14 12- 26- 923- 7Aug Aug Sep Sep Oct. 21Oct. 418- 216- 30- 13- 27- 10Nov Nov Dec Dec Dec Jan Jan Feb. Figure 5: Bartlett tunnel SF6 concentration curve (background and samples prior to SF6 arrival set at detection limit of 2 X 10-14 mol L-1).. Mine-area SF6 Detection The Dinero Tunnel opening is located at an elevation of 2,978 meters, 23 meters below the average reservoir height during the experiment. The Wsite is located an additional 8 meters below the Dinero Tunnel and the seep located in Little Sugarloaf gulch (S-site) located 6 meters above the Dinero Tunnel. Two samples taken the first week after the injection from the W-site produced a peak on the GC four times larger than the largest peak encountered in any lake sample. Another sample from two weeks post injection produced a peak equivalent to that of the highest lake sample. Likewise, one sample from the Dinero tunnel one week post injection produced a peak the equivalent of 4x10-12 mol L-1 SF6, with a laboratory replicate analyzed 4 minutes later without additional shaking producing a peak one-fourth as large. Samples from the Dinero tunnel four day later produced a peak equivalent to 2x10-12 mol L-1 SF6 while a field duplicate saw no peak at all. No tracer peaks were seen in any other samples. 4.3.. 5. Discussion Concurrent with the tracer experiment, active remediation of the Dinero Tunnel tailings pile, involving large earth-moving equipment, carried on its work in and around the tunnel itself and a seep, the W-site, located at the toe of one of the larger piles. In addition, a grout was injected in and around the collapsed section of the Dinero Tunnel in order to stabilize it for subsequent inspection, which likely had the effect of backing up the water and forcing it up and around through new openings. The main focus of the experiment was directed towards the Dinero Tunnel in response to its relatively large discharge (approximately 4 L s-1 during the study), with the. 92.
(10) Tracing the Hydrologic Connection between Turquoise Lake and Local Mine Dewatering Tunnels with Dissolved Sulfur Hexafluoride (SF6). remaining sampling sites of interest in their relation to the Dinero Tunnel. However, no SF6 was detected at any site other than the Bartlett tunnel. Although no certain conclusions can be drawn regarding the nature of the anomalous samples, it must be noted that the GC analysis technique is not specific to SF6, but rather any large non-polar, halogenated molecule, such as refrigerants and halons, may give a confounding result (Bennett and Doocey 2001). These four samples that produced peaks were taken during the height of remediation efforts with a large amount of traffic by the earthmovers throughout the whole area. The reduction of headspace concentration of the replicate sample after 4 minutes of no additional shaking provides a clue that it was a different chemical of a different solubility. No samples taken prior to, between, or after the aforementioned 4 showed any trace of either SF6 or what is thought to be an unknown contaminant. The Nelson Tunnel is located at an elevation above the lake surface, and is thus not expected to be as affected by the elevated lake levels, though the raising of the local groundwater table by the lake’s presence may still register an effect on the Nelson Tunnel discharge. The Nelson Tunnel has all but ceased to discharge along with the onset of the winter freeze, whereas the Dinero and Bartlett Tunnels continue at a consistent discharge. This suggests that at least some portion of the discharge is not directly from the reservoir. With the tracer being detected at the Bartlett Tunnel for over 5 consecutive months of sampling, it is somewhat surprising that nothing has been detected at the Dinero Tunnel or the seep locations. Two main explanations for the lack of tracer pickup include: 1. The SF6 concentrations in the Dinero Tunnel were lowered below the detection limit through a combination of in-tunnel degassing and flow aeration due to open, cascading drops similar to the losses endured in the Santa Ana River (Gamlin et al. 2001). In this case, the tracer was unsuccessful, though water is still flowing directly from Turquoise Lake to the Dinero Tunnel, as is the case with the Bartlett Tunnel. 2. The water in Turquoise Lake is not flowing directly to the Dinero Tunnel, but rather provides a local pressure, raising the water table and directing water away from the lake and towards the tunnel. All concentrations of SF6 in samples from the Bartlett were within one order of magnitude of our detection limit. The Bartlett Tunnel is located at a distance of 600 meters from the reservoir with up to 400 meters of open tunnel, whereas the Dinero Tunnel is located at a distance of 1,300 meters from the reservoir, with up to 1,100 meters of open tunnel. Both of these two factors are understood to work against the survival of the tracer; the longer route with a greater number of obstacles encountered and the open-tunnel flow allowing for natural degassing. With a relatively high flow velocity of 13 m day-1, the low tracer concentrations detected at the Bartlett Tunnel and lack of detection in the Dinero Tunnel may be best explained by degassing of SF6 along the flow path.. 6. Conclusions Turquoise Lake was successfully charged with SF6 in July 2003 and used to trace the movement of water into and through the Bartlett Tunnel, 93.
(11) Engblom, Sanford and Stednick. located immediately below the reservoir. Although very little is known about the current status of the tunnel (i.e. collapsed area and open flow path length), the tracers arrival in any concentration confirms its connection to the source waters of Turquoise Lake. The lack of detection at the Dinero Tunnel and associated seeps does not provide any evidence for the nature of its source water. This study highlights both the potential usefulness and versatility of this chemical for hydrogeologic tracing applications as well as some potential difficulties under certain flow regimes.. 7. Acknowledgments Funding for this work was provided by the U.S. Bureau of Reclamation and partial support for Engblom provided by the Edward M. Warner Geology Graduate Research Fellowship and the Water Center Fellowship. The project could not have proceeded without the logistical help from Carmen King and Don Stephens of CMC NRMI, Katie Walton-Day of the USGS, and analytical support from Brian Cranmer of the Dept. Analytical Toxicology, Colorado State University.. References August, E.E., D.M. McKnight, D.C. Hrncir, and K.S. Garhart: 2002. Seasonal variability of metals transport through a wetland impacted by mine drainage in the Rocky Mountains. Environmental Science & Technology, 36, 17, 3779-3786. Bennett, M., and D.J. Doocey: 2001. Comparison of concentration/flux ratios measured with a backscatter Lidar and with a chemical tracer. Atmospheric Environment. 35, 3435-3444. Clark J.F., P. Schlosser, M. Stute, and H.J. Simpson: 1996. SF6—3He tracer release experiment: a new method of determining longitudinal dispersion coefficients in large rivers. Environmental Science & Technology, 30, 5, 1527-1532. Craig, S.D: 1980. The geology, alteration, and mineralization of the Turquoise Lake area, Lake County, Colorado. M.S. Thesis, Earth Resources Dept., Colorado State University. Fry, V.A., J.D. Istok, L. Semprini, K.T. O’Reilly, and T.E. Buscheck: 1995. Retardation of dissolved oxygen due to a trapped gas phase in porous media. Ground Water, 33, 3, 391-398. Gamlin, J.D., J.F. Clark, G. Woodside, and R. Herndon: 2001. Large-scale tracing of ground water with sulfur hexafluoride. J. of Environmental Engineering, 127, 2, 171174. Kern, T.J., and J.D. Stednick: 1993. Identification of heavy metal concentrations in surface water through coupling of GIS and hydrochemical models. HydroGIS 93: proceedings of the Vienna Conference, April 1993. IAHS, 211, 559-567. Singewald, Q.D: 1955. Sugar Loaf and St. Kevin Mining Districts Lake County, Colorado: A contribution to economic geology. Geological Survey bulletin 1027-E. U.S. Government printing office: Washington. Vulava, V.M., E.B. Perry, C.S. Romanek, and J.C. Seaman: 2002. Dissolved gases as partitioning tracers for determination of hydrogeological parameters. Environmental Science & Technology. 36, 2, 254-262. Wanninkhof, R., J.R. Ledwell, and W.S. Broecker: 1987. Gas exchange on Mono Lake and Crowley Lake, California. J. of Geophysical Research, 92, C13, 14,567-14,580. Weast, R.C (Editor): 1983. Handbook of Chemistry and Physics. CRC Press: Boca Raton, Florida. Wilson, R.D., and D.M. MacKay: 1993. The use of sulfur hexafluoride as a conservative tracer in saturated sandy media. Ground Water, 31, 5, 719-724.. 94.
(12)
Figure
+2
Related documents
Resultaten från Stranos studier visar även att kvinnor tenderar att publicera profilbilder på sociala medier för att visa upp ett speciellt tillfälle 77 vilket kan liknas
A Stream Reasoning Coordi- nator takes a logical formula, finds all the relevant streams needed to evaluate the formula, creates a stream specification for generating a single stream
Activation of the inflammasome and production of IL-1β in conjunction with vitamin D induce increased killing specifically in cells from patients with active tuberculosis
Denna studie ska därför undersöka hur det normativa inslaget i EU:s politik gentemot Ryssland tagit sig uttryck från 1997 till 2013, för att bidra till diskussionen kring
This thesis joins a vast and competent field of research and the cheer extent of what previous scholars have achieved is humbling. Through this quantitative analysis I have tried
Skirt: Rectangular piece of fabric that I’ve painted to fade and then draped as a skirt, satin silk.. The skirt has a con- cealed zip at the side and a typical
Even though it is better to reuse the food waste for biogas production rather than throw it for incineration, it is of most importance to reduce the food waste firsthand (Civil
concreting the stream floor, small water channel paths, drains and cement injection at earth disturbed locations to control surface water migration to underground; shot-creating
