I
Supply Chain Maturity and Financial Performance
Study of Swedish SMEs
Arash Abolghasemi Kordestani
Fardshad Farhat
December 2009
Master’s Thesis in Logistics and Innovation Management
DEPARTMENT OF TECHNOLOGY AND BUILT ENVIRONMENT
II
Abstract
Purpose -
The goal of this research is to demonstrate that financial performance of current year is dependent to the amount of maturity of the supply chain processes. This aim is achieved through considering current supply chain process maturities of the firm together with financial performance of prior years.Research question -
How supply chain process maturities in relation to financial performance of prior years are related to current financial performanceMethodology -
The deductive approach has been followed to use theories and literatures to build the hypothetical model in order to test it empirically.This quantitative research is benefited from the primary data of Swedish steel SMEs including the secondary data from financial ratios from Scandinavian financial database
Findings -
The effect between supply chain process maturity and current year financial performance, the effect between prior year financial performance and current year financial performance, and also total effect of prior year financial performance and supply chain process maturity on current year financial performance proved empirically.III
Acknowledgement
Initially we would like to show our sincere gratitude to our supervisor Professor Lars Bengtsson who always helped us in different stages of this research. His great effort helped us to solve the problems with lack of theories, access to company data. Including that is his aid in recommendations for data analysis.
Furthermore we would like to thank Lennart Söderberg that helped us in using financial ratios. Also we appreciate Peter Lindberg the lecturer in University of Gavle helps in financial ratios definition.
Last, but not least we want to express our sincere gratitude to our parents for their love and passionate supports during our academic journey.
December, 2009 Arash & Farshad
IV
Table of Contents
Abstract ... II Chapter 1 Introduction ... 1 1.1 Research Background ... 2 1.2 Problem Definition... 21.3 Purpose and Research Question ... 3
1.4 Research Importance ... 4
1.5 Research Approach ... 4
1.6 Research Type ... 4
1.7 Acronyms ... 5
1.8 Outline... 5
Chapter 2 Theoretical Framework ... 6
2.1The SCOR model ... 7
2.2 Business Process Orientation (BPO) ... 9
2.3 SCOR model and Maturity of Supply Chain ... 10
2.4 The Performance ... 11
2.4.1 Supply Chain Performance ... 11
• SCOR model and performance ... 12
2.4.2 Financial performance ... 12
2.5 SMEs ... 14
2.6 Supply Chain Maturity and financial performance ... 16
2.7 Prior year financial performance and current year financial performance ... 17
2.7.1 TQM theory ... 17
2.7.2 The importance of average effect ... 18
2.8 Research Model and Hypotheses ... 18
Chapter 3 Methodology ... 20
3.1 Data collection ... 20
3.2 Research Method ... 21
3.2.1 Deductive or Inductive approach ... 21
3.2.2 Quantitative Research ... 21
3.2.3 Casual research ... 22
3.2.4 Type of Data ... 22
3.3 Data analyze ... 22
3.4 Reliability and Validity ... 23
Chapter 4 Data Analysis ... 24
4.1 Data analysis (SPSS)... 24
4.1.1 Descriptive Statistics ... 24
4.1.2 Inferential Statistics ... 27
V
• Regression Analysis ... 30
Chapter 5 Discussion ... 34
5.1Descriptive statistics ... 34
5.2 Inferential statistics ... 34
5.2.1 Supply chain maturity effect on financial performance ... 34
5.2.2 Financial performance of prior years effect on financial performance of current year 35 5.2.3 Effect among supply chain maturity and prior years financial performance, and current financial performance ... 36
• Sales Growth... 36
• Cash Flow ... 36
• Cost of Goods Sold (COGS) ... 36
• Inventory turnover ... 37 • Gross Margin ... 38 • Operating margin ... 38 • Net Margin ... 39 • Return on Asset ... 39 • Return on Investment... 40 Chapter 6 Conclusion ... 41
6.1 Effect of supply chain maturity on current financial performance ... 41
6.2 Effect of financial performance of prior years on current financial performance ... 41
6.3 Effect of supply chain maturity and prior year financial performance on current year financial performance ... 42
6.4 Conclusion Regarding Research Question ... 42
6.5 Research Contributions ... 43
6.6 Research Limitations ... 43
6.7 Future Researches ... 43
VI
List of Tables
Table 1: Acronyms list ... 5
Table 2: Descriptive statistics of supply chain maturity ... 25
Table 3: Descriptive statistics of financial performance of prior years ... 25
Table 4: Descriptive statistics of financial performance ... 26
Table 5: Corrected correlation among supply chain maturity indicators and financial performance (without outliers) ... 28
Table 6: Corrected correlation among financial performance of prior year and financial performance of current year (without outliers) ... 29
Table 7: regression among supply chain maturity and financial performance ... 31
Table 8: regression among financial performance of prior year and current year ... 32
Table 9: Regression among supply chain maturity and prior year financial performance, and financial performance ... 33
List of Figures
Figure 1: SMEs profile... 15Figure 2: Swedish SMEs value, employment and number ... 15
Figure 3: Research model including hypotheses (source: authors, 2009 based on Söderberg, 2009) ... 19
1
Chapter 1
Introduction
Managing supply chain is one of the big tasks for enterprises. In this way models are being used extensively to manage the chain of supply. Some companies gathered together and built a group called Supply-Chain Council1 that this number reached to 69 companies now (Bolstorff and Rosenbaum, 2003). One of the members of this council who basically came from a research team (Peter Bolstorff in 1996 from internal consulting team) of 3M Company coined a supply chain management model called Supply Chain Operations Reference Model (SCOR) (Supply Chain Council, 2009). This model is a reference for doing processes of supply chain management. It has a big coverage of processes (Bolstorff and Rosenbaum, 2003):
• Plan: starting point for planning and managing demand and supply • Source: sourcing for production
• Make: production
• Deliver: logistics activities
• Return: managing returned products
2
1.1 Research Background
Previous researchers worked on this base model as matured model and showed its implication for increasing performance in Brazil (McCormack, 2008). This model and other models like it find applicability if they can increase the performance of the company. But performance is big issue and it needs some indicators to be measured with. This performance assessment is comprehensive and it measures financial performance, customer satisfaction and other functional aspects. Bowersox et al (2007) proposed a logistics performance assessment which not only has the basic functions of performance, but also the customer focus and financial indicators as well. One of the rare empirical works in field of supply chain process maturities and financial performance is the one did by Söderberg and Bengtsson (2009) which is the relation among supply chain maturity; supply chain performance and financial performance. In this work the process maturity development stages of prior researchers (Lockamy and McCormack (2004), McCormack et al., (2008)) has been chosen to test how mature the supply chain of Swedish SMEs are. This model has the concepts of plan, source, make, and deliver processes of Supply Chain Operation Reference model discussed by (Bolstorff and Rosenbaum, 2003). In Addition the performance metrics of (Bowersox et al (2007) is also investigated. They could show that increasing the maturity level in the supply chain will also result in improving supply chain performance. But the effect of supply chain maturity on financial performance was not supported and also effect of supply chain performance on financial performance was partially supported.
1.2 Problem Definition
As it came in the previous section, competition increased and successful are the ones who serve customers better (Lockamy and McCormack, 2004). Empowered organizations can serve the customers better (Cook and Macaulay, 1997) and one of the ways for delivering lower price, fast, high quality products is adjusting supply chain (De Treville et al, 2004). There are different ways for supply chain optimization, which are costly and need implementation time, and no guarantee for results improvement. Supply chain digest (2006:3) listed some major disasters in supply chain management. In it are order management, delivery failures, wrong investment, and failing in aligning demand and inventory management.
3 Therefore, finding practical ways of supply chain management, which was implemented and tested before, is more attractive for firms. One of the practical models is SCOR (Supply Chain Operation Reference) model which has been proposed by Supply Chain Council (a group which has more than 1000 subscribed companies) which right now the 10th Ed. is under publication (Bolstorff and Rosenbaum, 2007; Supply Chain Council, 2009). The model helps companies to improve their processes and as McCormack et al (2003) mentioned it gives companies process maturity. Further researches have been done to investigate the promised effects of supply chain maturity on improving supply chain performance (McCormack et al., 2003, McCormack et al., 2008, Söderberg and Bengtsson, 2009), but the results were to some extent supported the assumptions. In Swedish steel industry, Söderberg and Bengtsson (2009) showed the process maturity in selected firms, but the effect of supply chain maturity on supply chain performance was partially supported and the effect of supply chain maturity on financial performance was not approved. There should be some latent factors that they turn aside the expected results from actual ones. Garvin (1991) for national award and York and Miree (2004) for TQM award are good examples of considering cumulative effect of prior years efforts on performance improvement. They showed Total Quality Management (TQM) effect on financial performance is a continuous improvement approach (Garvin 1991:84) and this improvement in supply chain did not happen just when they acquired the certificate. So the above mentioned proposition finds importance to investigate. Following the stream of antecedent researches, the problem of this research will be how the effect of supply chain maturity on financial performance can be described in consideration with prior year financial performance in the context of Swedish SMEs.
1.3 Purpose and Research Question
The question of this research is derived from the problem definition. In previous session the importance of considering the effect of supply chain maturity on financial performance and also the effect of prior year financial performance to describe this relation has been sketched. Hence the question of this research is how supply chain management process maturity in relation to financial performance of prior years is related to financial performance of current year. The prior
4 years financial performances are financial results of 2006 and 2007. Also current year financial performance is results of 2008 financial year. The research question will be divided to three different hypotheses in chapter 2.
1.4 Research Importance
This research is important due to its ground in SCOR model which is one of the rare mostly accepted models for supply chain management. Moreover to complete the way has been started with Söderberg and Bengtsson (2009) in supporting the effects of supply chain process maturity on financial performance. This data collection of this research is from the active SMEs in manufacturing, supplying, machinery, and wholesales of steel which are interested in results of this research as a continuation of prior researches.
1.5 Research Approach
Interest in studying the SCOR model (Bolstorff and Rosenbaum, 2003) guided the researchers to its implication for maturing supply chain processes (McCormack et al., 2003, McCormack et al., 2008). Considering the prior research which already done in this area (Söderberg and Bengtsson, 2009) and also recommendations of the supervisor to find the other latent factors here, the students tried to find more theoretical bases in an effort to check the effect of supply chain process maturities and other participating factors in predicting financial performance of current year. This idea guided to new theories and literatures that will come in the next chapter. This research used practical data in terms of financial ratios and questionnaire based data about supply chain process activities.
1.6 Research Type
This is a deductive research that in it based on literature review around some theories, hypotheses extracted and during some tests the researchers tried to prove what they assumed. This research is a quantitative one. Different measurement metrics exist in this research. In
5 financial ratios effort has been done to find marginal values which they become dimensionless and for supply chain process maturity interval scales.
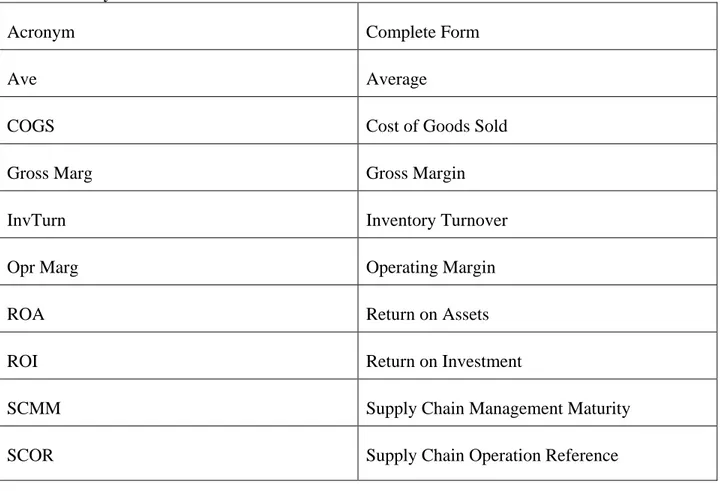
1.7 Acronyms
There are different acronyms in research that the full form is shown below: Table 1: Acronyms list
Acronym Complete Form
Ave Average
COGS Cost of Goods Sold
Gross Marg Gross Margin
InvTurn Inventory Turnover
Opr Marg Operating Margin
ROA Return on Assets
ROI Return on Investment
SCMM Supply Chain Management Maturity
SCOR Supply Chain Operation Reference
1.8 Outline
Chapter 2 is the next chapter and literature and different theories will be stated there, and then in then research question will be break down to different hypothesis. In chapter 3 the research and steps will be described more and the way of data collection and data analysis will be focused. Chapter 4 is dedicated to data analysis and chapter 5 discussing about the results and comparing them with literature for achieve findings. In the end the authors will refer back to research hypotheses and try to answer research questions and find practicality of the research. It is chapter 6.
6
Chapter 2
Theoretical Framework
In order to understand the factors participating in supply chain maturity and supply chain performance and consequently discussed to understand the definition, processes and levels. In the next section the Business Process Orientation financial performance a review of related literatures is given.
SCOR model will be will be mattered to show its importance for maturing supply chain. In addition SOCR model and its association with supply chain maturity has been considered. Finally these literatures will be used and summarized in the research model of this work.
7
2.1The SCOR model
Supply Chain Council as a nonprofit and independent association established in 1996. With a panel of outstanding firms like Bayer, Compaq, Procter and Gamble, Lockheed Martin, 3M together with the rest compromised 69 level 1 companies (Bolstorff and Rosenbaum, 2007) in the beginning as the initiators and now more than 1000 companies2.This group trail manufacturing, retailing, service and distribution industries, and the council is trying to implement the best practices of supply chain (Bolstorff and Rosenbaum, 2007).
The Supply Chain Operation Reference Model (SCOR) first coined by Supply Chain Council. SCOR helps organizations to gain competitive advantage in supply chain processes (Bolstorff and Rosenbaum, 2007). SCOR is an integrated model consisted of business process engineering, patterns, benchmarking issues, and practical experiences and the integrated processes of Plan, Source, Make, Deliver and Return in the whole supply chain including material, work and information flow (Bolstorff and Rosenbaum, 2007).
Due to significance and applicability of SCOR model, a brief review of it is given here. SCOR model is a process reference model consisted of three illustrious activities (SCOR overview, 2009: 1):
• Business Process Reengineering • Benchmarking
• Best Practices Analysis
While the company is assessing the current state (as-is) and try to reach the future state (to-be), benchmarking helps to find the best practices and then analyzing them and proposing management practices will assist in implementation of scenarios. Outcome of this settlement is supply chain performance improvement (SCOR overview, 2009:1).
Although SCOR has a broad scope starting from suppliers’ of suppliers to customers’ of customers, but there are some elements that they are not fully described by this widespread model like (SCOR overview, 2009: 3):
8 • Demand management in sales and marketing
• Technology development • Product development
• Customer support post delivery
Hence, presence of supporting factors in completing the activities of supply chain may be beneficiary. The processes of SCOR model are Plan; Source; Make; Deliver and Return (Bolstorff and Rosenbaum, 2007).
• Plan: it means planning everything in supply chain including production, inventory, distribution, material handling.
• Source: extension from purchasing department, sourcing start from obtain, inspecting, holding, paying and other related activities.
• Make: an elevated definition from production activities to include manufacturing, testing, packaging and deliver to following sections.
• Deliver: Extended logistics department with having access to customer database of marketing department and pricing of sales department they are active in order fulfillment, management, shipment, and transportation.
• Return: after sales service, acting in scheduling, receiving, inspecting, replacing customer goods
In addition, SCOR model compromised of different levels in (SCOR overview, 2009: 7):
1. Top level (process type): this level is high level and consisted of SCOR processes and in this level, performance criterions are setting.
2. Configuration level (process categories): here supply chain processes categorize and the supply chain activities of the supply chain align.
3. Process element level (Decompose processes): strategy elements define at this level with defining process elements, process input/output and choosing performance metrics and benchmarking with best practices.
4. Implementation level (decompose process elements): as it is called it is the implementation phase and change of as-is is becoming tangible in this stage.
9 There are some lower parts with execution intention, but these are the major blocks of the hierarchy.
2.2 Business Process Orientation (BPO)
Previous researches showed that maturity of the supply chain processes is related to Business Process Operation (McCormack et al., 2003). Business Process Orientation means having a new view to the organization business processes. It is a powerful tool helps companies to compete. BPO helps companies that act better in their network of activities and improve their business performance (Lockamy III and McCormack, 2004). It has a root in the organizational models and the works did by theoreticians (Deming, Porter, Davenport, Short, Hammer, Byrne, Imai, Drucker, Rummler-Brache, and Melan, cited by McCormack et al., 2008). BPO concept describes a goal oriented organization which effectively work on processes instead of bureaucracies and hierarchies meanwhile they pay attention to customer satisfaction (McCormack et al., 2008).
Questions rise here that how can a company mature its processes? The answer as Lockamy III and McCormack (2004) described relies in Business Process Orientation:
The improvements in functions of an organization like policies, bureaucracies and standards will result in improving the inter function activities. At the same time working on promoting activities regarding to related functions will result in better coupling of related functions. Totally the Business Oriented Organization achieves these millstones:
• Process illustration: including process description and paperwork • Process architecture: members, roles, and responsibilities
• Process tasks: administration,
• Process calculations: process vitrification
• Process norms: customer rights, privacies, custody
These BPO companies are benefiting from matured processes that help them increase their process capabilities too (Lockamy III and McCormack, 2004). These capabilities help in predicting and controlling processes and also in increasing effectiveness and efficiency.
10
2.3 SCOR model and Maturity of Supply Chain
The intention of SCOR model as it came above was to increase the performance of the supply chain activities in order to benefit organization, shareholders, and customers (Bolstorff and Rosenbaum, 2007). Having this ambition in activities, they showed this maturity would come up from working on five processes of plan, source, make, deliver and return.
In addition there are works of Lockamy III and McCormack (2004), McCormack et al (2008) who tried to connect and show the effect of having a BPO company on improving the efficiency of supply chain. In this way they introduced a BPO maturity model (Lockamy III and McCormack, 2004: 275) and in the next step they developed a supply chain maturity model.
Their Supply Chain Maturity Model has five stages and it shows how much mature are processes in an organization (Lockamy III and McCormack, 2004):
• Ad-hoc: lack of horizontal processes, lack of process measurement
• Defined: processes basic processes are defined, performance is measurable, high cost, customer satisfaction improved but it is still low
• Linked: processes are horizontally connected with help of teamwork of players across the chain, teams work on continuous improvement and root cause analysis for performance improvement
• Integrated: company, suppliers and clients have strategic cooperation for doing processes, performance measurement is being done broadly, high collaboration
• Extended: the maturity of the processes of multi organizational supply chains Different economy, different processes, extended supply chain
They showed its implication on supply chain performance, but they pointed to a future research due to importance of this maturity on financial performance as it was highlighted in the SCOR model too (Bolstorff and Rosenbaum, 2007). In the next section this performance will be discussed.
11
2.4 The Performance
The performance development of SCOR model is consisted of financial and logistical attributes (Bolstorff and Rosenbaum, 2007:78). In order to make it clear, first it is needed to define the different types of performance and their relations to overall or corporate performance of the company.
Logistic performance attributes should have basic performance issues, integrated supply chain performance measurement, and also ability to benchmarking (Bowersox et al, 2003). They mentioned these items as the fundamental components of logistics performance (Bowersox et al, 2003:557): “cost”, “customer service”, “quality”, “productivity”, and “asset management”. They also added that logistics activities of the organizations heavily affect the financial performance of the organization. Moreover they expressed that the only way that logistics performance of the company can contribute to the financial performance of the company is to do budgeting, cost management, and following strategic business model of the organization.
2.4.1 Supply Chain Performance
Logistics of supply chain is consisted of flow of materials and products to customers and also in the supply side of spare parts and return of defective products. In other words supply chain consisted of upstream or supply side; downstream or customer side while the company is in the middle (Jonsson, 2008). The aim of logistics is to give competitive advantage to company and increase the performance and this performance has different attributes of (Jonsson, 2008):
• Customer assistance • Time • Expenses • Adaptability • Capitals • Circumstances
12 Financial terms are important in measuring supply chain performance as Christopher (2005: 83-87) emphasize on R&D and brand recognition, cash flow, Return On Investment, and balance sheet financial terms. Due to importance of these monetary and non monetary performance factors both of them will be discussed here.
• SCOR model and performance
Measurement is useful for audit, check, and performing logistics actions (Bowersox et al, 2007). SCOR model and its process performance measurement has found implication for many areas of interest in firms like sales and advertisement; marketing and customer relationship management; new product and service development (Cavalieri et al., 2007 and references therein). They said this performance is the one which holds efficiency and effectiveness; short term and strategic programs; operative and vital decisions and other important managerial issues of the company. Their representative (organized top-down structure) performance measurement model has five stages. Beginning with business level for considering overall after sales financial performance; followed with process level in which roles and responsibilities regarding to supply chain activities for after sales services are discussing; carry forward with activity level where front office and back office after sales performance is being considered in terms of reliability, responsiveness to customers, lead time, waste and cost management and utilization of total assets; finally the fifth level that respective researchers came to innovativeness and development in terms of Research and development, Human resources utilization and Information technology (Cavalieri et al., 2007:442). Zairi (1994) introduced change management as one of other usage of SCOR model in supply chain performance. The main parameter in change management is accelerating of technologies in supply chain, especially in port of information technology and improvement in Internet awareness through customer base needs.
2.4.2 Financial performance
In recent recession, the importance of decreasing the costs has been highlighted more. Logistics can play an important role for decreasing costs to keep the performance high.
One of the parts of performance is financial performance. The financial ratios can be used to construct the financial items (Pinches et al, 1972) of the financial performance. Financial ratios
13 derived from income statement and balance sheet adapted from Carlsson 2000; cited by Söderberg (2009) are: Cash Flow, Growth Profit Margin, ROI, ROA, Profit Margin, Inventory turnover. These are important terms that comes from five mostly spoken financial indicator groups of: sales growth, profitability indicators relating to income, return on assets, inventory turnover, and cash flow (D'Avanso Von Lewinski and Van Wassenhove, 2003; hour-hour and Williams, 2000; Bowersox, Closs and Cooper, 2007; cited by Söderberg, 2009). The point is that these ratios are the most common ones, but there is not any standard for some of them due to inability to find overall accepted denominators (Lindberg, 2009).
ROI as the ratio of the met income over the total assets (Jacobson, 1987) is one of the most important measures for business performance. ROA is the other scales for measuring performance and it is the ratio of operating income to the average of the operating assets (DeBruine and Sopariwala, 2006). Cash flow is the summation of net income, depreciation, amortization, and depletion (Ball and Brown, 1968, Beaver and Dukes, 1972; cited by Rayburn, 1986). Inventory turnover shows how successfully the firm could sell its inventory and it is a standard to check inventory performance (Gaur et al, 2005). Cost of Goods Sold is an operational identity of the firm (Frazier and Howell, 1983) and gross income is the income before subtracting depreciation and maintenance costs (Kalecki, 1938). Meanwhile due to approximation depreciation, the net income is not reliable (Kalecki, 1938). Operating income is the income of the company due to its different activities before accounting taxes (Grubert, 1998). Sales growth is an important factor for companies and it can be assessed in percent of changes in the net sales (Batt, 2002)
These following financial ratios have been adapted from Söderberg (2009):
Sales growth: the difference current year net sales and the prior year, [(net sales of current year-net sales of the prior year)/the net sales of the prior year]
Cash flow: cash flow related to the outstanding debts, visualize the ability to handle the
outstanding debts with the operation profits [cash flow/ outstanding debts]
Inventory turn: [the sum of inventory/net sales]
Cost of Goods Sold (COGS): [net sales-(purchasing + cost of the employees (wages etc.)] Gross margin: the profit per sold Swedish krona before writing of the assets like expensive
14
Operating margin: the profit after writing of assets [the income after writing of the assets/net
sales]
Net margin: the profit per sold Swedish krona after all expenses taken and includes the
consequences of the capital structure through costs of interest. [The income after financial items/net sales]
ROA: return on assets, [(The income after writing of the assets + positive financial items) / the
total capital]
ROI: return on investments, measures profitability in relation to the capital instead of the
income. It can be used to compare with other alternative to invest your money, like the stock market etc, [The income after financial items × (1-taxes) / own capital]
2.5 SMEs
SMEs play a crucial role in market especially during recession of market and when domestic growth is limited (Lages and Montgomery, 2004). There is not a widespread accepted definition for SMEs around the world, instead some considered number of employees (Lages and
Montgomery, 2004); the other group considered deficiency of financial resources against large enterprises (Goldberg and Jonsson, 2009).
SMEs are not subsidiaries, they are independent firms, but the number of employees will not follow a common and certain rule around the world. Instead every country defined its
classification for number of employees for SME. Based on EU definition SMEs have less than 250 employees, US classification consider less than 500 employees while some countries set limits for 200 employees while the rest have not any clear definition for number of employees in their SMEs (Organisation for Economic Co-operation and Development, 2009). In addition thesis written on Swedish SMEs usually consider less than 500 (Petrovski and Yinjie, 2009). But the European commission definition is also important where they say SMEs are enterprises with less than 250 employees, turnover less than 50 million Euros and annual balance sheet fewer than 43 million Euros (European Commission Enterprise and Industry, 2009). Hence in this work the higher acceptance EU definition will be adopted.
Here in Sweden, there are 58 SMEs per 1000 habitants and they are stronger than EU rivals in finance, internationalization and innovativeness, and homologous to their opponents in
15 entrepreneurship and responsiveness (SBA fact sheet Sweden, 2009) (figure 1). Although
Swedish SMEs in comparison with other EU countries is above average, but their value and job creation is lower (SBA fact sheet Sweden, 2009) (figure 2).
Figure 1: SMEs profile
(Source: European commission, DG enterprise)
Figure 2: Swedish SMEs value, employment and number (SBA fact sheet Sweden, 2009)
Excluding research did by Töyli et al (2008, cited by Söderberg, and Bengtsson, 2009) on 424 SMEs, there are few evidences of researches on SMEs, instead studies directed to large enterprises. So this research is going to be done in the scope of SMEs.
16
2.6 Supply Chain Maturity and financial performance
Nowadays, companies should use their resources and equipments effectively and productively in case they want to be successful in competitive globalized economy. Measuring the performance can support their competitiveness. There are lots of studies that show the importance of supply chain management in financial performance measurement. Kazan et al (2006) used a multiple regression analysis method to reveal the effect of quality and “cost and flexibility”, as two main indicators of manufacturing strategies, on financial performance. Skrinjar et al (2008) proved that business process orientation leads to better non-financial performance and indirectly to better financial performance. They believed that building appropriate relations with stakeholders like as employees, customer and suppliers can result in increasing the stakeholder wealth. They divided organizational performance into two separate parts of financial performance (FP) and non-financial performance (NFP). While measuring ROA and value added per employee are considered as two conceptual items of financial performance, relationship with supplier, net fluctuation with employees, customer complaints number, and some other factors are defined as non-financial items. Improved efficiency and customer satisfaction are parts of TQM and operating income, net sales, revenues, cash flow and the others will comprise the financial performance. An empirical reexamination of the link between TQM and financial performance was done by Stewart (1997).
There is a link between supply chain and financial performance (D’Avanzo et al, 2003). They showed empirically that supply chain excellence through implementing sophisticated supply chain plans will result in supply chain excellence and this improvement define in terms of financial performance. They could demonstrate that these improvements in supply chain management will result is shareholder equity in terms of inventory turnover, cost of goods sold, return on assets.
They revealed that competitive advantage of the companies derived from supply chain management. Hence integrated models of supply chains that incorporate internationally accepted business processes are demanded by companies to improve their performance. These models have to have the ability to deal with customer side, supplier side, new product development, and also logistics activities (D’Avanzo et al, 2003). Hence models like supply chain maturity model can be defined as the examples of world class integrated models that can improve the financial
17 performance of the company. This theory shows how the link between the supply chain improvement programs (in here supply chain maturity) can improve the financial ratios like, ROA, Revenue, COGS, ROA. There are also some other literatures that demonstrated the SCOR processes impact on financial performance. Huan and Sheoran (2004) showed this impression by focusing on market analysis, as an indicator of cost efficiency. Customer buying behavior is conceptual part of market analysis for change management in industries. Hence an intimate relation with customer and designing a supply chain tailor to transfer profit to each customer portion. Market analysis is considered as a main input to the future strategy decision of the SCOR model and weighed up in value-added customer productivity (Huan and Sheoran (2004). Furthermore, total logistic management cost and warranty cost are other criterions that they are analyzed and measured in SCOR model precisely (Huan and Sheoran 2004). As a deduction of the discussion this hypothesis can be extracted:
H1: maturity of supply chain has positive effect on current financial performance
2.7 Prior year financial performance and current year financial performance
TQM theory stated here to show why the effect of prior year financial performance has been considered on current year financial performance, together with why the average of financial performance indicators are chosen to study the prior year financial performance results.
2.7.1 TQM theory
York and Miree (2004) demonstrated direct and positive impression of TQM on financial
performance. They not only discussed about financial performance improvement but also gradual financial progressions were discussed both before and after Baldrige and state quality award winning. These are two TQM qualification certificates admit to factories which implement TQM successfully. Sales, market share and quality were considered as financial performance criterions while customer satisfaction and improved efficiency determined TQM implementation success in this model. This research was divided into three conceptual categories with a wide variety of time frame, factory sizes and the other important issues. Then a system comparison among all is done during 10 years before and after winning the quality award and Baldrige were carried out.
18 In reality, the most important reasons behind of this purpose is show the dyadic relation between financial performance and TQM gradual improvement in certain time and show the influence of both former and next years on financial performance. This theory has been derived to pure financial accomplishments to show the effect of prior year financial performance on current year financial outcomes.
Summon the discussions for prior year financial performance effect on current year and also TQM theory another hypothesis can be formulated as:
H2: financial performance of prior years has positive effect on financial performance of current
year
2.7.2 The importance of average effect
Although (Christensen et al, 2007) discussed the importance of current variance of supply chain lead time on financial performance in comparison with average of it, but considering the average effect can disclose some total effects. Moreover average of ROI, profit, and return of sales have also been used in supply chain management studies (Claycomb et al, 1999). Variance and average effects can be applied to supply chain processes studies (Christensen et al, 2007).
2.8 Research Model and Hypotheses
Remembering the prior mentioned hypotheses in section (2.5) about the effect of supply chain maturity on financial performance (H1), and also section (2.6) for the effect of prior year financial performance on current year financial performance (H2), there are two different hypotheses. The cumulative effect of these two different hypotheses also is interesting to consider and it can address the purpose of this research precisely. Consequently the third hypothesis will be the effect of supply chain maturity together with financial performance of prior years, on financial performance of current year.
H3: maturity of supply chain processes and financial performance of prior years have positive
19 Figure 3: Research model including hypotheses (source: authors, 2009 based on Söderberg, 2009)
20
Chapter 3
Methodology
This part aims to show different data collections and data analyze methods which applied for this thesis. Further more research method and sampling method will be carefully described.
3.1 Data collection
Within this thesis authors benefited from a wide variety of books, data bases, journals and software in order to gather essential data and information. In addition several face-to-face or email discussions are done with Professor Lars Bengtsson the supervisor, Peter Lindberg the accounting expert, and Lennart Söderberg as the author of one related previously published thesis. Data collected from quantitative data in 15 SMEs in Gästrikland. Authors are following Söderberg (2009) research in which he tried to assign the level of supply chain maturity and their relations with financial performance in theses above mentioned factories by doing several case studies, questionnaires and interviews with mainly the logistic managers or CEOs. All financial performance and SCM maturity criteria were already calculated and applied in this thesis as required data. All of SMEs factories analyzed in this thesis were selected from the same cluster, steel industry, while they have different business specification as well. Then all relations
between financial performance and maturity model were evaluated bystatistical software. After finding the definition of financial ratios, extracting data for the cluster of metal industry was done from database. Criterions like name, place, and number of employees gave confirmation to find the right companies from list of companies. Then 15 companies distinguished from the cluster of steel industry in Gästrikland3. For checking the effect of supply chain maturity on financial performance of the company, researchers tried to find the respective value of each indicator for every firm during time to check the gradual effect of the maturity of supply chain over financial performance during years of establishment of that company.
21
3.2 Research Method
This research is quantitative research in term of methodological approach and followed deductive approach in term of theoretical view. It also can be considered as both casual and exploratory research, in relation to its research method, due to some reasons as following:
3.2.1 Deductive or Inductive approach4
Deductive approach start from more general and will be ended to more specific conclusion. First an already known theory is broken down to one or more hypothesis then it is narrowed down to gather observation in order to address hypotheses. This stage gives capability to verify
hypothesis by observations which finally might lead to confirmation. In the opposite side, inductive approach follows a contrast concept. Specification observation will be more
generalized to hypothesis and theory. Here was all-out effort to collect applicable information and tools to address three hypotheses, as in aim of study cited. As matter of fact, firstly
hypotheses were well introduced and then our observation in frame of statistical calculation was done and hypotheses were verified through these kinds of observation. So a deductive approach was followed from up to down, hypotheses to confirmation.
3.2.2 Quantitative Research5
Research, as a quantitative one provided a systematic investigation from financial performance and maturity level of a steel industry cluster companies and efforts to demonstrate three
statistical hypotheses. Quantitative data from the maturity level and SC performance from 15 companies were gathered through questionnaires and interview. In the other sight all key ratios and financial performance were brought from Bolagsverket6 financial database. As above
mentioned, this research is synthesis of Söderberg (2009) and data collection are mostly relied on questionnaires and interviews which already carried out.
4
This section has been adapted from Walliman (2005, chapter 4)
5
This section has been adapted from Walliman (2005, chapter 7)
6
22
3.2.3 Casual research
This research will evaluate the impression of one variable or factor on another variable. It allows us to know whether two parameters can be influenced each other and how much they can have dependency on each other. In the hypothesis 1, 2, and 3, the main goal is to demonstrate the positive effect of prior year financial performance and supply chain process maturity on financial performance of current year. As matter of fact, changes of financial performance of prior year, supply chain process maturities result in changes of financial performance. It should not be forgotten to take consideration that some other variables may be influenced on maturity level and financial performance of current year but financial performance of three former years were considered as a most influential variable.
3.2.4 Type of Data
This research used secondary data of financial database (Bolagsverket) and also data collected from questionnaire about supply chain process maturities (Söderberg, 2009). Financial ratios of 15 non-randomly selected SMEs from their balance sheet and income statement extracted for years of 2006, 2007, and 2008. There were also data of questionnaire about plan, source, make, and deliver processes of these companies.
3.3 Data analyze
Data analysis of this research has been done with help of SPPS software. First data has been cleaned to find the outlier cases. After removing them the descriptive statistics was done to find basic information like mean and standard deviation of the data. In the next phase those correlated items chosen to test the regression among them. The test of regression helped to extract the regression equation and regression model. This estimates in this regression model checked with type I error (α ≤ 0.05) to find the significant ones. In other words Chi Square (χ2
) used as the power of estimation and whenever the error was lower than 0.05 the effect has been considered significant, otherwise rejected. These regressions used to check the answer to the hypotheses test.
23
3.4 Reliability and Validity
This research is a continuation of a research did by Söderberg (2009). In this research we used the data collected in prior research. Therefore we rely on data collected from validated
questionnaire. Moreover we did correlation test to find out the correlated variables and not all the variables used in the study. Choosing correlated variables and working with them ensured the validity of the research even more. Nevertheless the study has limitation of 15 companies in sample size that make quantitative analysis difficult.
24
Chapter 4
Data Analysis
The purpose of this chapter is to analyze the proposition made in the literature review about the effect of supply chain maturity and financial performance of prior years on financial
performance of current year.
4.1 Data analysis (SPSS)
7Analysis of these quantitative data can be done with help of correlation and regression. Referring back to the hypothetical model, and due to direct effect of each factor (financial performance of prior years, supply chain maturity of current year) on dependent factor (financial performance of current year) regression analysis is recommended. But, before running regression analysis correlated indicators should be found to test their regression. Otherwise regression analysis is meaningless.
4.1.1 Descriptive Statistics
Mean, standard deviation, and variance have been calculated for financial performance of current year, financial performance of prior years, and supply chain maturity. Following tables (2, 3, and 4) show the results of descriptive statistics. They show the variance and deviation of data from mean and also skeweness of indexes.
25 Table 2: Descriptive statistics of supply chain maturity
Source (Author 2009 with SPSS)
PLAN SOURCE MAKE DELIVER SCMM
N Valid 15 15 15 15 15 Missing 3 3 3 3 3 Mean 90.6000 39.9333 50.7333 75.9333 257.2000 Std. Error of Mean 6.57687 2.46396 3.41072 3.96469 15.52669 Std. Deviation 25.47211 9.54289 13.20966 15.35516 60.13461 Variance 648.829 91.067 174.495 235.781 3616.171 Skewness -.781 .096 -.693 .789 -.408 Std. Error of Skewness .580 .580 .580 .580 .580
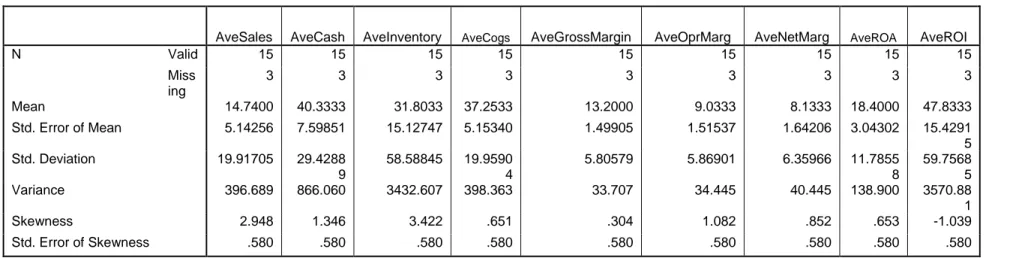
Table 3: Descriptive statistics of financial performance of prior years
Source (Author 2009 with SPSS)
AveSales AveCash AveInventory AveCogs AveGrossMargin AveOprMarg AveNetMarg AveROA AveROI
N Valid 15 15 15 15 15 15 15 15 15 Miss ing 3 3 3 3 3 3 3 3 3 Mean 14.7400 40.3333 31.8033 37.2533 13.2000 9.0333 8.1333 18.4000 47.8333 Std. Error of Mean 5.14256 7.59851 15.12747 5.15340 1.49905 1.51537 1.64206 3.04302 15.4291 5 Std. Deviation 19.91705 29.4288 9 58.58845 19.9590 4 5.80579 5.86901 6.35966 11.7855 8 59.7568 5 Variance 396.689 866.060 3432.607 398.363 33.707 34.445 40.445 138.900 3570.88 1 Skewness 2.948 1.346 3.422 .651 .304 1.082 .852 .653 -1.039 Std. Error of Skewness .580 .580 .580 .580 .580 .580 .580 .580 .580
26 Table 4: Descriptive statistics of financial performance
Source (Author 2009 with SPSS)
Cash Flow InventoryTurn COGS
Gross Margin
Operating
Margin Net Margin ROA ROI
N Valid 15 15 15 15 15 15 15 15 Missing 3 3 3 3 3 3 3 3 Mean 37.0667 25.5200 37.8333 12.7333 9.2667 8.6000 19.6000 46.3333 Std. Error of Mean 8.35775 9.94679 5.29068 1.94561 1.83476 1.95131 3.81076 21.36590 Std. Deviation 32.36944 38.52374 20.49072 7.53531 7.10600 7.55740 14.75902 82.74977 Variance 1047.781 1484.079 419.870 56.781 50.495 57.114 217.829 6847.524 Skewness 1.812 3.172 .591 .625 .867 .771 .689 -1.556 Std. Error of Skewness .580 .580 .580 .580 .580 .580 .580 .580
27
4.1.2 Inferential Statistics
This section is consisted of correlation analysis and regression analysis. In first correlated variables have been extracted then those which had correlations were chosen to do test of regression.
• Correlation Analysis
Correlation helps to understand the relation among variables. Bivariate correlation use pairwise associations (two variables of all cases chosen for correlation). Pearson bivariate correlation has been chosen here. Although Spearman correlation does not need to transform variables
(logarithm transform to prevent outliers), but Pearson helps to uncover the reason behind weak association between two variables and then finding the room for improvements.
In order to find if data are following normal distribution, outliers should have been found, hence with help of SPSS and Scatter plot, data were mapped on the X-Y axis where they labeled with respective case numbers and outliers derived for each of pair variables. Then in the next step common outliers took out (note that this option works with many variables in X and many of them in Y in one time). These variables also do not have an ordered pattern, otherwise Kendall’s tau-b or Spearman fitted better. Due to the fact that the associations among variables were
proposed in the base model, like increasing of the independent result in decreasing / increasing of the dependent, so one-tailed association have been chosen for test of significance. In the
following tables those cases which did not show correlation with the other cases removed from the sample. Then correlations without these outliers calculated. The former table shows the correlation among supply chain process maturities and financial performance and the latter shows the correlation among financial performance of prior year and also current year. These correlated variables use in analysis of regression.
28 Table 5: Corrected correlation among supply chain maturity indicators and financial performance (without outliers)
Source (Author 2009 with SPSS)
Sales Growth
Cash
Flow InventoryTurn COGS
Gross Margin
Operating Margin
Net
Margin ROA ROI
deselected cases PLAN .163 .073 -.710** .351 .225 .234 .202 .111 -.020 10 .289 .403 .002 .109 .220 .210 .245 .353 .473 14 14 14 14 14 14 14 14 14 SOURCE .263 .028 -.460* .499* .256 .270 .247 .183 .206 10 .182 .462 .049 .035 .189 .175 .198 .266 .240 14 14 14 14 14 14 14 14 14 MAKE -.035 -.066 -.698** .338 .148 .126 .088 .002 -.088 10 .453 .411 .003 .119 .307 .334 .382 .497 .382 14 14 14 14 14 14 14 14 14 DELIVER .028 .054 -.661** .468* .278 .323 .297 .235 .127 10 .462 .428 .005 .046 .168 .130 .151 .209 .333 14 14 14 14 14 14 14 14 14 SCMM .110 .034 -.693** .420 .239 .251 .219 .136 .037 10 .354 .454 .003 .067 .206 .193 .226 .322 .450 14 14 14 14 14 14 14 14 14
29 Table 6: Corrected correlation among financial performance of prior year and financial performance of current year (without outliers)
Source (Author 2009 with SPSS)
Sales Growth
Cash
Flow InventoryTurn COGS
Gross Margin
Operating Margin
Net
Margin ROA ROI
deselected cases AveSales .286 -.363 .678** -.344 -.423 -.377 -.333 -.357 -.100 10, 12 .171 .111 .005 .125 .075 .102 .133 .115 .372 13 13 13 13 13 13 13 13 13 AveCash .555* .943** .079 -.015 .820** .818** .828** .850** .566* 10, 12 .025 .000 .399 .480 .000 .000 .000 .000 .022 13 13 13 13 13 13 13 13 13 AveInventory .346 -.301 .799** -.521* -.393 -.341 -.298 -.312 -.067 10, 12 .123 .159 .001 .034 .092 .127 .161 .149 .413 13 13 13 13 13 13 13 13 13 AveCogs -.257 -.091 -.527* .953** .174 .226 .199 .213 .153 10, 12 .198 .384 .032 .000 .285 .229 .257 .242 .309 13 13 13 13 13 13 13 13 13 AveGrossMargin .267 .554* .019 .496* .768** .774** .777** .828** .787** 10, 12 .189 .025 .475 .043 .001 .001 .001 .000 .001 13 13 13 13 13 13 13 13 13 AveOprMarg .289 .315 .040 .604* .564* .681** .696** .733** .795** 10, 12 .169 .147 .449 .014 .022 .005 .004 .002 .001 13 13 13 13 13 13 13 13 13 AveNetMarg .416 .782** .031 .560* .823** .942** .956** .964** .855** 10, 12, 13 .090 .001 .462 .029 .001 .000 .000 .000 .000 12 12 12 12 12 12 12 12 12 AveROA .341 .218 .324 .354 .376 .541* .574* .614* .736** 10, 12 .127 .237 .140 .118 .102 .028 .020 .013 .002 13 13 13 13 13 13 13 13 13 AveROI .295 .256 -.026 .088 .259 .491* .557* .506* .816** 13 .153 .189 .465 .382 .186 .037 .019 .033 .000 14 14 14 14 14 14 14 14 14
30
• Regression Analysis
In this step using the correlated variables the way of finding the regression equation has been made easy. Based on the functionality of SPSS that it works with single value of each
independent variable, average of financial performance of (2007,2006) has been adopted for each financial ratio of prior year (e.g. Sales growth Prior Years = Average (Sales growth 2007, Sales growth 2006 and etc.). It is obvious that one dependent variable can be tested at once.
The regression analysis revealed that there is positive regression among financial performance and financial performance of prior years and supply chain maturity.
The coefficient of determination ‘R-square’ shows that 97% of COGS can be described by the independent variables. These independents are Cost of Goods of Prior Years, Sourcing, and Delivering.
Also R-square for inventory turnover is 0.174. Although this number predict partial relationship among this indicator, and financial performance of prior years and supply chain maturity, but these independent variables effects are not significant.
In the next chapter we start discussion about these indicators. Regressions are in (table 7, 8, 9). These tables help to investigate the hypotheses in the beginning of the chapter. Maturity of supply chain (table 7) has partial effect on current financial performance (H1). This effect is not strong because only source has effect on inventory turnover and also there is COGS which the effect on it is not meaningful. The rest of financial ratios did not show significant correlation and of course regression. Table (8) shows financial performance of prior year has positive effect on current financial performance (H2). This effect is strong because nearly all of the financial ratios of current year are in regression with independent variables except inventory turnover. The total effect (table 9) of supply chain process maturities and prior year financial performance variables partially exists on the financial performance of the company in current year (H3).
31 Table 7: regression among supply chain maturity and financial performance
Current Financial Performance (Dependent) variables Supply Chain Maturity Effects of/on Inventory Turnover COGS Plan Source (1.575)* 0.364 Make 0.570 Deliver 0.012 0.160 SCMM (-2.714) Adjusted R2 0.641 0.122 ΔR2 0.752 0.257 F 6.814 1.899
*: significance < 0.05; **: significance < 0.01; *** significance < 0.005 Method: Enter, all independent factors effects at the same time
32 Table 8: regression among financial performance of prior year and current year
Current Financial Performance (Dependent) variables
Effects of / on Sales Growth Cash Flow COGS Inventory Turnover Gross Margin Operating Margin Net Margin ROA ROI P ri o r Y ea r F in a n ci a l p erf o rm a n ce R at ios AveSalesGrowth (-0.333) AveCashFlow 0.555* 0.967*** 0.567* 0.821** 0.798** (0.766)** 0.235 AveCOGS (0.739)** (-0.019) AveInvTurn -0.089 1.095 AveGrossMarg (-0.039) -0.296 0.660 (-0.529) (-0.483) (-0.308) 0.381 AveOprMarg 2.001 1.437 2.189 1.397 1.870 -0.870 AveNetMarg (-1.526) (-1.731) -0.684 0.045 (-0.731) 1.467 AveROA (-0.773) (-0.719) (-0.509) (-0.769) AveROI --- --- --- 0.713* Adjusted R2 0.245 0.869 0.897 0.546 0.751 0.780 0.788 0.865 0.872 ΔR2 0.308 0.891 0.940 0.659 0.834 0.872 0.876 0.921 0.936 F 4.886 40.793 21.888 5.803 10.046 9.514 9.930 16.315 14.671
*: significance < 0.05; **: significance < 0.01; *** significance < 0.005 Method: Enter, all independent factors effects at the same time
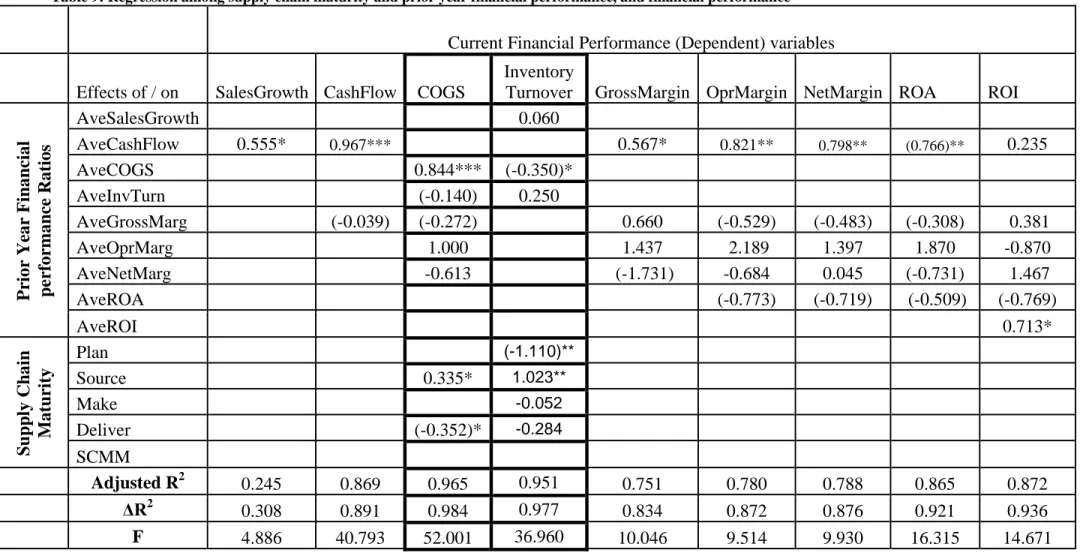
33 Table 9: Regression among supply chain maturity and prior year financial performance, and financial performance
Current Financial Performance (Dependent) variables Effects of / on SalesGrowth CashFlow COGS
Inventory
Turnover GrossMargin OprMargin NetMargin ROA ROI
P ri o r Y ea r F in a n ci a l p er for m an ce R at ios AveSalesGrowth 0.060 AveCashFlow 0.555* 0.967*** 0.567* 0.821** 0.798** (0.766)** 0.235 AveCOGS 0.844*** (-0.350)* AveInvTurn (-0.140) 0.250 AveGrossMarg (-0.039) (-0.272) 0.660 (-0.529) (-0.483) (-0.308) 0.381 AveOprMarg 1.000 1.437 2.189 1.397 1.870 -0.870 AveNetMarg -0.613 (-1.731) -0.684 0.045 (-0.731) 1.467 AveROA (-0.773) (-0.719) (-0.509) (-0.769) AveROI 0.713* Suppl y C ha in M a tu rity Plan (-1.110)** Source 0.335* 1.023** Make -0.052 Deliver (-0.352)* -0.284 SCMM Adjusted R2 0.245 0.869 0.965 0.951 0.751 0.780 0.788 0.865 0.872 ΔR2 0.308 0.891 0.984 0.977 0.834 0.872 0.876 0.921 0.936 F 4.886 40.793 52.001 36.960 10.046 9.514 9.930 16.315 14.671
*: significance < 0.05; **: significance < 0.01; *** significance < 0.005 Method: Enter, all independent factors effects at the same time
34
Chapter 5
Discussion
Discussion consisted of discussion on results of descriptive and also inferential statistics. In this chapter all estimates and calculations are based on SPSS.
Recalling the TQM theory from chapter 2 shows prior propositions are applicable here. Results of regression among prior financial performance and current year ones reveal the implication of TQM theory. This theory says success is a result of continuous improvement. Results support this proposition and showed positive effect of prior year ratios on current year ratios.
5.1Descriptive statistics
Standard deviations table (4) of gross margin, operating margin, and net margin are in a same range while cash flow and inventory turnover differentiation from mean is near. In here ROI has the highest differentiation from mean (82.749) while operating margin has the lowest (7.106). Accordingly companies of steel cluster are highly separated from each other in their return on investment while they have same profit after depreciations.
Using average is not only recommended in the literatures, but also results of table (3) show that they do not have big variance too. It means that the scales are the same for each variable (Gravetter and Forzano, 2009).
5.2 Inferential statistics
There are three different hypotheses originated from the research question. These research questions were investigated in analysis part (chapter 3) and in here the detail discussion about them with help of different literatures are stated.
5.2.1 Supply chain maturity effect on financial performance
Among the financial performance indicators, Inventory turnover and COGS have correlation with Source and SCMM. Source has strong effect on inventory turnover (1.575). It means
35 success in finding suppliers and having partnership with them will result in increasing inventory turnover. Inventory turnover shows how much is the revenue of selling the inventory of the company. Hence sourcing strategies and processes will result in finding high quality and costs saving products that at the same time help the steel company to sell the products or the inventory in better price and consequently have better inventory turnover.
It is also in alliance with what Christensen et al (2007) showed about the effect of decreasing supply chain lead time in improving financial performance. They stressed on Just-In-Time (JIT) as a solution for decreasing lead time.
Supply Chain Management Maturity (SCMM) also affects inventory turnover (-2.714), although its alpha is a bit higher than (alpha = 0.05), but describing the effect is also important. SCMM in this research is the total effect of plan, source, make, and deliver. This SCMM take advantage from the source that already has effect on inventory turnover, so this effect seems reasonable, but the negative sign describes the negative effect and it is hard to justify. In other words improvement of the supply chain process maturities inversely affect the turnover of inventory. Accordingly hypothesis 1 is supported weakly.
5.2.2 Financial performance of prior years effect on financial performance of current year
Table (6) shows that there are correlations among cash flow, COGS, gross margin, net margin, ROA, and ROI. Among them cash flow of prior years has the strongest correlation with current financial performance of companies. It seems reasonable that as much as the amount of money flow to the company is higher the company will have better achievement at the time. Cash flow, COGS and return on investment changes of prior years directly affect the cash flow, COGS and ROI of current year. Hence the industries that had acceptable return on their investment in prior years are keeping on earning. Table (8) shows that cash flow can be described by cash flow of prior year, gross margin, and net margin. Therefore hypothesis 2 is empirically supported.
36
5.2.3 Effect among supply chain maturity and prior years financial performance, and current financial performance
In here the total effect has been considered. There are two constructs. One is supply chain maturity and the other is financial performance of prior years. Effects of these factors on financial performance of the company have been considered. Discussions are based on regressions in table 9.
• Sales Growth
Sales growth of current year can be described by cash flow of prior years, but not with help of supply chain process maturities. It is reasonable that growth of sales compare to prior year be a function of the amount of money came in and out from the company. The positive and strong cash flow shows that more money came into the company when the company paid the debts and other costs and expenses, so this money used to invest in company sales. This finding is in accordance with Lehn and Poulsen (1989) who talks about the effect of high cash flow on sales growth.
• Cash Flow
Cash flow can be predicted strongly (Chi-square=0.869) with cash flow (β = 0.967***). Debate of (Barth et al, 2001) about predicting future cash flow based on current cash flow and other factors can be applied here. They described that earnings, amortization, depreciation, inventory, and cash flow of current year have effect on cash flow of future. Thereupon this literature based assumption has been shown empirically that flow of cash in the company in prior years will result in increasing the amount cash flowing in the company in the next year.
• Cost of Goods Sold (COGS)
Opposite to the destructive effect of above mentioned financial ratios besides of supply chain maturity processes, total effect of these ratios improved the significance of SCMM processes on defining COGS. Ergo, standalone insignificant effect of source (0.364) and deliver (0.160) on COGS become significant (0.335*), (-0.352*) respectively. This is one of the most important
37 findings of this research that total effect of considering supply chain process maturities and financial performance will result in improving financial performance. In this research it is demonstrated that this improvement appears in integration of sourcing and delivering process maturities together with COGS of prior years in improving COGS of current year.
Having a look on the research did by Lambert and Pohlen (2001) will describe this effect better: More appropriate sourcing result in in-stock availability of goods and result in decreasing the cost of goods sold. Furthermore having precise planning will result in better scheduling of required man, machine, and material and this forecasting improvement decrease the COGS. They also showed that pushing inventory backward (to the supplier) will result in improving overall performance through decreasing costs. These are costs of production, transportation, order, and sales. Seeing that COGS are the cost of purchased raw materials or finished products, so it exists among supplier and customer. Applicable example is the Supplier Managed Inventory (SMI) that will decrease the cost that in it the nominated supplier take care of the supply and decrease the amount of sourcing, and delivery activities. For the effect of prior COGS on current COGS the previously discussed idea of current cash flow as a function of prior cash flows (Barth et al, 2001) will be used here. Yearly decreased COGS will result in decreasing COGS of the next year. In today economy recession the results of survey did by Accenture and Stanford university (D’avanzo et al, 2003) still is useful to show the driver of the companies still is to decrease costs. Therefore this is a loop of success that existing members do not like to leave and the others want to fall into it. On the account of this work and also empirical finding, not only the effect of sourcing, and delivering processes improvement in decreasing COGS will become clearer, but also debate will rises that why the other processes like plan, and SCMM could not demonstrate this effect. Deeper look to Lambert and Pohlen (2001) shows that although in this research the effect of supply chain maturities (source, deliver) and high financial performance (COGS) of prior years could be described on financial performance (COGS) of current year, but the success have not achieved totally. Researchers are encouraged to do empirical researches to show full support of supply chain maturity on more financial ratios.
• Inventory turnover
Although there is strong effect among the inventory turnover and financial performance of prior years and supply chain maturity indicators, but from the financial performance of prior years
38 only COGS of prior year showed significant and negative regression (-0.350*) with current inventory turnover. In addition are plan (-1.110**) and source (1.023**) which have significant regression with inventory turnover. Although sales growth and inventory turnover of prior years’ show correlation, they are insignificant. The result Hence in future researches more statistical works is needed here that future researches are encouraged to be done here.
• Gross Margin
The effect of fluctuations of gross margin on cash flow has been described already (Barth et al, 2001), but this study could show that cash flow is also has effect on gross margin. Positive cash flow shows that company had positive liquidity of cash in and this money can be used for production in manufacturing firms. Gross margin is the money comes from production and it is the income divided by net sales. The company which has higher amount of money has better available resources and can produce better and build a positive sales growth meanwhile it is the improvement in company income. Having high cash flow and also better revenue has been considered as performance indicators (Robins, 1993). He showed in a study about studio films that this higher performance results in higher gross revenue and also revenue out of production costs.
But the effect of gross margin (0.660), operating margin (1.437), and net margin (-1.731) of prior years were insignificant in forecasting the current gross margin.
Operating margin is the income of company operations before taxes. If company acted very well in the prior years they need to have better margin of gross income. Due to the fact that, company operations usually are productions and the ability to produce more will result in higher revenue not only in the current year but also in the prior years. Accordingly this factor and also continuation of achieving high gross income, and also net income (after tax) should have had effect on current gross margin. Therefore future researchers are encouraged to define it more or try to describe it empirically how this relation can be proved.
• Operating margin
Cash flow of the prior years have effect (β = 0.821**, Chi-square = 0.780) on operating margin of current year. Healy et al (1992) showed the effect of operating income on cash flow in merged