Assessing a restaurant service
quality using the DINESERV model
A quantitative study on Pizza Hut
Habtamu Wondawek Abezie
Department of Business Administration Master's Program in Marketing
Abstract
Customers are the main reason behind every companies’ survival in the market. And winning their interest has now become the concern for company owners and managers as well. However, many factors can affect the customer's satisfaction in the marketing environment. Among the determinants, service quality takes the most substantial part. Many Scholars have also identified the underlying relationships between these two constructs. Notably, the perception-expectation gap is a useful cue to determine their link. Thus, this research mainly relies on uncovering the customer's perception of service quality. As a result, the study is conducted in one of the biggest chain restaurant named Pizza Hut. And the author chooses the research location to be in Uppsala.
Purpose
This study has two-fold research purpose in that it aims at measuring the perception of customers in the restaurant industry and examining the validity of DINESERV in Sweden's cultural context.
Design/Methodology/approach
The author has employed a convenience sampling technique to conduct the research and pre-developed questionnaires from the so-called DINESERV instrument. Additionally, factor analysis and Cronbach's alpha were used to check the validity and reliability of the model, respectively. The gap score was also computed using the means. Then finally, a spearman's correlation coefficient was calculated to test the strength of the relationship between the customer's satisfaction and service quality dimensions.
Finding
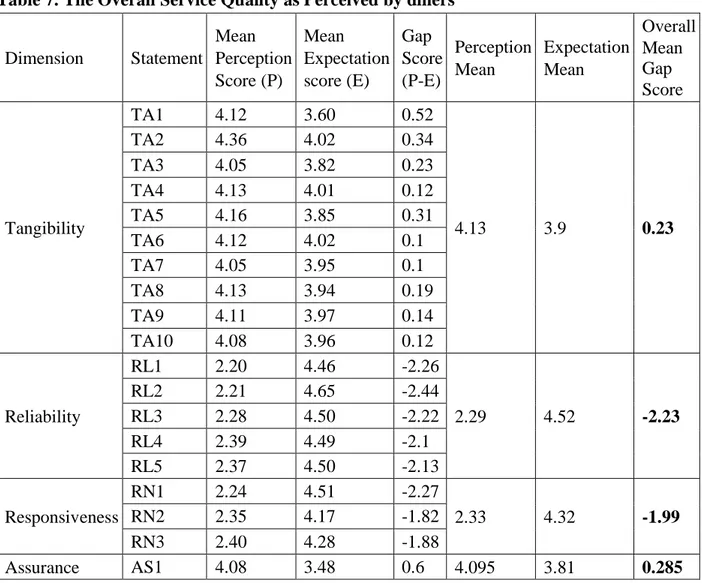
The analysis carried out proved that DINESERV is a valid instrument to measure customer's perception of service quality in Sweden's cultural context. Besides, the correlation between service quality dimension and customer satisfaction were validated using a spearman's rho. Lastly, the result from the gap score indicates that the two dimensions (i.e., responsiveness & reliability) were perceived as inferior by the customers.
Research implications
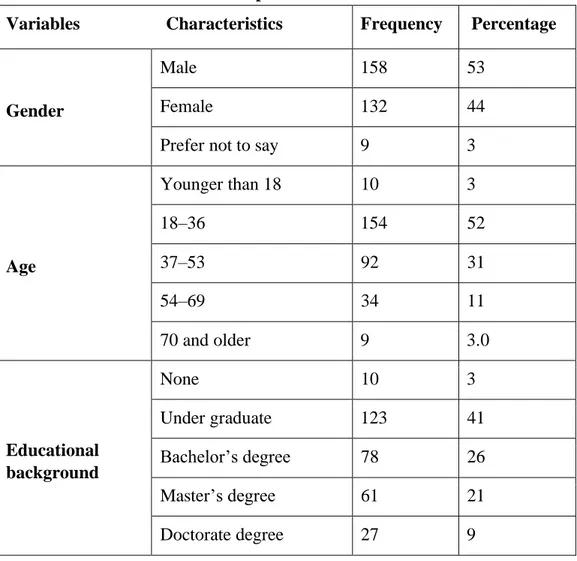
The theoretical finding suggests that DINESERV is the right instrument to measure the service quality of restaurants in Sweden's context. And the practical implication approves that pizza hut in Uppsala has two inferior dimensions that need continuous improvement. Lastly, the demographic characteristics of the respondents show that most of the customers are categorized under the younger age group (i.e., 18-36), and this information can be used for marketing purposes by the company.
Key terms
Cronbach’s alpha measures the internal consistency of an instrument or a scale. It is a reliability test which determine the repeatability of the study.
Factor analysis is a technique that is used to reduce a large number of variables into fewer numbers of factors, and it extracts maximum common variance from all variables and puts them into a common score.
Kaiser-Meyer-Olkin Measure of Sampling Adequacy (KMO) reflects the sum of the partial correlation relative to the sum of the correlation.
Factor loading are part of the outcome from factor analysis, which serves as a data reduction method designed to explain the correlations between observed variables using a smaller number of factors.
Spearman’s rho is designed for the use of pairs of ordinal variables and can also be used when one variable is ordinal, and the other is interval/ratio and it indicates the strength and the direction of the variable’s relationship.
List of abbreviations 1. SERVQUAL: Service quality
2. FAMM: five aspects meal model 3. KFC: Kentucky fried chicken 4. FT: First time
5. FC: Frequent customers 6. OSQ: Overall service quality 7. KMO: Kaiser-Meyer-Olkin 8. TA: Tangibility 9. RL: Reliability 10. RN: Responsiveness 11. AS: Assurance 12. EM: Empathy
Acknowledgment
I want to thank the almighty God and Saint Mary for giving me the strength and wisdom to accomplish this thesis. Without them, this thesis would not be imaginable. They bless me with all the good things in life.
The supervisor Professor Medhanie takes the second credit for being humble and helpful throughout the whole thesis. His support and effort in leading me to the right track was marvelous.
Special thanks also go to Pizza hut employees for helping me distribute the questionnaire and the manager (Therese) was everything to this thesis.
Finally, I want to thank all my family members and friends for supporting and lighting me up with the warm and energetic wishes.
Table of Contents
CHAPTER ONE: INTRODUCTION ... 1
1. Introductory Background ... 1
1.1 Need for researching this area... 2
1.2 Problem formulation ... 2
1.3 Research audience ... 4
1.4 Research objective ... 4
1.5 Research question ... 4
1.6 Delimitation ... 4
CHAPTER TWO: METHODOLOGY ... 6
2. Choice of the subject ... 6
2.1. Research philosophy ... 6
2.2. Research approach ... 8
2.3. Research strategy ... 9
2.4. Research design ... 10
2.5. Data collection method ... 11
2.5.1 Sampling technique and selection of respondents ... 11
2.5.2 Self-completion questionnaires ... 12
2.5.3 Pilot study ... 12
2.5.4 Choice of location ... 13
2.6. Data analysis ... 13
2.7. Ethical consideration ... 15
CHAPTER THREE: LITERATURE REVIEW AND THEORITICAL FRAMEWORK ... 16
3. The concept of Service ... 16
3.1 The concept of Quality ... 17
3.2 Service quality ... 17
3.3 Perceived service quality ... 18
3.4 Customer satisfaction ... 19
3.4.1 Factors affecting customer satisfaction ... 20
3.4.2 The relationship between customer satisfaction and service quality ... 21
3.5 Service quality models ... 22
3.5.1 SERVICESCAPE ... 22
3.5.2 Five Aspects Meal Model (FAMM) ... 23
3.5.4 LODGESERV ... 24
3.5.5 DINESERV ... 25
3.6 The conceptual framework ... 27
CHAPTER FOUR: EMPIRICAL DESCRIPTIONS ... 29
4. Pizza Hut (Uppsala)... 29
4.1 DINESERV Questionnaire ... 29
4.2 Scale of measurement ... 29
4.3 DINESERV dimensions and the question items ... 29
4.4 Questionnaire distribution ... 30
4.5 Coding ... 30
CHAPTER 5: EMPERICAL RESULTS AND ANALYSIS ... 32
5. Demographic characteristics of the participants ... 33
5.1 Gap score analysis ... 33
5.2 Diners satisfaction ... 34
5.3 Reliability test... 34
5.4 Factor analysis of the gap scores between customers expectation and perception ... 35
5.5 Testing the hypothesis... 39
5.6 Summary of findings ... 42
CHAPTER SIX: DISCUSSION, IMPLICATIONS AND SUGGESTIONS ... 44
6. Discussion ... 44
6.1 Conclusion ... 45
6.2 Implication ... 46
6.3 Societal implication ... 46
6.4 Limitation ... 47
6.5 Recommendation for further research ... 47
CHAPTER SEVEN : QUALITY CRITERIA ... 48
7. Reliability ... 48
7.1 Validity ... 48
Appendices ... 1
Appendix I: Questionnaire ... 1
Appendix II: Demographic questions. ... 2
Appendix III: Cronbach’s Alpha table. ... 3
Appendix IV: Pie chart presentation of respondent’s demographic characteristics. ... 4
List of Figures Figure 1: How theory fits into your research……… 9
List of Tables Table 1. Types of research purpose ... 10
Tabel 2. Summary table of the methodology and choice of methods ... 14
Table 3. Tangible service factors ... 21
Table 4. Factors that make up customer satisfaction ... 22
Table 5. Summary of service quality model ... 26
Table 6. Charcteristics of the respondent’s ... 32
Table 7. The overall service quality as percieved by diners... 33
Table 8.1. Reliability statistics... 34
Table 8.2. Reliability statistics of the dimensions ... 35
Table 9.1. KMO & Bartlett’s test... 35
Table 9.2. Total variance explained ... 36
Tabel 9.3. Rotated component matrix ... 38
Table 10.1. Spearman’s rho correlation coefficient for tangibility ... 40
Table 10.2. Spearman’s rho correlation coefficient for reliability ... 40
Tabel 10.3. Spearman’s rho correlation coefficient for responsiveness ... 40
Table 10.4. Spearman’s rho correlation coefficient for assurance ... 41
Tabel 10.5. Spearman’s rho correlation coefficient for empathy ... 41
Table 11. Summary of results ... 41
CHAPTER ONE: INTRODUCTION
The research topic and problem formulation are the central part of this chapter. The introductory background will be the break the ice by familiarizing the topic. Then, the reason for researching this area, the research objective, and the audience of this research will be discussed in detail. Finally, the delimitation of the study will be presented and end the chapter.
1. Introductory Background
Services account for a huge portion of the economic activity in most countries. For example, according to Trading Economics (2019), the GDP From Services in Sweden increased to 563344 SEK Million in the third quarter of 2019 from 558543 SEK Million in the second quarter of 2019. GDP From Services in Sweden averaged 323683.41 SEK Million from 1981 until 2019, reaching an all-time high of 563344 SEK Million in the third quarter of 2019 and a record low of 178733 SEK Million in the second quarter of 1981. Besides, marketing researchers have recognized a shift in companies' business orientation, from a goods-dominant logic to a service-dominant logic (Lusch and Vargo, 2006; Vargo and Lusch, 2004, cited in Guesalaga, (2014, p.145). That is, even in industries typically classified as "manufacturing," the service component has gained importance. All in all, service sectors have now become the most significant drivers of many countries' economies.
Admittedly, there exist customers who are the reason behind the increase in revenue in all the service sectors. If there is no customer, it is evident that there will be no service to be delivered because customers are the very first reason for every company's existence. Be it profitable or non-profitable, companies deliver products and Services for their targeted customers. In general, there is nothing more critical to the success or failure of a business than winning the customers' interest. According to (Shep, 2018), poor customer service is costing businesses more than $75 billion a year. That is up $13 billion since its last report in 2016. In order to succeed, an organization must focus on satisfying or exceeding the requirements, expectations, needs, and preferences of customers (Flott, 2013, p.45). He also mentioned that excellent customer service is the lifeblood of any business, and an organization can offer promotions and slash prices to bring in as many new customers as the company wants. However, unless the company can get some of those customers to come back, your business will not be profitable for long. Because, Good customer service is all about bringing customers back and about sending them away happy—happy enough to pass positive feedback about your business along to others who may then try the Product or Service you offer for themselves, and in their turn become repeat customers (Flott, 2013, p.45).
In the context of a restaurant business, the race to provide better service and value has become increasingly important to monitor customer perceptions of service quality (Nancy & Christina, 2011, p.21). According to Ryu and Han (2010, cited in Oswald, 2018, p.2), restaurateurs that are able to provide quality service to their customers will gain a greater advantage over their rivals in efforts to retain customers and to attain growth and be sustainable. Various scholars have developed service quality models in order to measure customer's perceptions in the hospitality industry. The most widely used model, which is the SERVQUAL instrument, was drafted by Parasuraman et al., (1988), to measure the gap between what customers expect from the service and what they perceive. And this Pre-post experience measures allow assessment of the extent and direction of the gap (Nancy & Christina, 2011, p.21). They were able to identify five
possible gaps that can affect service quality. These are consumer expectation – management perception gap, management perception – service quality specification gap, Service quality specifications-service delivery gap, service delivery-external communications gap, and Expected serviceperceived service gap. In addition, the authors have also identified five service quality dimensions with 22 question items. These dimensions are reliability, tangibility, responsiveness, assurance, and empathy. However, this model has shortcomings when it comes to measuring service quality in the restaurant industry. The study by Cornell, (1992, p.64 ) which were conducted in four different industries (i.e., bank, pest control, drycleaning, and fast foods), signifies the shortcoming of SERVQUAL when it comes to measuring service quality in the fastfood & dry-cleaning segment of the industry. It, in other words, means that SERVQUAL is not the right instrument for those industry types.
Consequently, DINESERV was drafted by Steven et al., (1995) to fit in the restaurant industry. Based on the SERVQUAL dimension, they came up with 29 question items that are restaurant specific. The goal of DINESERV is to give restaurant operators and owners a way to measure and acquire an overview of the service quality of their eating establishments as well as be ready to take the necessary actions so that the gaps can be solved or adjusted to the customers' needs and wants (Victor, 2014, p.119).
DINESERV (Stevens et al., 1995, p.82), is proposed as a reliable, relatively simple tool for determining how consumers view a restaurant's quality. Moreover, it also provides restaurateurs with a quantified measure of what consumers expect in a restaurant since their expectations are essential because unfulfilled expectations drive guests away. 1.1 Need for researching this area
Customer satisfaction has become a major concern for every company since winning their interest pays off and ensure their survival in the market. According to Miller (2007, cited in Nancy & Christina, 2011, p.21), 60% of new restaurants will close within three years of opening due to poor customer relationships. This scenario shows that customers are sensitive if not appropriately treated. So, every company needs to concentrate on strategies that can lead them towards gaining satisfied customers.
Furthermore, in order to satisfy customers, their behavior must be assessed through research because it will benefit businesses in a variety of ways. According to Ritesh Patil, (2019), business research can help companies to communicate with current and potential customers in a better way, identify opportunities and threats in the marketplace, minimize risk, plan investment and financial outcomes effectively, build a better market position and update the company with current trends and innovations in the market.
Furthermore, the restaurant industry has witnessed diversified changes and fierce competition over time, and this has fostered its consumers to become more sophisticated, value and price-conscious, demanding and thus switch swiftly to other alternatives in case of a single dodgy experience (Alam et al., 2015, p.187). It implies that the restaurant industry projects a robust environment that needs to be researched and assessed periodically. It will, as a result, enable organizations to predict their customer's behavior. 1.2 Problem formulation
and other areas it was never seen in before, such as pubs, resorts, and airports. Accordingly, pizza competitions and education events are also on the rise in Sweden. It shows that the restaurant business in Sweden is snowballing than before. Besides, service quality has become a significant concern for managers, business owners, and customers as well. On the one hand, managers want to improve service quality in order to retain customers and maximize their profit.
On the other hand, customers want to obtain a maximum service quality for what they have paid. According to Litchford, (2007 cited in Nancy & Christina, 2011, p.120), Industry experts believe that the restaurants best positioned to harness future growth will be the ones that can elevate the guest experience and meet escalating customer service and quality expectations. Moreover, to be able to do this, one must ask questions like what makes customers behave in a certain way in a service context? How do customers perceive service quality? What is their expectation of service quality before experiencing it? These interrelated questions can be addressed through continuous research.
Moreover, many literatures (Parasuraman et al., 1985, Hyun, et al., 2003, Ursula-Sigrid & Meng-Keang, 2010, Liang & Zhang, 2012, Hsieh, and Yeh, 2015, Guesalaga & Denis 2014 & so on), dictate that the gap between customers expectation of service quality and the perceived service quality they experienced did relate with their satisfaction and repurchase intention.
Furthermore, a study which was conducted in the Malaysian fast-food restaurants by Ursula-Sigrid & Meng-Keang, (2010) did give me a greater insight to concentrate on this area. Their research aim was about exploring external validation of Western-based marketing concepts and theory in the East. Consequently, they chose DINESERV, to prove the relationships between service quality, overall service quality perceptions, customer satisfaction, and repurchase intentions in the Malaysian fast-food restaurants (i.e., KFC, McDonald & Pizza Hut). Finally, they found that DINESERV is valid in the Malaysian context. The authors conclude that there is a significant relationship between service quality dimensions and customer satisfaction. Three dimensions of the DINESERV instrument were rated positively by the respondents. However, responsiveness and empathy received mean scores under 5/7, highlighting a gap between consumer expectations and their experiences in Malaysian McDonald's, KFC, and Pizza Hut restaurants.
Moreover, another study by Hyun et al., (2003) has also tried to validate the five dimensions of DINESERV and evaluate service quality of foreign-brand, casual dining restaurants in Korea using DINESERV. They, as a result, found that DINESERV is not a valid instrument in the Korean culture, and service quality differs significantly based upon customers' chrematistics and restaurants. However, both of the studies mentioned above did recommend future research in a different cultural context to check the external validity of DINESERV. And this implies that the customer's perception of service quality differs across different cultural settings. Guesalaga & Denis (2014, p.146), points out that in more and more globalized economies and marketplaces, companies need to understand the extent to which people from different countries evaluate service quality and its dimensions differently. Because "perceptions are filtered through the lens of culture," and that customers from different countries may hold different expectations of service encounters (Laroche et al. 2004, cited in Guesalaga, 2014, p.146). Also, Cultural differences hold importance, as they are likely to influence the dining orientations (Tripathi, 2014, p.9). So, this study will explore the relationship between customer
satisfaction and service quality in the Swedish cultural context and check the external validity of the DINESERV. Therefore, the research will be twofold research since it aims at measuring the relationship between customer satisfaction and service quality dimensions and prove the external validity of the DINESERV model in Sweden as well. In general, this study will be the first to scrutinize the external validity of DINESERV in the Swedish fast food industry.
1.3 Research audience
This research has direct (managers and future researchers) and indirect audiences (customers). So, the research result will entail pizza hut managers to understand better those service quality dimensions in which customers think have a significant effect on their satisfaction. In other words, the research will examine the gap between the customer's expectation and perception of service quality. As a result, managers will be able to improve their service quality by amending those specific service quality dimensions with flaws. Moreover, customers will also benefit indirectly. All in all, this is the practical contribution of the research.
This research aims at examining the validity of DINESERV in the restaurant business and investigate the relationship between service quality and customer satisfaction. Hence, this will provide future researchers with useful insight. This will be the theoretical beneficiation of the research, and it will enable future researchers by giving them a greater understanding of the relationship between service quality dimensions and customer satisfaction.
1.4 Research objective
For service providers, it is crucial to know which service attributes add value and increase satisfaction, which of them merely fulfill minimum requirements and minimize dissatisfaction and which do both. Only then can they make better decisions about how resources should be allocated to different service attributes in order to improve quality and satisfaction (Kurt, 2002, p.314). So, this study will examine the relationship between service quality dimensions and customer satisfaction using the DINESERV instrument. Additionally, the model will also be validated to see if it is applicable in Sweden. However, the primary purpose of this study will be assessing the expectation – perception gap.
1.5 Research question
Therefore this study would like to answer the following questions:
➢ Is there a relationship between DINESERV service quality dimensions and customer satisfaction?
➢ Is the DINESERV a valid instrument to measure service quality in Sweden’s context?
1.6 Delimitation
Pizza Hut is an American restaurant chain and international franchise, which was founded in 1958 in Wichita, Kansas, by Dan and Frank Carney, and the company is known for its Italian-American cuisine menu, including Pizza and pasta, as well as side dishes and desserts
Although it is a big chain restaurant, little research has been done in Sweden. So, I have decided to take part by examining the relationship between customer satisfaction and service quality using the DINESERV instrument in Pizza Hut, Uppsala.
Moreover, being a part of this giant restaurant chain, catch my interest in researching this particular restaurant. Besides, working in this specific branch gave me a closer look at the customers day to day experiences. I did even get the chance to observe their behavior during rush hours and off-peak hours, and this makes me decide to conduct the research in Uppsala and formally approach them to explore their real experience in Pizza Hut. In addition, I believe that researching in an environment that is familiar to the author will yield many benefits. In this study, for instance, the waitress, shift leaders, and the manager help me in informing the customers about the questionnaires' general aim and convincing them to fill it up. In general, its convenience and accessibility to gather primary data have made me pick this specific branch.
CHAPTER TWO: METHODOLOGY
The methods used in carrying out this research will be discussed in section. The chapter begins with the choice of subject and then the research philosophy, and the research approach will be presented in detail. The strategy chosen, the research design employed, and the data collection method are also included in this section of the paper. Finally, the data analysis method and the ethical consideration taken ends the chapter.
2. Choice of the subject
In today's highly competitive restaurant market, companies need to formulate a strategy that can improve their service quality over their competitors. And In the race to provide better service and value, it becomes increasingly essential for restaurants to monitor customer perceptions of service quality (Nancy & Christina, 2011, p.21). According to Anderson et al., (1994, cited in Cheng, 2012, P.1155), the improvement of service quality will result in the satisfaction improvement of service recipients and lead to the increasing opportunity of the next consumption opportunity.
On the contrary, paul O' Mahony, (2009) states that Sixty, one of seventy pizzerias in Sweden fail hygiene inspection. It, in other words, means that the cleanness of the restaurant in Sweden is a severe issue that needs to be assessed from the customer's point of view. In general, the statements mentioned above clearly show that customer's perception of service quality has become a severe issue in the restaurant business. It is because their positive perception will result in a higher satisfaction level. So, I believe that such an area needs continuous research to explore more useful results regarding their perception of service by customers.
Furthermore, when it comes to measuring the customer perception of service quality in the restaurant business, the DINESEREV instrument, which was developed by Stevens et al., (1995), has become beneficial in many cultural settings. So, I decided to choose this model since it is was developed to fit in the restaurant industry.
Moreover, it is believed that customers satisfaction and their loyalty is a core element for every business success. According to Wilson et al., (2008, p. 79), customer satisfaction has been a subject of great interest to organizations and researchers alike. The principal objective of organizations is to maximize profits and to minimize costs. Profit maximization can be achieved through an increase in sales with lesser costs. One of the factors that can help to increase sales is customer satisfaction because satisfaction leads to customer loyalty, recommendation, and repeat purchase.
Furthermore, knowing their perception of service quality is critical for managers since it will help them develop a successful strategy. And this, as a result, will give them a competitive advantage. So, I decided to run this research to uncover useful insights about the customer's perception of service quality in the restaurant industry.
2.1. Research philosophy
Every research motive is to obtain detailed knowledge about a particular phenomenon and pave the way for future researchers and concerned bodies. Plus, the research philosophy contains an important assumption on the way the researcher views the world. These assumptions will underpin the research strategy and methods chosen as part of the
and epistemology. Questions of social ontology are concerned with the nature of social entities. The central point of orientation here is the question of whether social entities can and should be considered objective entities that have a reality external to social actors, or whether they can and should be considered social constructions built up from the perceptions and actions of social actors. These positions are frequently referred to, respectively, as Objectivism and constructionism (Bryman & Bell, 2011, p.17). Objectivism represents the position that social entities exist in reality external to social actors. According to Wilson, (2014, p.11), the concept objectivism implies that social phenomena are based on external realities that are beyond our reach or control. And constructionism/subjectivism, on the other hand, dictates that social phenomena are created from the perception and consequent action of social actors. What is more, this is a continual process in that through the process of social interaction, these social phenomena are in a constant state of revision (Saunders et al., 2009, p.111). Also, subjectivism is linked to interpretivism in that the researcher examines the motivation and social interactions of respondents (Wilson, 2014, p.11).
The reason why I prefer to choose objectivism side over subjectivism is for two reasons; First, I believe that the reality (i.e., customers and their satisfaction) did exist outside of the social actors (i.e., service providers). Besides, both customer satisfaction and service quality are tangible objects, and they are clearly defined facts on so many works of literature. However, these realities are beyond our reach or control. And the reality is an individual matter that differs across a variety of contexts. For example, the way a customer perceives a service quality in the airline industry differs from that of a restaurant business. So, I decided to measure the customer's perception of service quality using objective measurement. By objective measurement, I mean that pre-structured questionnaires developed by the so-called ¨DINESERV instrument¨ will be used to uncover the fact or truth.
Second, I believe that the researcher's research strategy dictates its ontological position. According to Bryman & Bell (2011, p.27), quantitative research embodies a view of social reality as an external, objective reality. So, besides the topic/research question, I prefer to conduct the study using a quantitative method. For this reason, I choose the objectivism view of ontology.
Epistemology refers to the nature of knowledge (Wilson, 2014, p.9), which means how we conceive our surroundings. According to Bryman & Bell, (2007, p.16), An epistemological issue concerns the question of what is (or should be) regarded as acceptable knowledge in a discipline. A particularly central point in this context is the question of whether or not the social world can and should be studied according to the same principles, procedures, and ethos as the natural sciences.
Epistemology has two edges, which are positivism and interpretivism. Wilson, (2014, p.9) stated that if a researcher assumes a positivist approach to his study, then it is his belief that he is independent of his research, and his research can be truly objective. Independent means that the researcher maintains minimal interaction with his research participants when carrying out his research. Through being detached in this way, the hope is that the researcher can be truly objective. In other words, your personal biases have no effect on the research effort.
Interpretivism is an epistemological view that puts the researcher to inside of the social world that is under examination. If the researcher decides to assume the interpretivism perspective, then he is likely to analyze social actors within their cultural setting. It, as a result, may involve observations that are qualitative and subjective in nature (Wilson, 2014, p.10).
My choice of epistemological view is the positivist perspective. The first reason behind this choice is because the study will be conducted using the so-called DINESERV model. And this model has twenty-nine questions that were pre-developed to measure customer's perception of service quality. Moreover, the interaction with the participants will be limited Since I chose to use this pre-developed questionnaire. This scenario put me in the positivist side of the epistemology philosophy. Therefore, I will measure the customer's perception outside of the nutshell and persist in being objective as much as possible.
Furthermore, my ontological choice of Objectivism is also another reason for choosing the positivist perspective. The choice of ontological stance dictates the researcher's epistemological views to some extent. For instance, Objectivism mentions that realities are outside of our control, and positivism, on the other side, forces researchers to limit their interaction from those predefined realities while measuring them, (Wilson, 2014, p.11) and the research can be truly objective. The reason why I did not choose interpretivism is that it urges the researcher to immerse himself inside of the cultural setting, observe the respondents, and interact with them. Moreover, I believe that this will take much time, which is not available in my case. Plus, it will also change my objective stance of ontology to subjectivism since it is subjective in nature (Wilson, 2014, p.10). Also, I believe that the only better way to maintain minimal interaction with the participants is to use questionnaires. All in all, the above inter-related reasons shape the choice of my epistemological stance to be positivist.
2.2. Research approach
According to Sachdeva, (2009, p.31), inductive reasoning moves from specific observations to broader generalizations and theories. Informally, we sometimes call this a "bottom up" approach. In inductive reasoning, we begin with specific observations and measures, begin to detect patterns and regularities, formulate some tentative hypotheses that we can explore, and finally end up developing some general conclusions or theories. Conversely, deductive reasoning works from the more general to the more specific. Sometimes this is informally called a "top-down" approach. We might begin by thinking up a theory about our topic of interest. We then narrow that down into more 'specific hypotheses that we can test. We narrow down even further when we collect observations to address the hypotheses (Sachdeva, 2009, p.31). This ultimately leads us to be able to test the hypotheses with specific data, a confirmation (or not) of our original theories. Wilson, (2014, p.13) propose the following figure to show how theory fits into your research:nductive
FIGURE 1 How theory fits into your research
Thus, I choose the deductive approach because it fits in this research. As mentioned earlier, I will use a pre-developed model (i.e., DINESERV). This, as a result, signifies that I am not going to develop any model and theory to conduct this research. Whereas, I will propose a set of hypotheses based on existing theory and test them at the end. This is because the theories about customer satisfaction and service quality are already out there in the literature.
2.3. Research strategy
There exist two types of research strategies: qualitative and quantitative research. Quantitative research examines data that are numerical, whereas qualitative inquiry examines data that are narrative (Wilson, 2014, p.15). A qualitative strategy, according to Wilson, (2014, p.15), is usually linked with an inductive strategy since the inductive theory means that theory is likely to be an outcome rather than applied from the outset. Also, combining qualitative strategy and inductive theory are common as they are well suited to providing insights that allow for the generation of theoretical frameworks.
According to Hyde (2000, cited in Wilson, 2014, p.15), A quantitative approach to research might draw a large and representative sample from the population of interest, measure the behavior and characteristics of that sample, and attempt to construct generalizations regarding the populations as a whole. Unlike the qualitative approach, quantitative research is associated with a deductive approach. In other words, the theory is applied from the outset. The analysis is usually statistical and involves analyzing the results following theoretical application (Wilson, 2014, p.15-16).
So, I will conduct quantitative research mainly for two reasons. Firstly, the topic has two variables (i.e., customer satisfaction & service quality) that needs to be tested and validated. It, in other words, indicates that I am not going to develop a new theory; instead, I will propose a set of hypotheses and validate the relationship between the variables to see if they have a significant relationship or not. This means that this research will follow a deductive approach. Furthermore, as mentioned above, quantitative research and deductive approach have a link when doing research. Besides, this particular study is going to validate the model (i.e., DINESERV) in the process. Secondly, my choice of positivism stance also shapes the research strategy to be quantitative. According to Wilson, (2014, p.9), positivist want their finding to have applicability to
Inductive approach Observations /findings Theory as an outcome Deductive approach Theoretical application Observatio ns/findings
the whole population and analysis of observation is likely to be quantifiable as opposed to qualitative research.
2.4. Research design
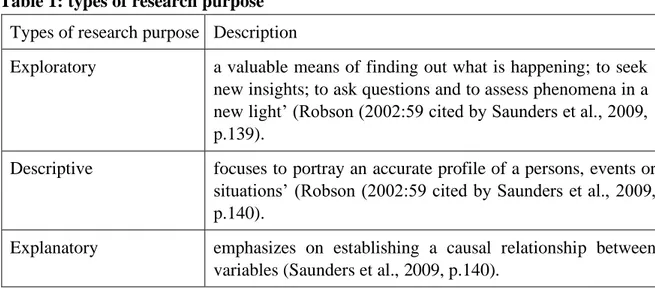
A research design provides a framework for the collection and analysis of data (Bryman & Bell, 2011, p.40). Moreover, according to Kothari, (2004, p.31) research design is the arrangement of conditions for the collection and analysis of data in a manner that aims to combine relevance to the research purpose with economy in procedure. The latter definition dictates that the research purpose has a vital role in determining the research design. Furthermore, the classification of research purposes most often used in the research methods' literature is the threefold one of exploratory, descriptive, and explanatory (Saunders et al., 2009, p.139).
Table 1: types of research purpose Types of research purpose Description
Exploratory a valuable means of finding out what is happening; to seek new insights; to ask questions and to assess phenomena in a new light’ (Robson (2002:59 cited by Saunders et al., 2009, p.139).
Descriptive focuses to portray an accurate profile of a persons, events or situations’ (Robson (2002:59 cited by Saunders et al., 2009, p.140).
Explanatory emphasizes on establishing a causal relationship between variables (Saunders et al., 2009, p.140).
I will not establish any causal relationships between customer satisfaction and service quality Because it is impossible for me to manipulate the variables. The exploratory study did not describe the nature of this study since it seeks new insights. As the research question implies, I am not going to generate new insights; instead, the research relies on previous theories in the literature to measure the perception of customers. For this reason, I chose a descriptive study since the author's concern is to portray the perception of a particular group of customers with respect to the service quality offered by Pizza hut using the ¨DINESERV¨ instrument.
Furthermore, the research design that best describes my research is survey design. I choose it because (Saunders et al., 2009, p.144):
• It is associated with a deductive approach. As mentioned in the research approach section of this research, I will not develop new ideas or theories. Instead, I will be based on theories that exist in the literature to propose a hypothesis and test it. • It tends to be used in exploratory and descriptive studies, which, as a result,
• It also allows collecting quantitative data, which can be analyzed using descriptive and inferential statistics. This will also help me to meet the research objective since it matches the research strategy and the data analysis method used. • Finally, it also suggests the reasons for the particular relationships between variables and to produce models of those relationships. Thus, the aim of this study, as mentioned in the research question section, is to examine the relationship between customer satisfaction and service quality dimension based on the perceptionexpectation gap theory. As a result, I will try to pinpoint whether there is a significant association between DINESERV service quality dimensions and customer satisfaction or not. For the above reasons, I believe that the cross-sectional design perfectly describes this study.
2.5. Data collection method
There exist two types of data, which are secondary and primary. According to Sachdeva, (2009, p.109), the primary source is used to collect initial material during the research process. Primary data is the data that the researcher collects himself using methods such as surveys, direct observations, interviews, as well as logs (objective data sources). Here I use pre-developed questionnaires by DINESERV instrument in order to get original data from the selected respondents about their perception of service quality. Plus, I asked the manager (Pizza Hut, Uppsala branch), about the number of customers they have in their branch. This combined with the respondents answer from the questionnaire will help me in fill in the gap by answering the research question.
Secondary sources are edited primary sources, second-hand versions. They represent thinking of someone else. Secondary data are data that were collected by persons or agencies for purposes other than solving the problem at hand. They are one of the cheapest and easiest means of access to information (Sachdeva, 2009, p.109). I endeavor to use the Umeå and Uppsala University database to access articles, books, journals and conferences. Moreover, I also use a book in a printed version and webpages in order to move forward in doing this research and narrowing down the vast topic into a more specific one. Because without this data, it will be hard to imagine the literature review, the research methodology, and other main parts of this research.
2.5.1 Sampling technique and selection of respondents
It is hardly impossible to study the whole population without sampling. So, sampling will ease the researcher's job (i.e., in terms of having fruitful results, saving time and cost) by giving a small representative part of the population for detailed investigation. According to Sachdeva, (2009, p.144), there are two types of sampling methods called probability and non-probability samples. Probability or random sampling gives all members of the population a known chance of being selected for inclusion in the sample, and this does not depend upon previous events in the selection process. In other words, the selection of individuals does not affect the chance of anyone else in the population being selected (Sachdeva, 2009, p.144). Moreover, non-probability sampling on the other edge is a sampling technique where the probability of each case being selected from the total population is not known (Saunders et al., 2009, p.213).
Furthermore, I have decided to choose a non-probability sampling called convenience sampling. It is one that is merely available to the researcher by virtue of its accessibility (Bryman & Bell, 2011, p.190). The very first reason behind this choice is that the absence of the sampling frame. In many cases, it is not feasible to conduct a probability sampling
exercise because of the constraints of ongoing fifieldwork and also because it can be difficult and often impossible to map 'the population' from which a random sample might be taken— that is, to create a sampling frame(Bryman & Bell, 2011, p.441). Therefore, I have asked the manager (Pizza Hut in Uppsala) in order to get information regarding the number of customers they have. However, they do not have the exact figure. In addition, I have also asked her about their customer's email address. Because if it is accessible, it will be easy to use a random sample and do an online survey. But the manager informed me that it is not legal for them to hand over the customer's email, and they do not have the whole number of their customer's email addresses.
Nevertheless, she told me that they had served five thousand customers within the whole month of October 2019. The other reason behind this choice is the scarcity of time. Additionally, the cost-effectiveness of convenience sampling has also shaped my choice of sampling technique. Finally, the research was conducted entirely in Uppsala, Sweden.
2.5.2 Self-completion questionnaires
Questionnaires that are completed by respondents themselves are one of the main instruments for gathering data using a social survey design, along with the structured interview (Bryman & Bell, 2011, p.231). Self-completion questionnaires are one of these types. As was mentioned in the methodology section, I chose to use a pre-developed questionnaire from the DINESERV instrument. Unlike the SERVQUAL instrument, DINESERV has 29 items under five dimensions of service quality (i.e., tangibles, reliability, responsiveness, assurance, and empathy). The question items that are allocated for each dimension of service quality as follows:
• Tangibles has ten-question items (1-10) • Reliability has five-question items (11-15) • Responsiveness has three question items (16-18) • Assurance has six-question items (19-24)
• And finally, empathy holds five-question items under it (25-29)
Even though the sampling method used seeks a large amount of sample, I planned to collect 350 fully answered responses. This is due to time and cost limitations. However, I ended up with 299 (i.e.,85% response rate) fully marked questionnaire and 15 partially answered responses.
2.5.3 Pilot study
According to Kothari, (2004, p.101). It is a wise decision to conduct a pilot survey Before distributing the self-completed questionnaire. A pilot study(survey) is, in fact, the replica and rehearsal of the main survey. Such a survey, being conducted by experts, brings to light the weakness (if any) of the questionnaires and also of the survey techniques (Kothari, 2004, p.101). Even though it is a pre-developed questionnaire, I believe that amending the content of the questions in a way that is more understandable by the respondents will be beneficial. And if it is understandable, the respondents with no confusion will honestly choose what affects their perception of service quality from the multiple-choice presented in the questionnaire. Besides, the questions were translated into the Swedish language. So, it is a must for me to conduct a pilot study. For this reason, I picked ten employees from Pizza hut (Uppsala) and handed them the translated version
2.5.4 Choice of location
After conducting the pilot study, selecting the right location to distribute the questionnaire will become the researcher's next task. Thus, I came up with the idea of putting the questionnaires on the restaurant's empty tables. Because I believe that the guests will have the time to fill in the question before their order arrives. Moreover, the first reason why I choose this location (i.e., pizza hut restaurant) is to get the guest's "right on the spot" perceptions of service quality and its dimension. It, in other words, means that the guests will be honest with their feelings since they are in the right place where they experience the service provided by Pizza Hut. So, as soon as the waitresses receive an order, they will also tell the guests about the purpose of the research and ask them to be a part of it by filling in the questionnaire.
secondly, I choose this location because of the belief that researching an environment that is familiar to the author will yield many benefits. In this study, for instance, the waitress, shift leaders, and the manager help me in informing the customers about the questionnaires' general aim and convincing them to fill it up. In general, its convenience and accessibility to gather primary data have made me pick this specific branch.
2.6. Data analysis
According to Saunders et al., (2009, p.414), quantitative data in a raw form, that is, before these data have been processed and analyzed, convey very little meaning to most people. These data, therefore, need to be processed to make them useful, that is, to turn them into information. Quantitative analysis techniques such as graphs, charts, and statistics allow me to be able to explore, present, describe, and examine relationships and trends within the data collected. However, since the human mind is not capable of processing a large amount of data (i.e., like those collected through questionnaires), selecting the right software that can analyze the collected data will become the researcher's consent. Furthermore, there exists a variety of software to choose from in order to analyze the data at hand. To my knowledge, one can use MINITAB, JMP, and SPSS. Consequently, I choose to analyze the data using SPSS software because of its accessibility, user-friendliness, and efficiency.
Furthermore, I am going to use quantitative data analysis method, since the data at hand is quantitative. Because the pre-developed questionnaire that was used from the DINESERV instrument, accompanied by a five-point Likert scale, has close-ended questions. Furthermore, since these types of questions have separate/discrete responses, I will assign a number (while coding in SPSS) for each of the respondents' answers, and this, as a result, will make the data a quantitative one.
Finally, the research will employ descriptive statistics to analyze the data at hand. I will use descriptive statistics in order to present the raw data in a more understandable manner for the audiences. It will, therefore, enable me to present the data in a more meaningful way, which allows a simpler interpretation of the data (Lund research ltd. 2018). Moreover, the questionnaire distributed is analyzed using this type of statistics, such as the mean score for customer expectation, and perception will be computed to implement the gap score analysis (P-E). The frequency table to clarify the demographic characteristics of the respondents will be presented.
Cronbach's alpha will be used through Statistical Package for Social Sciences (SPSS) in order to test the internal consistency of the DINESERV instrument/scale, and factor
analysis will also be employed to prove the validity of DINESERV in Sweden. According to Goos et al., (2015, p.9), The variable is ordinal if there is a logical order between the elements of the sample. Moreover, I will collect the primary data using a five-point Likert scale (i.e., ordinal data), since it shows a logical order. Then, Spearman's correlation rho will be employed to test the strength and direction of the variables and their relationship with each other. Because this statistical tool is suitable to analyze the correlation between ordinal variables, and it can also be used when one variable is ordinal, and the other variable is interval/ratio (Bryman & Bell, 2011, p.349).
Table 2: summary table of the methodology and choice of methods
type Description Reason for choosing
Research philosoph y
Ontology (objectivism)
Social entities exist in reality external to social actors.
The reality is beyond the control of the author and it is an individual matter that differs across a variety of context. And the research strategy dictates the ontological view.
Epistemology (positivism)
The researcher maintains minimal interaction with his research participants.
choice of ontological stance dictates the epistemological choice
Research approach
Deductive more general to the more specific.
The author will be based on predeveloped model/theory to reach at a generalization by testing the hypothesis.
Research strategy
Quantitative examines data that are numerical.
Associated with research approach (deductive) and philosophy (positivist stance). Research
purpose
Descriptive focuses to portray an accurate profile of a persons, events or situations.
The author concern is to portray the perception of certain group of customers with respect to the service quality offered by Pizza hut using ¨DINESERV¨ instrument. Research
design
Survey design Can be analyzed using descriptive and inferential statistics.
It is associated with deductive approach and mostly used in descriptive studies.
It allows to collect quantitative data and suggest the reason for relationship between variables.
Data collection
Questionnaire Are the means to collect primary data.
To limit the interaction with the respondents (i.e., positivism view). Sampling technique Convenience sampling Involves selecting haphazardly those cases that are easiest to obtain for your sample.
The absence of sampling frame, time limit and cost effectiveness.
Data analysis
Frequency Table
Method of converting a raw data into a meaningful one.
To summarize the respondent’s characteristics.
Gap score Table
The mean gap between the respondent’s perception and expectation.
To show the respondents level of perception with respect to their expectation.
Cronbach’s alpha
Measures the internal consistency of an instrument or model.
To test the reliability of DINESERV instrument.
Factor analysis
Help to validate a certain model or instrument.
To check the validity of DINESERV instrument. Spearman’s
correlation rho
Enables to examine the correlation between
variables.
To test the correlation between DINESERV service quality dimensions and customer satisfaction.
2.7. Ethical consideration
The data (i.e. primary and secondary) that was presented on this research is original and the respondent's response were treated with confidentiality without disclosure. This means that I did not modify or change the originality of the data collected, instead I convert it to a more meaningful and bring useful knowledge to our audiences. In addition, the literatures reviewed were used in an ethical manner and the idea gathered from it was helpful and rewarding.
CHAPTER THREE: LITERATURE REVIEW AND THEORITICAL FRAMEWORK
In this section, I will go through all the possible kinds of literature that I think has a relation with my topic and present their finding. And, before diving into various models and discussing their merit and demerit, I will briefly present some useful concepts like Service, Quality, service quality, perceived service quality, customer satisfaction and determinants of customer satisfaction, the relationship between customer satisfaction and service quality. Then various service quality models in my area of research will be presented. Finally, I will embrace the reason why I choose the DINESERV model and based on that; the hypothesis will be proposed.
3. The concept of Service
So many authors have awarded the concept of Service a lot of definition. Although authors try to define Service, its characteristics are still confusing. The first reason behind this confusion is because of the intangibility nature of Service. Besides, authors with different backgrounds try to give Service a variety of definitions. Because of their previous background (in terms of academics) influences the way they experience Service. Economist (Mikhailovich, 2017, p.24) for instance, offers one of the simpler definitions when describing Service as "everything you can not fall at the feet" (http://www.economist.com). Besides, the marketing view of Service according to Kotler et al., (1999 cited in Mihailovic, 2017, p.23), is an activity or profit that one party can offer to another which is mostly intangible and does not result of ownership of something. Other authors try to define Service in terms of its technical and functional outcome. More specifically, there is typically a how and what component to services. That which is delivered is the what of service delivery (e.g., the meal eaten in a restaurant). The how of Service concerns the service delivery process itself (e.g., the process involved in being seated, in ordering the meal, the meal being brought to the table and served, the attention accorded the patrons while they consume the meal). Grönroos, (1990, cited in Schneider et al., 2004, p.5) distinguished these two aspects of Service from each other, calling the former a technical outcome dimension of Service and the latter a process-related or functional dimension of Service.
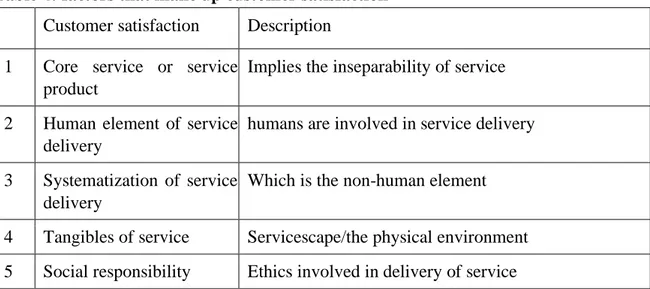
Furthermore, the other defining characteristics of Service has totally come from its purity. For a service to be pure, there will be no accompanying product or thing that can be seen and felt by those who involve in it. Schneider et al., (2004, p.6) classified service characteristics into three parts putting in mind that they are pure. These are:
Intangibility dictates that pure services cannot be seen, touched, held, or stored – they have no physical manifestation.
Relative inseparability dictates that pure services, which are composed entirely of delivery experience, cannot be produced at one time and place and then stored for later use at another place.
Relative heterogeneity – services also differ from physical goods in that Service is relatively heterogeneous than goods in their production and their delivery.
are likely to happen at the same time. This, in other words, means that they are inseparable. So, the next section will be about defining the term quality.
3.1 The concept of Quality
Chakrapani, (1998, p.4) says, a product or Service has Quality if customers enjoyment of it exceeds their perceived value of the money, they paid for it. He also describes Quality for competitive market by saying, the product/or Service with the Highest Quality is the one that provides the greatest enjoyment. Schneider et al., (2004, p.9), on the other hand, propose three different ways to approach the definition of Quality. These are:
Philosophical Approach – under this Approach, people know Quality when they see it, but they cannot define Quality further (sounds like the definition of pornography to us!). Technical Approach – this Approach to defining Quality is a stark contrast to the first and considers Quality from an objective and absolute perspective. Quality is often measured objectively in terms of the number of deviations from these standards or the number of defects.
User-Based Approach – the focus of the present Book – is a user-based one, in which its user determines the Quality of the product. It takes the view that Quality is subjective and hinges on the individual perceptions of customers.
In general, the above definition of Quality dictates about adding value on a given product or Service, and the Quality represents this value. When a product has a higher value, the customers perceive it as a high-quality product or Service and vice versa. This, as a result, will possibly give customers higher excitement and will also yield a differentiation advantage for the company. Finally, companies can shine in the market if they specialize and work hard towards delivering "quality" in all their offerings to customers.
3.2 Service quality
Nowadays, service quality has become the central focus of companies around the globe. This is because the world's economy has shifted to a service-driven economy. Plus, customers start giving a greater emphasis on the Quality of Service that is delivered to them. That’s why Grönroos, (1984, cited in Senay et al., 2019, p.1371) define Service quality as it is a customer service concept in business administration and is defined as "an outcome of an evaluation process where the consumer compares individuals' expectations with the service they have received."
However, defining service quality is a headache to many researchers due to the intangibility nature of Service. Unlike the Quality of products where there is "conformance to requirements" (Crosby, 1979, cited in Parasuraman et al., 1985, p.41-42), Service is a quite ambiguous concept which even hinders one to draw a line for their definition. Service quality is also a challenge for customers when evaluating their own experience. This is because Quality has no imprecise adjective like "goodness, or luxury, or shininess, or weight" (Crosby, 1979 cited in Parasuraman et al., 1985, p.42). As a result, Quality and its requirements are not easily articulated by consumers (Takeuchi and Quel, 1983, cited in Parasuraman et al., 1985, p.41).
On the contrary, customers form their expectations regarding the Quality of Service even before experiencing it. So, Before the service encounter, the customer builds expectations about the forthcoming experience using several intrinsic and extrinsic cues that indicate
the possible performance standards (Clow and Vorhies,1993; Gould-Williams, 1999, cited in Wilkins, 2007, p.841). This, in other words, means that customers will likely use their previous experience to forecast their future involvement. Let say, for example, a given customer visited MacDonald restaurant and had a bad/or excellent experience with their Service. And when this customer thinks about going to another competitive restaurant (like Max burger), he/she will likely form an expectation about the Service to be offered based on their previous experience in MacDonald.
Furthermore, service quality should be measured to lead any given company towards sustainable success. Because it will be hard to determine the company's position in today's competitive market unless the Quality delivered is monitored. As the economist (1992, cited in Chakrapani, 1998, p.9) points out, quality programs should be measured against customer expectations and not against quarterly profits. However, monitoring quality and related activities that will be done to increase the level of service quality is not an easy task. It needs a serious investment to maintain a higher competitive advantage. As Chakrapani, (1998, p.10) stated, Many world-class quality performers appear to believe that the cost is around 3% of their sales revenue (e.g., band 1991); that can be a lot of money and if your sales volume is $100 million, maintaining service quality will have an average price tag of $3 million.
3.3 Perceived service quality
According to Chakrapani, (1998, p.5), Quality, from the customer perspective, can be viewed as features that fulfill their wants in three psychological domains; cognitive, conative, and affective, and the customer enjoyment tends to be based on continuous improvement of these three dimensions. Besides, he tried to point out that customer enjoyment increases as a service get faster (or slower under certain conditions), gets cheaper (or provides better value at the same price), and exceeds expectation.
Perceived service quality (Stevens et al., 1995, p.60), is a function of the interaction among three independent variables: normative expectations, predictive expectations, and actual service quality. They indicate that the lower the expectations the consumers have about what should happen, the better their perceptions of the actual Service. And the higher their expectations about what will happen, the better their perceptions of the actual Service. Therefore, they have proposed three ways to improve customers perception about Service:
• Improve the Service,
• Lower the expectations of what should happen, • Raise the expectations of what will happen.
Perceived Quality according to Zeithaml, (1988, p.3-4), is (1) different from objective or actual Quality, (2) a higher-level abstraction rather than a specific attribute of a product, (3) a global assessment that in some cases resembles attitude, and (4) a judgment usually made within a consumer's evoked set. In addition, Customers perception of service experiences are key elements for the success of every service organizations (Kelley & Turley, 2001; Laming & Mason, 2014, cited in Brida et al., 2016, p.209) and the degree in which customers perceive every Service's attributes directly affect customer's attitude when they are asked to issue an overall judgment about their experience of the Quality of Service delivered (Brida et al., 2016, p.2019). Another famous authors Parasuraman,
service provider should offer and his or her perception of what the service firm actually provides. However, unlike the product perceived Quality, the perceived service quality is a sensitive area that needs a closer look by managers. This is because What differs with services is the nature of the characteristics upon which they are evaluated (Parasuraman et.al, 1985, p.48). As described in "the concept of service" section of the literature, Service has three distinctive characteristics (i.e., intangibility, relative inseparability, and relative heterogeneity), which make it even tough for customers to evaluate the perceived Service. This scenario becomes more complicated when it comes to assessing the perceived service quality in the restaurant industry. This is due to the fact (Markovic et al., 2010, cited in Tripathi & Dave, 2014, p.12) that evaluation of service quality in the restaurant industry is difficult because both the process and delivery are at the focal point of customer's evaluation of service quality.
3.4 Customer satisfaction
Customer satisfaction is an essential and comprehensive concept that gets a greater emphasis by so many authors. According to Hill and Alexander, (2006, p.2), customer satisfaction is a measure of how your organization's total product performs in relation to a set of customer requirements. Another author defines Customer satisfaction, as it is the customer's fulfillment response, and it is a judgment that a product or service feature, or the product of Service itself, provided (or is providing) a pleasurable level of consumptionrelated fulfillment, including levels of under- or over-fulfillment (Oliver, 1997, cited in Liang & Zhang, 2012, p.155).
Furthermore, in the food services market, customer satisfaction has become a primary topic that has a strong influence on business performance and customer retention (Holjevac et al., 2009, cited in Dwaikat, 2019, p.713). However, it will be quite severe for companies to survive in the market without giving a greater emphasis on "what attitude their customer's form towards their offering. Because the average business loses between 10 to 30 percent of its customers each year; but they often don't know which customers they have lost, when they were lost, why they were lost, or how much sales revenue and profit this customer decay has cost them and the reason behind this scenario is the fact that most companies have traditionally placed more emphasis on winning new customers than worrying about customers they are losing (Hill and Alexander, 2006, p.5).
Moreover, at least two different conceptualizations of customer satisfaction can be distinguished: transaction-specific and cumulative (Boulding et al., 1993, cited in Anderson et al., 1994, p.54). w). By comparison, aggregate customer satisfaction is an overall evaluation based on the total purchase and consumption experience with a good or Service over time (Fornell, 1992; Johnson and Forell 1991, cited in Anderson et al.,1994, p.54). Whereas transaction-specific satisfaction may provide specific diagnostic information about a particular product or service encounter, cumulative satisfaction is a more fundamental indicator of the firm's past, current, and future performance. So, companies should focus on formulating effective strategies to have satisfied customers. And companies with many satisfied customers will likely benefit in several ways. Satisfied customers become more likely to repurchase or shop, which then increases company profits (Gupta et al., 2007, cited in Ivkov, 2014, p.371) and become repeat purchasers of products or services and provide family or friends with positive feedback regarding their experience (Gibson, 2005, cited in Ivkov,2014, p.371). Besides, high customer satisfaction should indicate increased loyalty for current customers, reduced price elasticities, insulation of existing customers from competitive efforts, lower costs