ACTIVATION MECHANISMS IN FATTY ACID FLOTATION OF QUARTZ
by
INFORMATION TO ALL USERS
The qu ality of this repro d u ctio n is d e p e n d e n t upon the q u ality of the copy subm itted. In the unlikely e v e n t that the a u th o r did not send a c o m p le te m anuscript and there are missing pages, these will be note d . Also, if m aterial had to be rem oved,
a n o te will in d ica te the deletion.
uest
ProQuest 10781567Published by ProQuest LLC(2018). C op yrig ht of the Dissertation is held by the Author.
All rights reserved.
This work is protected against unauthorized copying under Title 17, United States C o d e M icroform Edition © ProQuest LLC.
ProQuest LLC.
789 East Eisenhower Parkway P.O. Box 1346
A thesis respectfully submitted to the Faculty and the Board of Trustees of the Colorado School of Mines in partial fulfillment of the requirements for the degree of Master of Science in Metallurgical Engineering.
Signeds William F. Cummins, Jr. Approved?
'bu. C.
M. C® Fuerstenau, Thesis Advisor Golden, Colorado DatesA® W. Schlechten, Head Department of
Metallurgical Engineering
ABSTRACT
Rayleigh light-scattering, infrared spectroscopy, x-ray diffraction, and analytical chemical techniques were used to study the properties of metal-organic colloidal precipitates. Chemical and x-ray techniques showed the existence of and differences between lead oleate and basic lead oleate. Infrared analysis revealed that colloidal precipitates, such as basic lead oleate, Pb(OH) (01) (s), do not adsorb on quartz, but that some other form of basic
lead oleate, such as Pb(OH) (01) (aq), is adsorbed on the surface following contact of the quartz with a solution containing lead and oleate ions.
Microflotation experiments, conducted with fatty acids of various carbon contents, indicate that a neutral and undissociated basic aqueous complex, e.g.
Ca(QH)(RC00)(aq), is the species of metal ion and collector responsible for flotation.
CONTENTS
Page
INTRODUCTION ... 1
EXPERIMENTAL TECHNIQUES AND EQUIPMENT ... 4
Ultraviolet Absorption Spectra ... 4
Colloidal Solution Precipitation ... 5
X-Ray Powder Patterns ... 5
Infrared Absorption Spectra ... . . 6
Microflotation Experiments ... 7
EXPERIMENTAL MATERIALS AND REAGENTS ... 9
Q u a r t z ... 9
Water • • . . • • * ... 10
Reagents ... . . . 10
Page
EXPERIMENTAL R E S U L T S ... 13
Ultraviolet Absorption Spectra ... 13
Colloidal Solution Precipitation ... 18
X-Ray Powder P a t t e r n s ... 18
Infrared Absorption Spectra ... 21
Microflotation Experiments ... 23
DISCUSSION OF RESULTS ... 32
Theoretical Considerations of Light Scattering 32 Interpretation of D a t a ...34
C O N C L U S I O N S ... 44
LITERATURE CITED ... 48
ILLUSTRATIONS
Figure Page
1. Relationship of optical density as a function of aging time for colloidal solutions of basic lead o l e a t e ... 15 2. Relationship between optical density and
wavelength for two colloidal solutions after
aging for five h o u r s ...16 3. Relationship of DA4 to A for a basic lead
oleate colloid at pH 9 ...17 4. Infrared spectra for quartz, quartz-basic lead
oleate, basic lead oleate, and lead oleate . . 22 5. Relationship between flotation recovery and pH
at constant oleate additions (10” mole per
liter) for two lead r e a g e n t s ... 27 6. Flotation recovery as a function of pH at
constant additions gf 5 x 10” mole per liter
calcium and 3 x 10” mole per liter nonylic acid 28 7. Flotation recovery as a function of carboxylate
addition at a constant calcium addition of
5 x 10“4 mole per liter and constant pH of 11.5 for various saturated fatty acids ... 29
Figure Page 8. Flotation recovery as a function of lauric
acid addition at various calcium additions and
a constant pH of 1 1 . 5 ... 30 9. Flotation recovery as a function of undecylic
acid addition at various calcium additions and
a constant pH of 1 1 . 5 ... 31
ACKNOWLEDGMENTS
The author wishes to thank Dr. M. C. Fuerstenau for guidance and encouragement during this investigation, and the Colorado School of Mines Foundation, Inc. and the National Science Foundation for the financial support that was provided.
The author also wishes to thank Mr. A. L. Pierce, Professor H. Frost, Jr., and Dr. N. C. Schieltz for their advice and assistance before and during this investigation.
INTRODUCTION
The activating effect of polyvalent metal ions in non-metallic flotation systems is of considerable interest because natural waters normally contain a number of these ions in solution. Various authors (1, 2, 3, 4, 5, 6) have
J.J. _1_L + 4 - + + 4- I I
shown that ions such as Ca , Ba , Cu , Pb , and Fe , activate quartz when anionic collectors, such as fatty acids, are used.
Recent studies (7, 8, 9, 10) have shown the essential role that hydrolysis of metal ions assumes in activation phenomena. These studies have also suggested that colloidal precipitates such as basic lead oleate,
Pb (OH) (01) (s) , may function as collectors in these systems. In this previous work, it has not been possible to
determine:
1. whether the precipitate is actually adsorbing on the mineral surface?
2. Whether an aqueous complex, e.g.
Pb(OH) (RCOO) (aq) , in equilibrium with the precipitate is adsorbing? or
3. whether the first hydroxy complex, PbOH+ , of the metal ion alone results in activation. The purpose of this investigation is to determine which, if any, of these three species is responsible for the flotation of quartz.
A number of experimental approaches were used in this determination, i.e. Rayleigh light-scattering, infrared spectroscopy, x-ray and analytical chemical tech niques, and microflotation. If these systems follow
Rayleigh light scattering principles, direct determination of the size and number of colloidal particles can be made. If the precipitate is adsorbing on the mineral surface, then the number of colloidal particles will decrease, but their size will not. If a species in equilibrium with the precipitate is adsorbing, then the size of the colloidal particles will decrease but their number will remain the same.
Infrared analysis was used either to confirm or rule out the possibility of the adsorption of the precipi tate on the quartz surface. Moreover, the infrared analy sis was used to establish what differences might exist between the adsorbed compound and bulk basic lead oleate.
Finally, experiments were conducted with fatty acids of various carbon contents to determine whether flotation is possible at concentrations of collector and metal ion combined, below the point of precipitation of the metal collector salt.
EXPERIMENTAL TECHNIQUES AND EQUIPMENT
The techniques used and the equipment involved in each phase of this investigation were?
Ultraviolet Absorption Spectra
Absorption spectra were obtained for a series of colloidal solutions by using a Beckman BK-2 spectrophoto meter and a quartz cell having a 10-mm path length.
Absorbencies were measured for most of the samples between 6500 A° and 3500 A°. Absorbencies for one sample were measured between 9000 A° and 4000 A°.
Samples consisted of portions of the original solution transferred to the quartz cell. The reference solution was conductivity water which had a conductance of one micromho. All colloidal solutions contained 10“^
mole per liter lead ion and oleate ion.
Colloidal Solution Precipitation
A standard clinical centrifuge was employed to obtain precipitate samples from the colloidal solutions. The colloidal solutions were transferred to Pyrex centri fuge tubes and were centrifuged for 20 min at 13,000 rpm. The samples obtained were transferred to beakers with a stainless-steel spatula and dried in a dessicator.
X-Ray Powder Patterns
Powder patterns were obtained in a cylindrical 10-cm-diam camera, which was mounted on a Phillips x-ray diffractometer. Copper K<*. radiation was employed for 3 hr on a 0.005-in.-thick cylindrical specimen. The film was loaded according to the Debye method "a" (11). The
specimens were originally prepared by mixing a quantity of the powdered sample with Duco Cement to make a paste.
When the paste was just barely tacky, it was rolled into a cylinder on a jig which consisted of two glass plates
separated by 0.005 in. The bottom plate was stationary, but the upper one was movable. Samples prepared in this manner were not found to be satisfactory because of incon sistency, which was probably caused by a chemical reaction
between the sample and the Duco Cement. Later specimens, prepared by filling a glass capillary with the sample, were found to give satisfactory results. These capillaries were prepared by drawing a Vycor tube down to approximately
0.005 in. ID.
The unknown "d" values were found by measuring the film distance to a reflection line, converting to the angle of reflection in degrees and solving Bragg*s Law (12):
n A = 2d sin © for "d".
Infrared Absorption Spectra
Infrared absorption spectra were obtained with a Perkin^Elmer 521 infrared spectrophotometer, using a
potassium bromide pressed-disc method. The discs were prepared by adding about 5 mg of sample to 0.4000 g of potassium bromide. Thorough mixing was accomplished in an agate mortarT This mixture was transferred to a stainless- steel die. The die was evacuated under vacuum for 10 min and then loaded to 20,000 lb, total load, and held for 2 min. The 0.03-in.-thick translucent disc thus obtained, had a transmittance of 40-to 80-percent at 4000 cm
When the discs were not in use, they were kept in an enve lope and stored in a dessicator.
Microflotation Experiments
The microflotation experiments were conducted with the system described by Perinne (13) and Fuerstenau
(14) because of its two main advantages:
1. System contamination is kept to a minimum when no metallic components are utilized.
2. Small charges of pure mineral may be used. The experiments were conducted at room temperature with the following technique:
1. All glassware was acid cleaned and rinsed with conductivity water.
2. Predetermined volumes o f ,conductivity water and metal ion solution were combined, and the pH was ad justed with potassium hydroxide or hydrochloric acid.
3. A calculated volume of fatty-acid collector solution was added which made the final volume 150 c c .
4. One drop of an iso-amyl alcohol solution con taining 20 parts water to one part alcohol by volume was added as frother.
5. Five g of quartz were added, and the pulp was conditioned for 5 min.
6. The pH of the pulp was measured.
7. A volume of 100 cc of purified nitrogen was passed through the system at a constant pressure. The resulting froth was collected, dried, and weighed.
8. The tails were removed from the cell, dried, and weighed.
EXPERIMENTAL MATERIALS AND REAGENTS
The following materials and reagents were used in this investigation:
Quartz
The mineral studied was pegmatitic quartz from New Mexico. In its previous treatment it had been
1 crushed and sized to 48 x 150 mesh,
2 — leached with aqua regia and rinsed with distilled water,
3.— releached with concentrated hydrochloric acid until no iron could be detected in leach liquor with potassium ferrocyanide,
4 — washed with conductivity water until the pH of the wash water was reached,
5 — dried.
The quartz used in the infrared investigation wa? ground for 40 hr in a ceramic mortar. A portion of this material was examined by the infrared technique described earlier. The remainder was then contacted with a colloidal solution containing 4 x 10"^ mole per liter lead ion and
-4
4 x 10 mole per liter oleate ion. This pulp was condi tioned 2 hr, allowed to settle 2 hr, and the suspended
quartz was decanted. The decanted solution was centrifuged for 20 min to obtain the sample for infrared analysis.
Water
The conductivity water used in all of the experi mental work was made by passing distilled water through an ion exchange column.
Reagents
The chemicals used in this investigation were all of reagent grade. The fatty acids, obtained from the
Hormel Institute, all had a reported purity of 99-percent. The specially prepared compounds and their techniques of preparation were:
1. Potassium oleate (15) --Oleic acid was
dissolved in a solution of absolute ethanol which contained 10 mg/ml of potassium hydroxide. The precipitate resulting from the evaporation of the above mixture, under reduced pressure and elevated temperature, was washed with ether,
filtered, dried, and dessicated under reduced pressure in the presence of sulfuric acid.
2. Lead oleate (16) — Sufficient potassium oleate solution was mixed with a lead acetate solution at pH 5.5 to yield 3 g of lead oleate. The resulting precipi tate was allowed to stand for 1 hr, filtered, and washed with water several times. It was then washed with alcohol,
followed by a small amount of cold ether, dried, and dessi*^ cated. This material was soluble in ether, slightly solu ble in alcohol, and melted at around 50°C. Carbon and lead analyses of this material were not made since these prop erties are characteristic of lead oleate.
3. Basic lead oleate — The same procedure as that for the preparation of lead oleate was used, except that a pH of 9 was employed. In two analyses for carbon and lead in this material, made by the Colorado School of
Mines Research Foundation, 35.2 and 37.1 percent carbon and 45.9 and 48.5 percent lead were determined, respectively. A number of compounds, one of which may be basic lead
oleate, have compositions close to these figures (Table 1). This material was only slightly soluble in ether and alco hol and decomposed without melting at a temperature above 50°C
Table 1 - Formulas and compositions of some lead compounds corresponding to carbon and lead analyses determined for basic lead oleate
Formula Percent Lead Percent Carbon
PbCC>3 • 2Pb (OH) (01) 2Pbeo3 -Pb(01)2 48.6 48.8 34.8 35.9 2Pb (OH) 2 *Pb (01) 2 3Pb (OH) 2 ’ 2Pb (01) 2 2Pb0 ° Pb (01) 2 49.6 45.6 51.2 35.6 34.5 38.5
EXPERIMENTAL RESULTS
The results of this investigation/ presented separately for each phase of experimentation, appear as graphs, tables, and statements.
Ultraviolet Absorption Spectra
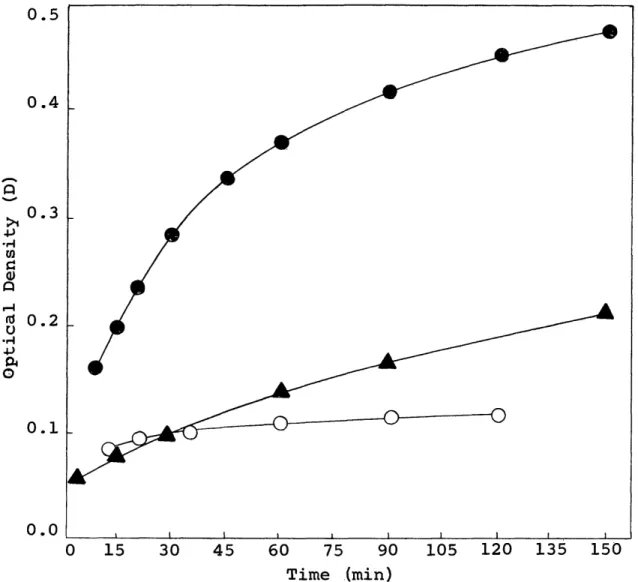
The absorption (A) or optical density (D) of several of the colloidal solutions was determined as a function of time (Figure 1). These determinations were made at two different wavelengths of light to establish the effect of wavelength. Because the absorption was found to increase with time in all cases, the solutions were allowed to stand or age for 5 hr before measuring the absorption as a function of wavelength (A). This relationship appears in Figure 2. The type of light scattering study attempted in this investigation, which
will be discussed later, requires a slope of minus 4 in this type of plot. The experimental slopes were minus 1.35 and minus 1.67.
4*
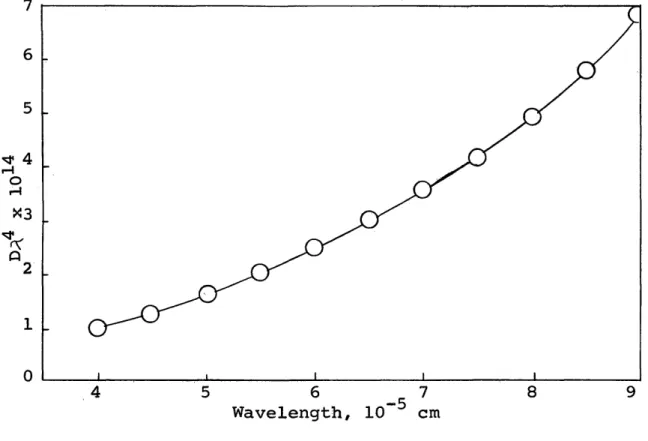
The quantity D A , for this type of study, should not vary with wavelength. The experimental values of , as a function of wavelength, appear in Figure 3.
When the solutions were allowed to age for two days, the colloid precipitated out, leaving a clear solu tion. A microscopic examination of this precipitate revealed it to be non-isotropic. Finally, a study of pH as a function of time showed a decrease in pH as time progressed.
* .
O p t i c a l D e n s i t y ( D ) 0.4 — o
o.o
90 105 120 135 150 0 15 30 45 60 75 Time (min)Fig. 1 - Relationship of optical density as a function of aging time for colloidal solutions of basic lead oleate.
*
# pH 9 - water stirred for 45 min before addition of lead and oleate ions - A = 3500 A°
O pH 9 - water stirred for 5 min before addition of lead and oleate ions - A = 6000 A°
A pH 11 - water stirred for 5 min before addition of lead and oleate ions - A = 6000 A°
L o g 0.0 0.1 - 0.2 -0.3 -0.4 Q -0.5 - 0.6 -0.7 - 0.8 -0.9 - 1.0 2.7 3.0 2.5 2.6 2.8 2.9 Log A
Pig. 2 - Relationship between optical density and wavelength for two colloidal solutions after aging
for 5 hours.
A pH 11 — slope = -1.35 O pH 9 slope = -1.67
4 5 8 6 -5 7
Wavelength, 10 cm
9
4
Fig. 3 - Relationship of D A to A for a basic lead oleate colloid at pH 9.
Colloidal Solution Precipitation
Precipitates of lead oleate were present with low ++
additions of Pb and potassium oleate (Pb(01)2/ Ksp = —17
1.58 x 10 ) (17), but these precipitates could not be _3 separated from solution when concentrations less than 10
++
molar Pb and oleate were used. However, precipitates were separated from more concentrated solutions using a centrifuge, and these precipitates were analyzed by x-ray techniques.
X-Ray Powder Patterns
Analysis of the powder patterns gave "d" values corresponding to various compounds, depending upon the conditions of sample preparation. Table 2 gives experi mental "d" values found for lead oleate, and Table 3 gives experimental "d" values for the compound which is presumed to be basic lead oleate. Because no "d" values for lead oleate compounds could be found in the literature, the
values obtained for lead oleate and basic lead oleate could not be verified.
2 23.99 3 3 15.68 2 4 11.65 6 5 9.32 5 6 7.74 7 6.54 8 5.80 9 5.16 10 4.60 4 11 4.36 12 4.21 13 3.88 14 3.70 15 3.11 16 2.31 17 2.20 18 2.07 19 2.02 20 1.94
NOTE: Other lines present were too weak to verify or measure.
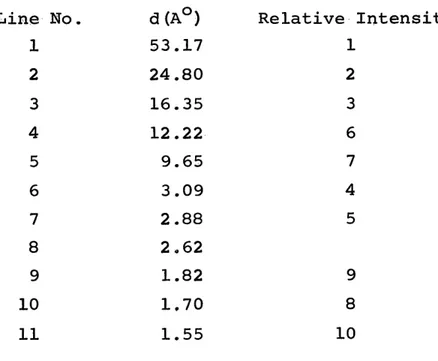
Table 3 - Experimental interplanar spacings found for basic lead oleate
Line N o . d(A°) Relative ;
1 53.17 1 2 24.80 2 3 16.35 3 4 12.22 6 5 9.65 7 6 3.09 4 7 2.88 5 8 2.62 9 1.82 9 10 1.70 8 11 1.55 10
NOTE: Other lines present were too weak to verify or measure.
X-ray analysis also showed that co-precipitation of various compounds occurs in some cases, e.g. lead oleate
— 3
and basic lead carbonate at pH 7 using 10 molar lead and oleate ion.
Infrared Absorption Spectra
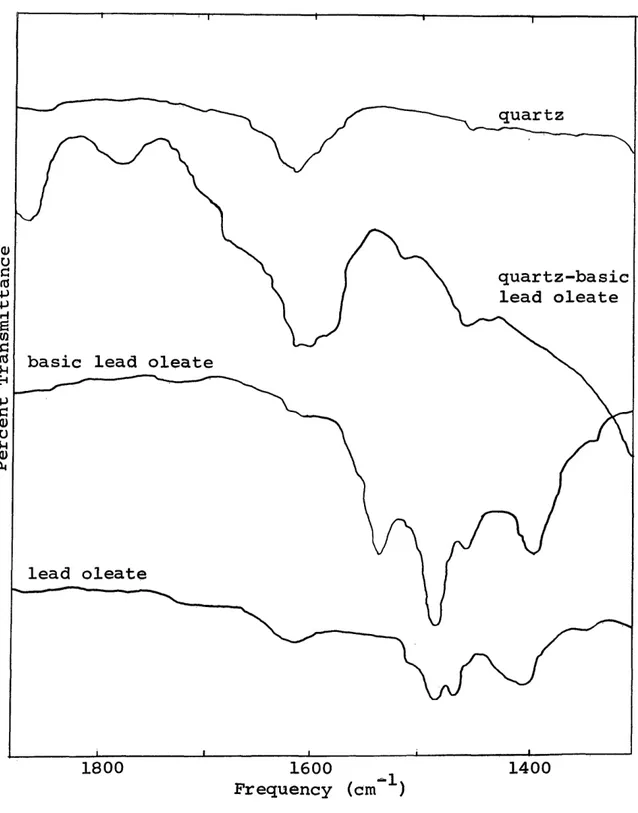
Infrared absorption spectra were obtained for lead oleate, basic lead oleate, quartz, and quartz condi tioned with a colloidal solution of basic lead oleate. A portion of each of these spectra appear in Figure 4. The absorption peak, which appears in all four patterns near 1600 cm”\ is characteristic of potassium bromide. The quartz shows no characteristic absorption in the region between 1900 cm"^ to 1300 cm”\ but the quartz-basic lead oleate system shows one absorption peak at 1865 cm"^ and another at 1780 cm"*’, both of which are rather broad, and two other slight peaks appear at 1520 cm ^ and 1460 cm ^ . Basic lead oleate has characteristic peaks at 1538 cm \ 1485 cm” S 1460 cm”\ and 1395 cm"^. Lead oleate also has a peak at 1485 cm’^, but it is not as strong as the basic lead oleate peak. The other peaks which are characteristic of lead oleate occur at 1468 cm"^ and 1400 cm
P e r c e n t Tr a n sm i tt a nc e quartz quartz-basic lead oleate
basic lead oleate
lead oleate
1800
16 0 0
Frequency (cm )
1400
Fig. 4 - Infrared spectra for quartz, quartz-basic lead oleate, basic lead oleate, and lead oleate.
Microflotation Experiments
A series of flotation experiments were conducted with constant additions of lead and oleate ions to estab
lish the pH range in which flotation is possible. With -4
additions of 10 molar lead ion, as shown in Figure 5, no flotation was possible below pH 6, but complete flotation was effected from about pH 7.5 to 12. The system was de pressed at about pH 12.5 because of the formation and stability of plumbite ion. As shown previously (18, 19) the pH range in which complete flotation is obtained is the range in which Pb++ has hydrolyzed to PbOH+ . Both lead chloride and lead acetate were used as the source of lead ion because x-ray analysis revealed the presence of basic lead chloride under certain experimental conditions. As shown in Figure 5, however, essentially no difference in
r
flotation response was noted with these two chemicals. Also shown in Figure 5 is the flotation response of quartz
-3
with additions of 10 molar lead ion. Complete flotation was effected at pH 6 in this case, and depression occurred at pH 8.5.
Lead ion was selected for study as activator because almost all of the added Pb++ has hydrolyzed to
PbOH+ at pH 8 to 9. This phenomenon made it convenient for study with x-ray and infrared techniques because the pre cipitate obtained under these conditions will be a basic lead-collector salt. However, due to the limited solubility of the lead carboxylates, calcium was included as activator in this study. The solubility products of the calcium
carboxylates have been recorded in the literature (note Table 4).
When a curve of flotation recovery as a function of pH was determined at constant fatty acid and calcium additions, it was found that no flotation was possible below pH 9.8, but that complete flotation was obtained above pH 11 (Figure 6). These concentrations were below those required for precipitation of calcium nonylate, and no precipitate was observed. It should be mentioned that in the lead—oleate system (Figure 5), presence of a pre cipitate (lead oleate at low values of pH and basic lead oleate at higher values) was noted until pH 12.5.
The next series of experiments were conducted to determine the flotation response of quartz with various fatty acids at constant pH and calcium addition. As shown in Figure 7, essentially no flotation was obtained with 3 x ' 10"""* molar lauric acid and below, but complete
flota-„ c
tion was obtained with 5 x 10 mole per liter. As the chain length of the fatty acid is reduced, the addition of collector necessary for flotation is increased. That is, no flotation was achieved with the 9-carbon fatty acid
—3
until an addition of 2 x 10 mole per liter was made. Arrows denoting the additions of the various fatty acids at which the various calciurti carboxylates precipitate have been drawn in these figures. Only in the case of the
12-carbon fatty acid does calcium carboxylate precipitate before flotation is possible.
Additional experiments with lauric acid were per-++
formed with various additions of Ca at constant pH tp establish whether calcium laurate must be precipitated
before flotation is effected with this collector (Figure 8). Again, arrows were drawn at the lauric acid addition, at which calcium laurate precipitates. It could be noted that
in each of the three cases, precipitation did result before flotation was possible.
Figure 9 shows similar data for the 11-carbon fatty acid, undecylie acid. As shown, as the calcium addition is increased at constant pH, the addition of collector necessary for flotation is decreased. In each of these systems, no precipitation of calcium undecylate occurred.
m o 5-Q) P rd <U p C rd P co C O u P rd & • co rO P c c rd <D tr> > i rd p (U <u P > O TJ U rd (U <U P <—I c o O £ *H P P rd P P O O <H H m ^ p c <u <y -p <u *h S «h p (U P ,Q a) A ai •p <u .C r-» co O c e o •.-w ■p t rd o rH H Q) ^ OS 1 m co C O •H P • * H tPTJ •P T3 fa rd 04 V Oi SI i o ip <] OJ iH
5 5
-04si
i o < CM O 04 SI ro I O H ( ^ iis o ja a ) Aj0a o d0h uoTq.0q.oi,j1 0 0 co CM CM
(^uaojcad) AjdAooa>H uot^Te^ou
04 m *U 0 •H U CO rd c 0 O •H •H -P i—1 ■H > i •u c no 0 rd 0 -P u C (U rd •p 4-> •H (0 r—1 C 0 u O Q) 04 -P rd 0 I—1 a 0 04 e m co 0 i o c r—1 0 •H X -p u CO o 0 'O 0 rd rd S 0} 0 ; rd u r-T P rd (U 0 > 0 P U 0) <u -p 5-1 •H i - 1 C 0 P •H Q) -P 04 rd ■p (U 0 iH H 0 6 1 i VO o i—i • 01 X •H Cn in
r-l im CM in u o >1 o ■p A r -l r— I CM i—I P CD -P •H r— I p CD O. CD r-4 o B e o •H +j - r l <P •P rtf r -l > i o A p td u •p c rd -p CQ C! O U (tf CQ 3 O ■H P td > P G m -p ro in CJ r-I O rH •H •P M-l •H O fO 'u tn rd & -P 3 rd -P >1 co X o o ,Q U P rd *0 U G rd P CD ■P * r | m o c o •H ■P U c m rd CQ td >ii p o (U r -l > O U P CD CL. CD i—I o s x (D in P g O • r l 4-> m o CQ • r l u rd S O td *h -P -P O -H .. r l t f IH rd T3 > i •P ■P rd I B r-' 3 ■H • U tfl i—I •H rd fx. u CD -p rd p 3 •p rd CQ (q.ueo^ad) Aj s a o o g^ uoT^e^o-[d
C a l c i u m Ad dition + + + + + + rd rd rd O u o S I S I S I 1 i i o o o rH l—J H X X X LT> CO i—1
o
<3
• __________i__,________i_ o o o O 00 VO pH (q-usojcaa) CO I o r> I I_________________ I__________________ o O © O i—I (N F i g . 8 - F l o t a t i o n r e c o v e r y as a f u n c t i o n of l a u r i c a c i d a d d i t i o n a t v a r i o u s c a l c i u m a d d i t i o n s an d a c o n s t a n t pH of 1 1 . 5 .+ + G O •H •P •H 'O »D < B 3 •H u r—1 rd O rd u + + rd U + + rd U + + rd u + + rd u + + rd U S I S I S I S I S I S I 1 o r -l i o r - 1 1 O 1—1 1 o H I o CO I o 1—1 X X X X X X H CM 00 in 00 r l ■
<3
□ •0
<
no I O u (U -p •H H U <D ft 0) r 4 o g ( ^ U 0 O J 0 c [ ) A J 0 A O D 0 H U O T i e ^ O U F i g . 9 - F l o t a t i o n r e c o v e r y as a f u n c t i o n of u n d e c y l i c a c i d ad d iti on at v a r i o u s c a l c i u m a d d i t i o n s an d a c o n s t a n t pH of 1 1 . 5 .DISCUSSION OF RESULTS
A background discussion of the theoretical as pects of light scattering as applied to colloidal solutions will be helpful in analyzing the results obtained in this phase of the investigation.
Theoretical Considerations of Light Scattering
The mathematical relationships of light scatter ing by particles in solution have been worked out by
Rayleigh (20), Einstein (21), and Debye (22). Debye developed an expression for dilute solutions:
32ir^M-c 'n02 I n-n0\ ^
Y - - -- — --- E g . (i)
3NA \ c /
y , c, M, N, n, nQ/ and A are turbidity, solute concentration in grams per milliliter, molecular weight, Avogadro's num ber, refractive index of solution, refractive index of solvent, and wavelength of light, respectively,
Equation (1) holds for a system under the following conditions (23):
1. Turbidity is related linearly to concentration.
2. The term DA4 is constant with A 7 if not absorption is indicated (24, 25).
3. A plot of log D against log A is linear with a slope of -4. A different slope means the particle size is larger than 0.1 of the shortest wavelength of light used.
Another expression, based on the ratio of the refractive index of the solute and solution (m), has been developed (26) which relates turbidity and (r), the par ticle radius. This expression is:
128Tr5N/m2-l\2 cr6
'T' = — — ■-- 1--- Eq. (2) 3 A*4 \m2+2 / M
where A* = = wavelength in solution. no
Equation (2), when combined with the definition of turbidity from Lambert's Law:
+ (2 . 303)A
T = Eq. (3)
(where x is path length and A is absorbency or optical density D) enables one to calculate M and (r) and also compute the particle density.
Direct determination of the size and number of colloidal particles would enable one to determine whether the precipitate is adsorbing on the mineral surface or not. Interpretation of Data
The colloidal solutions did not meet the required conditions mentioned in the theoretical aspects of light scattering. Figure 1 indicates that the colloidal particles were growing from the time that they were prepared. Eventu ally, they grew sufficiently large to precipitate out. The microscopic examination of one of these precipitates reveal ed the element of anisotropism. Figure 2 shows that the particles were larger than 0.1 of the wavelength of light used because the actual slope was less than the required slope of -4. Figure 3 shows that the colloids absorbed light in the region investigated, because the plotted relationship between D?$ and A was not constant with a slope of zero.
The fact that the colloidal solutions did not con form to the necessary conditions indicates that this type of study is not applicable to these colloidal solutions.
The infrared technique was useful for differenti ating between lead oleate and basic lead oleate as well as for observing the presence of some form of basic lead
oleate on the quartz surface (Figure 4). When the basic lead oleate and quartz-basic lead oleate patterns were com pared, a frequency shift of two of the basic lead oleate peaks occurred. That is, the peaks occurring at 1538 cm~^ and 1485 cm"^ in the basic lead oleate pattern had been shifted to 1520 cm~^ and 1460 cm"^, respectively, in the quartz-basic lead oleate pattern. The third major peak of basic lead oleate was not present probably because of the
strong absorption by quartz, which began around 1400 cm”^. Microflotation experiments were conducted with lead as activator and oleate as collector to compare the flotation response with the species of collector. As shown in Figure 5, system depression results at pH 5.5 and below; X-ray analysis also showed that lead oleate was formed under these conditions.
Complete flotation was obtained from about pH 7 to pH 12 with 10“4 molar lead and oleate. This is the
++
region in which appreciable hydrolysis of Pb ion occurs. This fact may be seen from the following hydrolysis
equilibria (27):
Pb++ + H20 PbOH+ + H+ K = 6.67 x 10”7 PbOH+ + H 20^ = ± Pb(OH)2 (aq) + H+ K = 1.26 x 10"11 Pb(OH)2 (aq)^=^HPb02" + H+ K = 1.2 x 10"11
In this region of complete flotation, it is likely then that any precipitate of the metal-collector will be a basic com- pound; i.e., it will contain PbOH or PbO. The depression observed above pH 12 can be attributed to the formation and stability of plumbite ion, HPb02“ (28).
The system depression observed in the more
concen-_ *3 J.J.
trated solutions (10 molar Pb ) above pH 7 is due to the co-precipitation of basic lead chlorides and carbonates. This co-precipitation was determined from x-ray data.
Because of the insolubility of lead carboxylates and the large number of ionic lead species in solution during lead activation, the study was extended to include
calcium ion activation. In the calcium system, the two important ionic calcium species present below pH 12 are the calcium ion and the first hydroxide complex of calcium. The calculated concentrations of the species present at
50-percent recovery in these systems are given in Table 4. The calculations were based on the following equilibria
(
20) :
Ca++ + CaOH+ K = 32 .4
HRCOO^=±H+ + RCOCT K = 2 x 10“5
Comparison of the actual concentration of carboxylate ion in solution necessary for 50-percent re covery with the value necessary for calcium carboxylate to precipitate yields an interesting observation. That is, only in the case of the 12-carbon fatty acid does precipitation of calcium carboxylate occgr before flota tion (Figure 8 and Table 4). This phenomenon is similar to that which was observed previously (30, 31, 32).
The coupling of these facts with the fact that flotation is achieved with the shorter chained homologues before the calcium-collector salt is precipitated
'U p 53 CD 0 eu >1 P p p P -p p 0 <D S3 rd 04 -P rd p (D rd -p p P r—1 03 0 ro >i S3 <D ' O X O S3 P S3 0 U 0 rd rd A •H p P td P S3 03 rd ■H P S3 U -p TS rd O rd TS 03 • rl g rd P S3 U> rd -H p g S3 P u <D S3 •rl P rl > •r| 03 S3 rd O U S3 (D U U r-l U CD rd P S3 P P U <D O O P U S3 p •H 03 O S3 P g -P •rl rd S3 U P P P •rl S3 td 03 CD U TJ p S3 Qa r-l O 0 O rd P 1— 1 U <D U Qa P H TS 0 'U >1 P S3 g <D -P S3 rd -P •H <D rd i—1 u m 1 r-l • rl p • o S3 x i CD I—1 r - l U S3 & i i—I |— 1r—1 I X rd 0 O p u 03 in 0 m 03 •H u <u P A rd Eh 4-(d U % CN o o K rd & w t| 53 o + + rd U 03 g O P rd S3 O A 'A g P S3 rd S U p o p <D co| 1 | LOI 1 o 1o 1o 1o
I—A r-A i—l i—l
X X X X CN o r—1 CN <n CN o P CO <T> | i—I 1 r-l1 l—l1 I O 1 o 1o 1o 1— 1 i—l i—l r-l X X X X o GO CN o • • • • 00 CO CN 00 co m 1 1 1 I o o O o l—l r l r—1 r-l X X X X CN CN CN • • • • r -l i—l in in in in l l I l o o o o i—i i—i r—I p X X X X VO VO VO vO t • • • si1 1 I i I o o o o l— l f—I i—I p X X X X m • m• in• in• <JY CN > i P <u > 0 u CD p -p S3 0) u p CD Qa 1 o in p o P > i P rd 03 03 CD u (U S3 S3 O -H -P rd p •P S3 <13 U S3 O U c o A P rd V O ' S3 •H S3 ■H o s-p fU • >1 -P 53 <Q S3 <U H rS3 -p • g p <3 O l CD I P O 03 Pi <« = CD P 03 & P S3 <D H |—I W <D P •H U •H 23 TJ S3 rd rd S3 o rd S3 P <D O -P 03 p S3 O <D -H £ Id -p g o O r-l P M-l U •H S3 O •H S3 TS <D S3 •H (6 s * O S3 •H 03 S3 rd p Eh 03 P (D (D S3 -H CP S3 td <D S3 S3 P r - l td -P rd ^3 CL) > U S =tt=
(Figure 7 and Table 4) provides the best evidence to date that an aqueous basic metal-collector complex such as Ca(OH)(RCOO)(aq) is the species responsible for flotation.
Formation of this neutral species can occur by either of two routes. First, the complex could form by the following reaction:
CaOH+ + R C O O C a (OH) (RCOO) (aq)
or
(aGa(OH) (RCOO) (aq))
•--,---- = K
faCaOH+S) (aRCOO~)
If Ca(OH)(RCOO)(aq) is functioning as the
collector in these systems, at constant pH the activity of Ca(OH) (RCOO) (aq) should be constant for a given flotation recovery. As a result, the mass action expression may be rewritten as 1 ^aCaOH+^ (aRCOO“) or faCaOH+ ) faRCOO"^ = K * = K"
The concentration of undecylie acid, at which -4
50-percent recovery is obtained, is 4 x 10 mole per liter (assuming that a negligible amount has adsorbed on the
. - 4
quartz) with 1 x 10 mole per liter calcium present at pH 11.5. Under these conditions there is 9.2 x 10"^ mole
4 4
per liter CaOH present. If the activities of CaOH and RCOO*" are calculated from the Debye-Huckel limiting law, their product, K", will be
(6.9 x 10"6) (3.7 x 10”4 ) = K" = 2.6 x 10~9
With the use of this value for K", it should be possible, if this model is correct, to predict the carboxylate
activities necessary for 50-percent recovery at different calcium additions. The actual and predicted activities of RCOO"* for 50-percent recovery, using the 11-carbon acid,
44 are given m Table 5 for various additions of Ca
Good agreement is obtained between predicted and
-4 -4
actual activities of undecylic acid when 1 x 10 , 2 x 10 f
—4 4-H
and 3 x 10 molar Ca is added, each m its respective experiment. The agreement is not so close for higher additions of Ga+ + . It is likely though that there is a
greater possibility of interference from dissolved carbon ate with the higher additions of Ca++
Table 5 - Actual and predicted activities of RCOO” , for 50-percent recovery, for various additions of calcium ion at pH 11.5 when using undecylic acid as collector. Calcium Addition (mole/liter) 1 x 10⁻⁴ 2 x 10 3 x 10⁻⁴ 5 x 10 ■4 8 x 10⁻⁴ 10 x 10 Predicted RCOO" Activity 3.7 x 10 -4 1.9 x 10 1.3 x 10 -4 -4 7.9 x 10 5.0 x 10⁻⁵ 4.1 x 10 Actual RCOO* Activity 3.7 x 10⁻⁴ 1.9 x 10⁻⁴ 1.4 x 10'■4 1.1 x 10 7.8 x 10 -4 -5 6.9 x 10⁻⁵
The second route — * in those cases where a
colloidal precipitate of the metal-collector occurs before flotation, it seems logical to expect that an aqueous
complex will be in equilibrium with the precipitate, as shown in the following equations
This premise is drawn by analogy from other solution data (33) :
Pb (OH) 2 (s)^— ^Pb (OH) 2 (aq) K = 3.65 x 1CT4
Also, in another study, (34), co-precipitation of the metal- collector and the basic metal-collector salts was found to occur. By this route then, a certain concentration of Ca(OH) (RCOO) (aq) will be in equilibrium with the basic pre cipitate. When some of this species is adsorbed on the mineral, the solution is depleted by this amount, and more will come out of the precipitate to equilibrate the system. Therefore, the same aqueous species is probably responsible for flotation in these cases, and one mechanism by which this complex could adsorb is shown below.
Representing the fracture sites from freshly broken quartz as (35):
Plane of Fracture
where hydrogen ion can adsorb on Site A, O. O Si O + 2H~ Surface O. .0 - .-Si . 0 ^ Surface
and hydroxyl on Site B,
-Si Si + + +20H” / Surface \ Si Si OH OH / Surface
With Site B, adsorption may occur by splitting out water as follows:
\
\
Si Si
[OH~_ H] O-Ca-RCOO (aq) ^=^-0 OH .Si Si / I 0-Ca-RC00 OH +h2o
Surface Solution Surface Solution
Adsorption of the aqueous complex could occur by splitting out water that forms from the combination of hydrogen from the hydroxyl of the complex with an adsorbed hydroxyl.
With this mechanism, there is some reason for forming the basic salt or aqueous complex in these activation systems.
CONCLUSIONS
Light scattering, infrared, x-ray, and chemical techniques were used to study the properties of a basic metal-organic colloidal precipitate. A series of micro flotation experiments were conducted to determine the active species of metal ion and collector in flotation. The results of these experiments lead to the following conclusions:
1. Rayleigh light-scattering techniques are not applicable to these systems. The colloidal particles grow too fast and become too large for this type of study.
2. Precipitates cannot be separated from
solu-—3 ++
tion unless concentrations greater than 10 molar Pb are used.
3. X-ray techniques are useful in differentiat ing between lead oleate and basic lead oleate, but the lack
of published data prevents the positive identification of the compounds in basic lead oleate.
4. Chemical analysis indicates that basic lead oleate is a mixture of lead compounds whose overall carbon content is about 36-percent and whose lead content is about 47-percent. This mixture decomposes above 50°C without melting and is only slightly soluble in alcohol and ether.
5. Infrared analysis of quartz conditioned with a colloidal solution of basic lead oleate suggests that not the solid precipitate, but some other form of basic lead oleate, such as Pb(OH)(01)(aq), is adsorbed by quartz dur ing flotation.
6. Little difference in the flotation response of quartz is observed when the source of activating lead ion is lead chloride or lead acetate.
7. The formation of lead oleate in preference to basic lead oleate below pH 5.5 is apparently responsible for depression of quartz flotation. The formation of basic lead carbonates and chlorides is probably responsible for depression above pH 8 in the more concentrated solutions of lead ion.
8. When saturated fatty acid collectors are used in quartz flotation, quartz begins to float before precipi tation of calcium carboxylate with undecylic acid and lower carbon homologues.
-4
9. The depression observed when 2 x 10 mole per liter lauric acid was used is probably due to the forma tion of calcium carboxylate in preference to the basic
calcium carboxylate.
10. A flotation constant K", determined by the calcium and carboxylate activities at constant flotation
recovery, may be used to predict the carboxylate activities necessary for the same recovery at different calcium con centrations and the same pH. This K" holds for cases where flotation occurs before precipitation of calcium carboxylate when short chain fatty acids are the collectors. The devia
tion of the predicted values from the actual values at higher calcium concentrations is probably due to carbonate species complexing part of the calcium. Hence more carboxylate is required for flotation to occur.
11. The results of these experiments suggest that a neutral and undissociated basic complex, e.g.
Ca(OH)(RCOO)(aq), is the active species of metal ion and collector responsible for flotation.
LITERATURE CITED
1. Gaudin, A. M . , Flotation: 2nd ed., New York, McGraw-Hill Co., p. 321-322 (1957).
2. Sutherland, K. L., and Wark, I. W . , Principles of flotation: Melbourne, Australasian Inst, of Mining and Metallurgy, p. 167^177 (1955).
3. Cooke, S. R. B., and Digre, Marcus, Studies on the activation of quartz with calcium ion: Am. Inst. Mining Metall. Engineers Trans., v. 184, p. 299-305
(1949) .
4. Gaudin, A. M., and Chang, C. S., Adsorption on quartz from an aqueous solution of barium and laurate ions: Mining Eng., v. 4, p. 193-201 (1952).
5. Schumann, Reinhardt, and Prakash, B., Effect of barium chloride and other activators on the soap flotation of quartz: Am. Inst. Mining Metall. Engineers Trans., v. 187, p. 591 (1950).
6. Eigeles, M. A., and Volova, M. L., On the mechanism of activating and depressant action in soap flotation: VII International Mineral Processing Congress, p. 269
(1964) .
7. Perinne, B. F., Lead activation in oleate flotation of quartz: Thesis, Colorado School of Mines (1964).
8. Fuerstenau, M. C., Martin, C. C., and Bhappu, R. B., The role of hydrolysis in sulfonate flotation of quartz: Am. Inst. Mining Metall. Engineers Trans., v. 226, p. 449 (1963).
9. Fuerstenau, M. C., and Atak, S., Lead activation in
sulfonate flotation of quartz: Am. Inst. Mining Metall. Engineers Trans., v. 232, p. 24 (1965).
10. Fuerstenau, M. C., Miller, J. D a, Pray, R. E., and
Perinne, B. F., Metal ion activation in xanthate flota tion of quartz: Am. Inst. Mining Metall. Engineers Trans., v. 232, p. 359 (1965).
11. Cullity, B. D., Elements of x-ray diffraction: Read ing, Mass., Addison-Wesley Publishing Co., p, 154
(1959).
12. Ibid., p. 84
13. Perinne, B. F., Lead activation in oleate flotation of quartz: Thesis, Colorado School of Mines, p. 5-^7
(1964) .
14. Fuerstenau, M. C., An experimental technique and
apparatus for microflotation studies; Eng. and Mining Jour., v. 165, no. 11, p. 108 (1964).
15. Perinne, B. F., Lead activation in oleate flotation of quartz: Thesis, Colorado School of Mines, p. 4 (1964). 16. Whitmore, W. F., and Lauro, M., Metallic soaps — their
uses, preparation, and properties: Indus. Eng. Chemistry, v. 22, no. 6, p. 646 (1930).
17. DuRietz, C., Progress in mineral dressing: Internat. Mineral Dressing Cong., Stockholm, Almquist and
18. Perinne, B. F., Lead activation in oleate flotation of quartz: Thesis, Colorado School of Mines, p. 35 (1964). 19. Fuerstenau, M. C., and Atak, S., Lead activation in
sulfonate flotation of quartz: Am. Inst. Mining Metall. Engineers Trans., v. 232, p. 26 (1965). 20. Lord Rayleigh, Phil. Mag., v. 41, p. 447 (1871). 21. Einstein, Albert, Ann. Phys., v. 33, p. 1275 (1910). 22. Debye, Peter, Jour. Appl. Phys., v. 15, p. 338 (1944);
Jour. Phys. and Colloid Chem., v. 51, p. 18 (1947). 23. Chun, B. D., Wadsworth, M. E., and Olson, F. A., Aging
of colloidal thoria: Inst, of Metals and Explosives Research, Technical Report no. XXII, University of Utah, p. 5 (1963).
24. Stacey, K. A., Light scattering in physical chemistry: New York, Academic Press (1956) .
25. Goring, D. A., and Johnson, P., Trans. Farad. Soc., v. 49, p. 367 (1952).
26. Orr, Clyde Jr., and Dallawalle, J. M . , Fine particle measurement: New York, Mcmillan (1959).
27. Latimer, W. M., Oxidation potentials: 2nd ed., Engle wood Cliffs, N. J., Prentice-Hall, Inc., p. 151 (1952). 28. Fuerstenau, M. C., and Atak, S., Lead activation in
sulfonate flotation of quartz: Am. Inst. Mining Metall. Engineers Trans., v. 232, p. 27 (1965). 29. Butler, J. N., Ionic equilibrium: Reading, Mass.,
Addison-Wesley Publishing Co., p. 287 (1964).
30. Perinne, B. F., Lead activation in oleate flotation of quartz: Thesis, Colorado School of Mines, p. 46
31. Fuerstenau, M. C., Miller, J. D., Pray, R. E., and Perinne, B. F., Metal ion activation in xanthate flota tion of quartz: Soc. of Mining Eng. Trans., p. 359, December (1965).
32. Fuerstenau, M. C., and Atak, S., Lead activation in sulfonate flotation of quartz: Am. Inst. Mining Metall. Engineers Trans., v. 232, p. 27 (1965).
33. Latimer, W. M . , Oxidation potentials: 2nd ed. Engle wood Cliffs, N. J., p. 151 (1952).
34. Roman, R. J., The mechanism of soluble salt flotation: Thesis, Colorado School of Mines, to be printed.
35. Gaudin, A. M., and Fuerstenau, D. W . , Quartz flotation with anionic collectors, Am. Inst. Mining Metall.