THESIS
ACCURACY OF WALKING METABOLIC PREDICTION EQUATIONS USING A LARGE DIVERSE DATA SET
Submitted by Rachel M. Woods
Department of Health and Exercise Science
In partial fulfillment of the requirements For the Degree of Master of Science
Colorado State University Fort Collins, Colorado
Summer 2014
Master’s Committee:
Advisor: Raymond C. Browning Mathew Hickey
Copyright by Rachel Marie Woods 2014 All Rights Reserved
ii ABSTRACT
ACCURACY OF WALKING METABOLIC PREDICTION EQUATIONS USING A LARGE DIVERSE DATA SET
Walking metabolic rate prediction equations are commonly used to estimate oxygen consumption, exercise intensity and energy expenditure across a wide range of ages and
anthropometrics. Despite their widespread use, independent validations of these equations using metabolic data from a large number of individuals are uncommon. PURPOSE: To assess the accuracy of the commonly used ACSM and Pandolf walking metabolic rate prediction equations, along with two new walking metabolic rate predictions equations developed by Weyand et al. and Browning et al., using data from a large number of adults. METHODS: We used
demographic, anthropometric, walking speed, and oxygen consumption data from several laboratories (N = 450 (164 Males, 286 females), 18-85 years old, 16.5-44 kg/m2). We estimated oxygen consumption using each prediction equation in 1,078 walking trials ranging from 0.55-2.18 m/s, and 0.5-12% grade. Comparisons between predictive methods were made for all walking trials, as well as among normal weight participants during level and gradient walking, and overweight and obese participants during level and gradient walking. We computed the mean prediction difference (MPD) as the difference between predicted vs. measured rates of oxygen consumption (ml/kg/min) for each trial, and examined the relationship between the MPD and measured oxygen consumption (ml/kg/min) using modified Bland-Altman plots. Linear regression was used to determine the intercept (fixed bias) and slope (proportional bias) for each equation. The absolute value of the mean prediction difference, and Root Mean Square Error
iii
(RMSE) values were also calculated for each equation and population. RESULTS: For level walking, all prediction equations had mean prediction differences that were statistically different from zero (P ≤ 0.05) except for the Browning et al., equation when applied to normal weight individuals and the Pandolf equation when applied to overweight and obese individuals. Most importantly, all prediction equations had significant (P ≤ 0.05) fixed and proportional bias, and demonstrated large RMSE (7.8-23.5% of mean measured metabolic rate) that were similar across equations and population. In addition, prediction error increased as measured metabolic rate increased for all equations. CONCLUSION: The metabolic prediction equations evaluated here each had considerable error when compared to measured values, regardless of the population in which the equation was created and/or validated. Improvements in prediction equations may require using approaches that aim to minimize RMSE and/or developing population/intensity specific equations.
iv
ACKNOWLEDGEMENTS
I would like to sincerely thank my friends and family for their continued support
throughout my academic career. I am particularly thankful for my partner, Brett, whose support was essential for my success in Graduate School. I am especially grateful for my mentor, Dr. Ray Browning for his exceptional guidance and belief in my abilities as a student and as a person. I would like to thank my fellow graduate students and members of the Physical Activity Lab for their support and encouragement, as well as all of the professors in the Health and Exercise Science Department.
v TABLE OF CONTENTS ABSTRACT………...ii ACKNOWLEDGMENTS………...ix TABLE OF CONTENTS………...…………..v CHAPTER I……….………1 CHAPTER II………7 CHAPTER III………...22 CHAPTER IV………...26 CHAPTER V……….33 REFERENCES………..42
1 CHAPTER I INTRODUCTION
Rates of obesity and its comorbid conditions have grown at an alarming rate in recent years, and obesity is now considered a leading health concern according to the World Health Organization (WHO)(77). Obesity is defined as having a body mass index (BMI) ≥ 30 kg/m2, and obesity increases the risk of mortality, disability, cardiovascular disease, type 2 diabetes, pulmonary disease, and certain cancers (31, 50). A report from the National Health and Nutrition Examination Survey (NHANES) showed that in 2010 33.0% of US adults were overweight (BMI ≥ 25 kg/m2), 35.7% were obese, and 6.3% were extremely obese (BMI ≥ 40 kg/m2) (22).
Obesity results from a chronic positive energy imbalance, where energy intake (EI) exceeds energy expenditure (EE). Given the health risks associated with obesity, overweight and obese individuals are recommended to lose excess weight through diet and/or exercise. While weight loss is typically achieved through a combination of diet (decreased EI) and physical activity/exercise (increased EE), maintenance of reduced body weight is best achieved by engaging in substantial amounts of physical activity (61, 66, 67). The current recommendation to promote and maintain good health is for adults to engage in 30-60 minutes of moderate-vigorous physical activity (MVPA) on most days of the week, achieving an exercise intensity of 40-60% of maximal oxygen consumption (VO2 max) (29). While the American College of Sports Medicine recommends 150-250 minutes of MVPA each week to maintain good health,
2
Saris et al., found that PA levels of 225-300 minutes each week were necessary to prevent the transition from normal weight to overweight, or from overweight to obesity (58, 66).
Physical inactivity is an independent risk factor for chronic disease regardless of weight status. Individuals who fail to meet the above stated physical activity guidelines are considered inactive according to the World Health Organization (WHO) (77). In fact, in 2010 the WHO reported physical inactivity as a greater risk for mortality than obesity, as physical inactivity was responsible for 6% of global deaths, and is the fourth leading risk factor for mortality worldwide (77). This suggests that regular physical activity is an important component of not only long-term weight management, but is also essential for chronic disease prevention.
Accurate and easy to use equations that predict metabolic rate and energy expenditure are important in exercise settings, where healthcare providers and patients can rely on the these equations to ensure appropriate exercise intensity and sufficient energy expenditure (30). Some professionals will prescribe physical activity in terms of energy expenditure (kcals), as it can be easily calculated from a predicted metabolic rate. Inaccurate estimations of EE, particularly overestimates, may impede weight loss or weight maintenance, particularly when used over time. Patients or clients who are prescribed specific energy expenditure targets (e.g. 1,000 kcals/week) may find themselves in a positive energy balance if their energy expenditure is lower than the predicted value. Schutz et al., provides an example of how a positive energy balance of ~18 kcal/day can lead to five kilograms of weight gain over a five year period assuming that there is no compensation (60). It has been reported that a weekly energy expenditure of 1,000 kcals through leisure time PA is the minimum energy expenditure to modify risk factors for
cardiovascular disease (e.g. blood pressure, hypercholesterolemia) and that even higher levels of EE are necessary to regress coronary lesions and change body composition (19). Given the
3
number of obese and physically inactive persons, there is a clear need for accurate,
independently validated prediction equations for oxygen uptake so that weight loss and weight maintenance can be achieved and risks of chronic disease reduced.
Exercise prescriptions depend on the frequency, intensity, duration, and type of exercise which can be manipulated based on the fitness level of a client, or the clinical condition that a patient presents (11). Intensity and duration interact to determine the energy expenditure of an exercise bout, where exercise physiologists calculate components of intensity (e.g. speed and grade, in the case of walking and running) using metabolic prediction equations. Prediction equations are widely used in many branches of exercise physiology, where exercise sessions are tailored to a desired range of a client or patient’s VO2 max. Despite the importance of accurate prediction equations, there have been limited attempts to develop and independently validate metabolic prediction equations using metabolic data from large, diverse populations.
It is also important to estimate metabolic rate during non-exercise physical activity, as it can be a major determinant of daily energy expenditure. Individuals who are not using structured exercise prescriptions from exercise physiologists, but are interested in determining their daily energy expenditure for weight loss or weight management often rely on commercially available physical activity monitors or pedometers to estimate EE. Many physical activity monitors estimate EE using common prediction equations, which, for many individuals, is the primary method of determining daily EE associated with physical activity.
The ACSM equation is the most commonly used metabolic prediction equation. Exercise performance laboratories and clinical exercise physiology programs create exercise prescriptions using the ACSM equation, where walking speed and grade are prescribed based on a range of VO2 (e.g. The speeds and grades that elicit 50-85% of measured or predicted VO2 max). The
4
ACSM equation was developed with a small sample of elite athletes, which may limit its ability accurately predict walking metabolic rate across a range of ages, adiposities, and aerobic
capacities. Given that the ACSM equation is the most common predictive method for creating exercise prescriptions in clinical and athletic populations, it is surprising that attempts at
independently validating the equation have been limited. Attempts at evaluating the accuracy of the ACSM prediction equation have yielded inconsistent results, with some finding that the equation provides a reasonably good estimation of walking metabolic rate (12, 28, 42), while others have found that the ACSM prediction significantly overestimated VO2 max (54), and underestimates submaximal metabolic rate (8, 76). Given the inconsistencies in the literature regarding the ACSM metabolic rate prediction equation, there is a need for an independent validation of this equation using a large and diverse participant population.
The Pandolf equation is another popular predictive method, often used in the military, as it includes a variable for external load carriage. The ability of prediction equations to accurately estimate walking metabolic rate in a given population may be dependent on the population in which the equation was developed. Given that this equation was developed in a population carrying external load, it is feasible that this predictive method would better estimate walking metabolic rate in overweight and obese individuals. Hall et al., found that the Pandolf equation closely predicted walking metabolic energy expenditure compared to other metabolic equations in a population of young, healthy participants, but there have been no attempts to evaluate the Pandolf equation in overweight or obese participants.
Two new metabolic prediction equations, by Weyand et al., and Browning et al., were developed in diverse populations of varying heights and weights, but neither has been
5
tested on a range of adults and children resulting in a two fold range of statures and a seven fold range in body mass. Compared to the new equation, Weyand found that the ACSM prediction equation significantly underpredicted walking metabolic rate, meaning that subjects were walking with a greater metabolic rate than the equation predicted. Browning et al., used a
hierarchical linear regression in a relatively large sample of normal weight and obese participants across 11 speed grade combinations to determine the variables to include in their predictive model. Treadmill speed, grade, body mass, and age were the primary contributors to the model, accounting for 77% of variance in metabolic rate, compared with 50% in the ACSM equation. To our knowledge, the equation by Browning, et al., used the largest sample of adults to create a metabolic prediction equation, and is the only predictive method that included overweight and obese participants in their development.
Because metabolic prediction equations have been developed using relatively small and mostly homogeneous subject populations, it is not surprising that evaluation of these equations yield inaccurate predictions when compared to measured oxygen uptake. Because of this, there is a need to compare commonly used, and recently created metabolic prediction equations using a large diverse sample, to determine which predication equations most accurately predict walking metabolic rate across the general population. Accurate metabolic rate prediction equations are an essential component in developing safe and effective exercise prescriptions and quantifying daily PA energy expenditure. Because exercise prescriptions are used in both athletic and clinical populations among participants of varying ages and anthropometrics, prediction equations that are developed using large, diverse populations may offer more accurate metabolic predictions than those developed using small, homogenous samples.
6
Statement of Problem
The purpose of this study is to perform an independent validation of a sample of
prediction equations using walking metabolic data from a large number of adults. We compared the predictive ability of the ACSM (68), Pandolf (52), Weyand et al., (76) and Browning et al., (8) equations using a larger and more diverse set of metabolic data than those used for their development.
Hypotheses
We hypothesized the following: 1) The Browning et al., equation would be the most accurate predictor of walking metabolic rate across a range of walking speed/grades, ages and adiposities. The best predictor would have the smallest Root Mean Square Error (RMSE) in estimating walking metabolic rate. 2) The ACSM prediction equation would be least accurate for obese adults.
7 CHAPTER II LITERATURE REVIEW
Physical Activity and the Obesity Pandemic
The rates of chronic disease have risen rapidly in the United States, with diseases related to obesity and lack of physical activity (PA) comprising some of leading causes of death among adults in the United States. Obesity is defined as having a Body Mass Index (BMI) >30 kg/m2, and increases the risk for cardiovascular disease, pulmonary disease, acute coronary events (e.g. heart attack, stroke), type 2 diabetes, and certain cancers (50). In 2010, the National Health and Nutrition Examination Survey (NHANES) reported an obesity prevalence of 35.5% for men and 35.8% for women (55), a striking increase from the 1970’s prevalence of 10.4% among men and 15.1% among women (50). Of the 15 leading causes of death in 2011, six are related to obesity and physical inactivity, including heart disease, the number one cause of adult mortality. Obesity is an independent predictor of Coronary Artery Disease (CAD), coronary death, and congestive heart failure (CHF) independent of age, cholesterol, blood pressure, smoking status, glucose intolerance, and left ventricular hypertrophy (31).
To combat obesity and its comorbidities, weight loss is prescribed through achievement of negative energy balance, in which daily energy expenditure exceeds dietary energy intake. Energy expenditure can be achieved through PA, defined as any bodily movement that results in an energy expenditure, or by exercise, a type of PA that is structured and repetitive with the objective of improving physical fitness (9). While dietary management is essential for acute weight loss, weight management is most successful when individuals engage in substantial
8
amounts of PA combined with reduced energy intake. The National Weight Control Registry (NWCR), one of the largest data sets tracking maintenance of weight loss across a range of demographics showed that 90% of their study population gets an average of one hour of exercise per day, and that the primary mode of activity among exercisers is walking. A recently
published study by the NWCR revealed that physically inactive individuals were more likely to experience weight regain compared to active individuals across the decade long observational study (67). Another NWCR study showed that individuals participating in a consistent exercise routine were 1.97 times more likely to report maintenance of their weight loss for ≥ 1 year (61).
While exercise plays an important role in weight management, physical inactivity is an independent risk factor for chronic disease regardless of weight status. The World Health Organization (WHO) defines physical inactivity as those failing to meet the current recommendations of 150 minutes per week of moderate intensity exercise or 75 minutes
vigorous intensity (77). In 2010, WHO reported that physical inactivity is the fourth leading risk factor for mortality worldwide, stating that inactivity is responsible for 6% of all deaths (77). In 2012, it was reported that physical inactivity was responsible for 6% of the incidence of coronary artery disease (CAD), 7% of Type 2 Diabetes, 10% of breast cancer, and 10% of colon cancer incidence (38). If 25% of inactive persons worldwide met the physical activity guidelines, an estimated 1.3 million deaths due to chronic, non-communicable diseases worldwide could be avoided (38). In an epidemiological study by Lee et al., the highest prevalence of physical inactivity was found among individuals who would eventually suffer from type 2 diabetes, followed by those who would die from all cause mortality, and those who developed colon cancer, coronary heart disease, and breast cancer (38), meaning that the individuals who could benefit the most from increases in physical activity are the ones not getting enough. The health
9
benefits of physical activity include reduced rates of all cause mortality, heart disease, high blood pressure, stroke, metabolic syndrome, type 2 diabetes, breast cancer, colon cancer, depression, and falling, while subsequently increasing cardiorespiratory and muscular fitness, promoting a healthier body mass, improving bone health, functional health, and cognitive function
(38)(77)(72).
Clinical Exercise Physiology and PA
In the clinical environment, structured exercise plays an important role in the recovery from acute conditions like surgery and cardiovascular events, and is an important part in reactive care for cardiovascular and pulmonary disease. A study in 2011 reported that the cost of
cardiovascular disease is expected to triple over the next 20 years, going from $450 billion per year in 2010 to more than $1 trillion a year by 2030, supporting the need for effective, low cost therapies providing primary and secondary prevention of cardiovascular disease and its acute events (19, 73). Exercise based rehabilitation following a cardiac event aims to assist in the physical and psychological recovery of an acute event (1), while reducing the risk of a recurring event, and reducing mortality rates by at least 30% (1). Exercise therapy aims to increase the cardiorespiratory fitness of patients, as those with low maximal aerobic capacities are two to five times more likely to die following a cardiovascular event (20). A retrospective analysis of data from the Cardiac Wellness Institute of Calgary on 5,641 cardiac rehabilitation patients revealed that those at the greatest risk for recurrent event (lowest maximal aerobic capacity) were the most likely to benefit from exercise training (43). Sedentary individuals with a baseline peak metabolic equivalent (MET) value of <5 saw a 30% reduction in mortality per MET increase form baseline compared to the 22% reduction in mortality across the entire cohort for each MET
10
increase in aerobic capacity (43). These results support the importance of physical activity and structured exercise for the secondary prevention of cardiovascular events, especially in
physically inactive populations.
When working with clinical populations, exercise sessions are often tailored to individuals Maximal Oxygen Uptake (measured or predicted) and exercise sessions are customized to the needs and abilities of patients and participants. Here, the calculation of exercise intensities (e.g. treadmill speed and grade) based on metabolic rate is important, as this prescription is used to promote weight loss while keeping the patient/client at a safe intensity. Some professionals will prescribe physical activity in terms of gross weekly energy expenditure (EE), as it can be estimated relatively easily and higher energy expenditures are related to risk factor modification and the prevention of recurring cardiovascular events. In a report published by the Mayo clinic, a weekly energy expenditure of 1,000 kilocalories (kcals) via leisure time PA is necessary to modify risk factors associated with cardiovascular disease and obesity, and
greater levels of EE are related to reducing the progression of coronary disease, regression of coronary lesions, and a decrease in bodyweight/body fat (19). While calculating predicted energy expenditure is an easy to use tool for tracking physical activity and promoting healthy behaviors, inaccurate predictions of EE used over time can impede weight loss efforts and inhibit changes in risk stratification. As an example, if a normal weight female is prescribed a specific energy expenditure to maintain her current weight, and a predicted EE exceeds her physiological value, that individual may experience weight gain over time due to the inaccuracy of her
predicted energy expenditure (28, 30). This emphasizes the importance of accurate,
11
Energetics of Level walking
Walking is the most common form of physical activity, and the energy consumed during walking is a significant portion of daily metabolic energy in humans. Metabolic rate, or oxygen consumption is determined by the rate at which oxygen is transported to the tissues, the oxygen carrying capacity of blood, and the amount of oxygen extracted from the blood (4). Oxygen consumption is quantified through indirect calorimetry (IC) by measuring the amount of oxygen consumption and carbon dioxide production. Energy expenditure is measured in the amount of energy consumed given some amount of time (e.g. kcals/min). The amount of kilocalories expended can be calculated from VO2 in absolute terms (l/min) (68), and is often used by exercise physiologists working with athletes or with special populations.
The energy cost of locomotion is a large component of the total energy budget in humans (46), as walking typically consumes more metabolic energy per day than any other form of physical activity (6). Passmore and Durnin (1955) determined that walking accounted for 20% of weekly energy expenditure in clerk walking nine hours each week, and even greater
proportions of energy expenditure for more physically active individuals (e.g. coal miner) (53). Walking metabolic rate is determined by the velocity of movement and body mass, where as velocity increases, the rate of energy expenditure per kilogram of body mass also increases (34). The amount of energy consumed per distance traveled, or metabolic cost exhibits a U-shaped curve when plotted against walking speed, where metabolic cost is minimized at an individual’s optimal walking speed and above and below this speed we see increases in metabolic cost (8, 80). Metabolic cost is minimized at an individuals preferred stride length, above which
individuals have to take more frequent strides, resulting in greater metabolic energy expenditure (75).
12
Body mass is also a determinant in the energetics of locomotion, as obese individuals expend more absolute energy (kcals) at rest and have a higher metabolic rate than non-obese individuals when performing the same activity (3). Mattson, et al., found that obese women walked more slowly and at a greater percentage of their VO2max (56% VO2max) than non-obese individuals (36% VO2max) and expended more energy due to their excess body mass as well as their very low maximal oxygen consumption (45). An example from Browning and Kram describes a 100 kg obese person requiring more than two times the energy to walk a kilometer than a 50 kg person (6).
In normal weight adults, the speed that minimizes metabolic cost across a given distance of walking is ~1.4 m/s or ~3 mph, requiring approximately 36% of their relative aerobic capacity (8). Obese individuals expend more gross metabolic energy than normal weight individuals given their greater body mass. Obese individuals have a 35-50% higher absolute metabolic rate (VO2 l/min), although a recent study by Browning et al., found that mass specific metabolic rate (VO2 ml/kg/min) in obese individuals was less than or equal to their nonobese counterparts (8). Some studies show that severely obese individuals tend to walk at a slower preferred speed (45, 51, 64) which requires a greater percentage of aerobic capacity per kilogram of body mass, given their lower aerobic capacity, than their non-obese counterparts (45). The increased energetic cost of walking in obese individuals may be due to increased body mass, heavier limbs, decreased stability, wider stance, and wider lateral leg swing; while recent results suggest that body mass, along with walking speed and grade may be the primary predictors of net metabolic rate (8). Given the number of variables that can increase the cost associated with locomotion, and the only moderate increase in energy consumption, obese individuals may learn to walk in a way that reduces the mechanical work required to move the center of mass (6, 49).
13
Mechanics of Level Walking
From a mechanical perspective, the determinants of the metabolic cost associated with locomotion include the work done on the Center of Mass (COM), the cost of swinging the limbs, supporting body weight, and maintaining balance (70, 78). The work required to change the energy of the COM is considered external work (Wext), while internal work (Wint) is the change in energy of segments related to the COM. The sum of these values reveals total mechanical work (Wtot= Wext + Wint) (10, 78).
Work Done on the Center of Mass
An inverted pendulum motion has been used to describe human walking, where the body’s COM is raised and lowered cyclically throughout the gait cycle. On level ground when walking at a constant velocity, the COM has no change in energy, meaning that the amount of positive work is both equal and opposite to the amount of negative work. However, as the arc of the COM during single limb stance is redirected upward when the contralateral limb contacts the ground, work is needed to change the velocity of the COM (15). During the first half of stance, kinetic energy decreases and is converted into gravitational potential energy, with the opposite occurring in second half of stance (25). Because fluctuations in kinetic and potential energy are out of phase, the net change in energy (and thus mechanical work done) is relatively small and thus walking is metabolically economical (23, 25). The most economical walking speed occurs at the speed where exchanges in kinetic and potential energy are greatest. At this speed there is also an optimal stride rate in which total mechanical power is minimized (57). This walking speed and step rate results in the smallest metabolic cost, and as typically occurs at an individual’s preferred walking speed (57).
14
Cost of Swinging the Limbs
Internal work is calculated by the sum of the absolute changes in the kinetic and potential energy of body segments relative to the COM. Internal work is a linear function of speed and stride frequency, where increases in the speed of walking result in a greater stride frequency, and thus a greater amount of work needed to accelerate the limbs (48).
The metabolic cost of level walking vs. stride frequency exhibits a U-shaped curve, with the lowest cost per distance occurring at preferred stride rate (69). This economical movement pattern is maximized, as individuals tend to choose walking speeds and stride rates that minimize energy required to travel a given distance (80). Because individuals can walk at different step lengths and rates at the same speed, velocity alone is not the only indicator of metabolic cost (79). Walking at the same speed with a forced step rate results in an increased energy expenditure (79) when compared to walking at a freely chosen step rate.
While the inverted pendulum model describes the swing phase in human walking as being passive as it acts under the influence of gravity, studies that attach external mass to the lower extremity, near the COM, isolate leg swinging, or provide leg swing assistance suggest that leg swing may represent 25-33% of the net cost of walking (7, 14, 24, 27, 63). Umberger, et al., found that swinging the limbs accounted for 29% of total metabolic cost during preferred stride rates, with much of that cost coming from the active flexor muscles (e.g. iliacus, psoas, biceps femoris brevis, and dorsiflexors) in the first half of swing to propel the swing limb forward, followed by the active knee and hip extensors in the second half of stance to stop the swing limb (69).
15
Supporting Body Mass
When metabolic rate is expressed in relative terms (per kilogram of body mass) metabolic differences between obese and normal weight individuals are greatly reduced, indicating that total body weight is a determinant of the cost of walking. Net metabolic rate (gross-standing) is positively related to percent body fat, where increases in body fat result in as much as 50% higher gross metabolic rates than normal weight (3, 5, 17, 21). While the inverted pendulum model results in little mechanical work performed during the single stance phase of human locomotion, muscular forces must be generated to support the weight of the body as lower extremity joints are flexed during stance (26). These muscle forces incurs a significant metabolic cost, ~28% of the net metabolic cost of normal walking (26).
At preferred stride rate, 20% below, and 20% above preferred stride rate, single leg support represented the greatest proportion of metabolic cost, followed by double limb support during fast stride rates, and swing phase during the slowest stride rate. The costs of double support (27%) and swing (29%) are not significantly different when walking at preferred stride rate (70).
Maintaining Balance
Obese individuals tend to walk with a shorter stride length, and greater step width, a strategy that may be necessary in maintaining balance (64). These gait characteristics result in a greater stance time and time in double support, a strategy thought to promote balance and minimize metabolic energy, as stance requires less muscular energy than swing (39). Spyropoulous et al., found that obese individuals walk with a two-fold larger step width than normal weight, which presumably increases the metabolic cost of walking in these individuals
16
(5, 64). The slower walking speeds and shorter stride lengths associated with obese locomotion may also be a factor in balance, and may result in increased metabolic cost (56).
Energetics of Gradient Walking
Margaria first studied the energetics of uphill walking in 1938, and many studies since have investigated the metabolic and mechanical changes associated with gradient walking in normal weight individuals. Margaria found that metabolic cost is minimized at an optimum gradient of -10% (negative referring to downhill slopes) with metabolic cost increasing linearly with increasing slope (25, 41, 48). The effects of obesity on the energetics of gradient walking are less understood. In 2008, Lafortuna reported a 6-13% greater relative energy consumption in obese individuals walking up moderate inclines (37). The net metabolic energy (kcal) used by obese participants was 2.2-2.3 times greater than in normal weight participants walking at the same speed and grade (37). Variance in body mass explained 82-92% of variance in metabolic energy among these subjects, indicating that body mass is a significant predictor of metabolic energy used in gradient walking (37). Among class III obesity (BMI >40 kg/m2) Freyschuss and Melcher found a 33% greater mass specific VO2 compared to normal weight adults walking at 1.0 m/s across inclines of 1-7% (21). Despite these findings, others have found that mass specific net metabolic rate (gross–standing) in obese individuals is equal to, or less than that of normal weight individuals (8), suggesting a need for additional studies using large sample sizes, a control group, and standardized protocols to further investigate the mass specific metabolic rate in obese vs. non obese individuals at a variety of speeds and grades (8).
17
Mechanics of Gradient Walking
While much research has been devoted to how animals move across level ground, relatively little is known regarding the energetics and mechanics of gradient walking. As stated above, during level walking humans walk using an inverted pendulum or a rolling egg
mechanism, but an egg does not roll uphill. In gradient walking, fluctuations in potential energy are asymmetrical, while fluctuations in kinetic energy remain similar to level walking (25). Potential energy increases during uphill walking as negative work decreases, and positive work increases with increasing incline (40). The opposite occurs in downhill walking, where positive work decreases as the energy needed to progress must overcome the forces of gravity and more negative work is performed by muscles (40). As the transient exchange of kinetic and potential energy diminishes in gradient walking, there is a concomitant increase in mechanical work, and metabolic energy (25). During hill walking, positive internal work is counterbalanced by an equal amount of negative internal work, making Wint an irrelevant component of the mechanical determinants of gradient walking (48).
Prediction Equations
Designing physical activity interventions for chronic disease and weight management often requires accurate determination of metabolic rate or of energy expenditure. While IC is the gold standard for determining both oxygen uptake, the use of IC is expensive and impractical across all types of interventions (28, 30, 33). Because of its impracticality, prediction equations have been developed to quickly and easily estimate metabolic rate, and are often used to tailor exercise prescriptions to the specific needs of individual clients/patients. Prediction equations are practical and widely used in wellness programming and clinical exercise physiology,
18
although many prediction equations inaccurately predict metabolic rate and energy expenditure. The most common prediction equations used include the ACSM equation, and Pandolf
prediction equations.
ACSM Equation
The ACSM equation is the most commonly used prediction equation for estimating metabolic rate during walking, and is used in most cardiovascular centers and sports medicine laboratories (33). Most commercially available exercise treadmills, physical activity monitors, and pedometers calculate METS from the ACSM equation, which is often used to estimate daily energy expenditure. The 1965 article by Dill is credited for the creation of the ACSM equation (13). In this study, Dill determined the VO2 max of himself and two elite subjects (VO2max of 46, 76, and 63, respectively) and then calculated their oxygen consumption in terms of body weight (kg) and velocity (m/min) (13). Dill calculated the net oxygen cost of vertical movement by subtracting net oxygen consumption for horizontal movement from total oxygen
consumption, and calculated the rate of vertical movements (m/min) from the product of the horizontal speed by grade to the negative second power (13). The oxygen cost for the vertical movement was then determined by dividing the vertical oxygen cost by the rate of the climb. Despite analyzing three subjects, Dill used the average vertical cost for a single, elite subject (VO2max 76) to estimate vertical cost in other elite athletes (13). Interestingly, the author
specifically states that his method of prediction would not be suitable for the normal population, as it was created using data from only one, elite subject (13). Many scientists have compared the accuracy of the ACSM prediction equation to measured values, and find it imprecise, especially when used in populations other than that in which it was developed. Weyand et al., found that
19
ACSM significantly underpredicted metabolic energy (76), while Browning et al., found that ACSM only accounted for 50% of the variance in measured V02/kg (8).
ACSM Walking Metabolic Prediction Equation: VO2 (ml/kg/min) = 0.1(S) + 1.8(S)(G%) + 3.5
S=Speed in m∙min-1, G%=Percent grade as decimal
Pandolf Equation
The Pandolf equation was created in 1977 in a small cohort of young normal weight men (52). Six fit male subjects walked for 15 minutes for 15 speed and load combinations. Walking conditions included an external load of 32, 40, and 50 kilograms for speeds of 0.2, 0.4, 0.6, 0.8, and 1.0 m/s (52). A prediction equation was created by adding the metabolic cost of standing without load, to the metabolic cost of standing with load, to the metabolic cost of walking on level ground, to the metabolic cost of climbing a grade as related to the type of terrain (52).
Pandolf Walking Metabolic Prediction Equation:
VO2 (Watts) = 1.5M+2.0(M+L)(L/M)2 + n(M+L) [1.5V2+0.35VG%]
G%=Percent grade as decimal, V=Velocity in m/s, M=Mass in kg, L= External load
Weyand Equation
The recently developed equation from Weyand, et al., uses a height-weight-speed model for predicting oxygen uptake. Including children in the data set resulted in a two-fold range in statures and the seven-fold range in body mass across all subjects. Despite this, only four of the 78 subjects were obese. This model partitioned gross walking speed into three components:
20
resting metabolism, predicted using the gender, age, and body mass based resting metabolic rate (RMR) estimates from Schofield et al., minimum walking metabolism, and speed dependent walking metabolism (32). This three-component model adds VO2 Rest, or RMR, to the bodies’ minimum walking metabolic rate, or the oxygen uptake required to support the body and
maintain posture, to the speed dependent walking metabolic rate. The authors defined this value as an exponential function of velocity, and an inverse function of height given that the speed induced increase in walking metabolic rate is greater in shorter vs. taller individuals. Weyand et al., also explains that the total weight supported against gravity (e.g. body weight) has the greatest influence of the three basic predictors to create a metabolic prediction equation. This is the only equation analyzed here that did not include a vertical component for gradient walking.
Weyand Walking Metabolic Prediction Equation:
VO2 (ml/kg/min) = 2*VO2REST+5.6*V2*Ht-1
V=Velocity in m/s, Ht=Height in m
Browning Equation
The equation by Browning, et al., was recently created using 32 obese and 19 non obese participants walking at 11 speed/grade combinations (8). Speeds ranged from 0.50-1.75 m/s, and grades were -3, 0, 3, 6, and 9 degrees (8). To our knowledge this is the largest and most diverse adult population used to create a metabolic prediction equation. To develop a prediction equation for mass specific walking metabolic rate, a hierarchical linear regression of treadmill,
anthropometric, and biomechanical variables were computed. The variables included in the prediction equation were, treadmill speed, treadmill grade, subject body mass, and subject age. This is the only predictive method analyzed that includes an age component, which was included because it was a significant predictor in the hierarchal linear regression model (44). Browning et
21
al., found that treadmill speed and grade were the primary contributors to the prediction model (R2=0.69), and that body mass and age were also significant predictors of oxygen uptake (8).
Browning Walking Metabolic Prediction Equation:
VO2 (ml/kg/min)= (1.40 + 0.42(G) + 3.68(V)-0.01(M)-0.03(A))*3
22 CHAPTER III
METHODS AND PROCEDURES
Participants
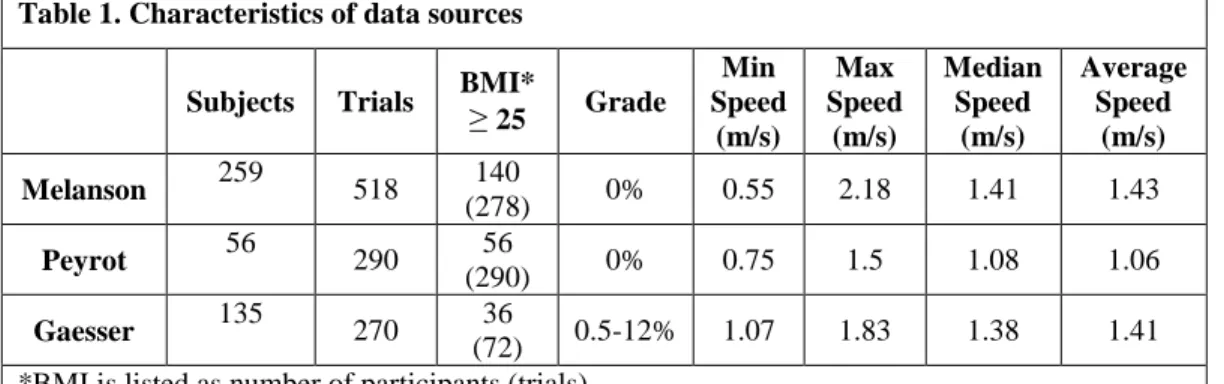
Four hundred and fifty (N = 450) individuals (286 females) were included in this validation and were 18-85 years old (Ave=38 years), with BMI’s ranging from 16.5-44 kg/m2 (Ave=26.6 kg/m2)(Table 1). Participant demographic, anthropometric, walking speed, grade, and oxygen consumption data from laboratories at the University of Colorado Anschutz Medical Campus (Dr. Melanson), University of La Réunion (Dr. Peyrot) and Arizona State University (Dr. Gaesser) were used in this study.
Protocols
In each study, steady state oxygen consumption and carbon dioxide production were recorded through indirect calorimetry at a range of walking speeds and grades.Walking speeds ranged from 0.5-2.0 m/s and percent grade ranged from 0.5-14 (Table 1). Data from Melanson et al., were obtained from 259 subjects of varying ages, and BMI’s, where each subject walked on a treadmill for ten minutes at a self-selected “normal” and self-selected “brisk” walking speeds, while oxygen consumption was measured via indirect calorimetry (Parvomedics) (47).
Table 1. Characteristics of data sources
Subjects Trials BMI*≥
25 Grade Min Speed (m/s) Max Speed (m/s) Median Speed (m/s) Average Speed (m/s) Melanson 259 518 140 (278) 0% 0.55 2.18 1.41 1.43 Peyrot 56 290 56 (290) 0% 0.75 1.5 1.08 1.06 Gaesser 135 270 36 (72) 0.5-12% 1.07 1.83 1.38 1.41 *BMI is listed as number of participants (trials)
23
Data from University of La Réunion (unpublished) in a sample of 56 obese adults
included five-minute level walking trials at five incremental speeds. Walking speeds included 0.75 m/s, 1.00 m/s, 1.25 m/s, 1.5 m/s, and preferred speed. The rates of oxygen consumption
(VO2, in ml.min-1) and carbon dioxide production (VCO2, in ml.min-1) were measured using a
breath-by-breath gas exchange analyzer (Ergostik, Geratherm Medical AG, Geschwenda, Germany). For all five-min trials, three minutes were allowed for the subjects to reach steady
state (no significant increase in VO2 during final two minutes and respiratory exchange ratio
<1.0) and calculated the average VO2 (milliliters of O2 per second) and VCO2 (milliliters of CO2
per second) for the final two minutes of each trial. During each test ventilation and gas exchange
were measured breath-by-breath with the Oxycon Mobile (Carefusion) for determination of VO2,
VCO2 and RER.
Gaesser et al., (unpublished) provided data on 135 women at Arizona State University
during two 20-min level and gradient treadmill walking trials. VO2 data represents the mean
oxygen consumption for the last 10 min of the 20-min walks on a motor-driven treadmill (Trackmaster) measured breath by breath with the Oxycon Mobile Indirect Calorimeter (Carefusion). The trials took place on the same day, in a climate-controlled lab, with the level walk occurring first, and the incline walk approximately 30 minutes later. For each trial the speed was exactly the same, at ~10% below preferred walking speed. For the incline walk, the grade was adjusted to elicit ~60-70% estimated maximal heart rate.
Prediction Equations
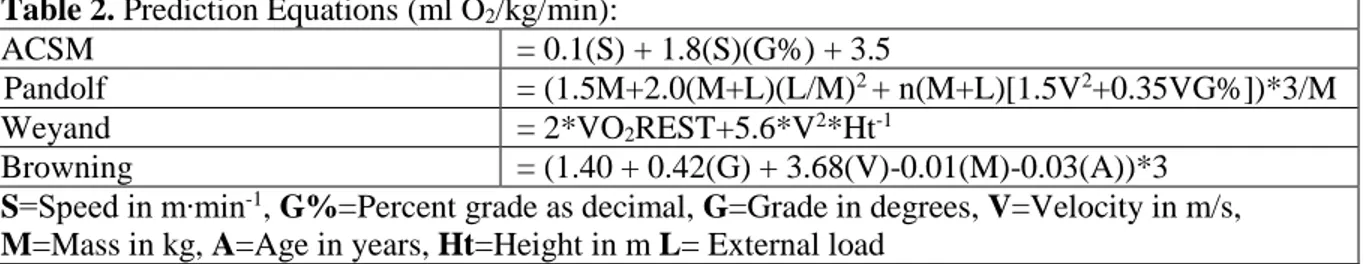
We used the ACSM, Pandolf, Weyand, and Browning equations (Table 2) to predict oxygen consumption in 1,078 walking trials of varying speed and grade (8, 13, 52, 68, 76).
24
The ACSM, Pandolf and Browning equations can be used to predict oxygen consumption during uphill walking but the equation developed by Weyand does not include a gradient
variable. To predict oxygen consumption during gradient walking using the Weyand equation, we included a vertical component by assuming that the efficiency of vertical work is 35% (62). Mechanical power was estimated as the work done to increase gravitational potential energy (W), and was converted to metabolic rate using a conversion of 20.1 Joules per milliliter of oxygen. Thus, the vertical metabolic work was estimated using equation 1 and was added to the estimated oxygen consumption predicted by the Weyand equation.
VO2 (ml/kg/min) = ([mass (kg)*gravitational acceleration (m/s2)*velocity (m/s)*sin G]/0.35)/20.1*60/mass (kg) [1]
Data Analysis
We quantified the difference between measured and predicted oxygen consumption for each walking trial and calculated a mean prediction difference (MPD) for all trials. Mean prediction differences were also calculated separately for level and uphill treadmill walking in normal weight and overweight/obese participants. To account for both positive and negative differences, we also calculated absolute mean prediction difference (|MPD|), as the absolute value of the predicted VO2 minus the measured VO2. Root mean square errors (RMSE) were also calculated to determine the error associated with each prediction equation. RMSE % Error was
Table 2. Prediction Equations (ml O2/kg/min):
ACSM = 0.1(S) + 1.8(S)(G%) + 3.5
Pandolf = (1.5M+2.0(M+L)(L/M)2 + n(M+L)[1.5V2+0.35VG%])*3/M
Weyand = 2*VO2REST+5.6*V2*Ht-1
Browning = (1.40 + 0.42(G) + 3.68(V)-0.01(M)-0.03(A))*3
S=Speed in m∙min-1, G%=Percent grade as decimal, G=Grade in degrees, V=Velocity in m/s,
25
also calculated as the RMSE for a given equation divided by the mean measured VO2 for all trials (13.09 ml/kg/min), expressed as a percentage.
We plotted the prediction error vs. the measured oxygen consumption (modified Bland-Altman) for all trials as well as for only overweight/obese or non-obese participants and level and uphill walking. We used linear regression to determine fixed (y-intercept) and proportional bias (slope) for each modified Bland-Altman plot as well as R2 values. Bland Altman plots provide an indication of predictive values that over or underestimate when compared to measured, with differences below zero indicating an under prediction of oxygen consumption. Data analysis was done using Sigma Plot software (Systat Software, San Jose, CA). P<0.05 defined statistical significance.
26 CHAPTER IV
RESULTS
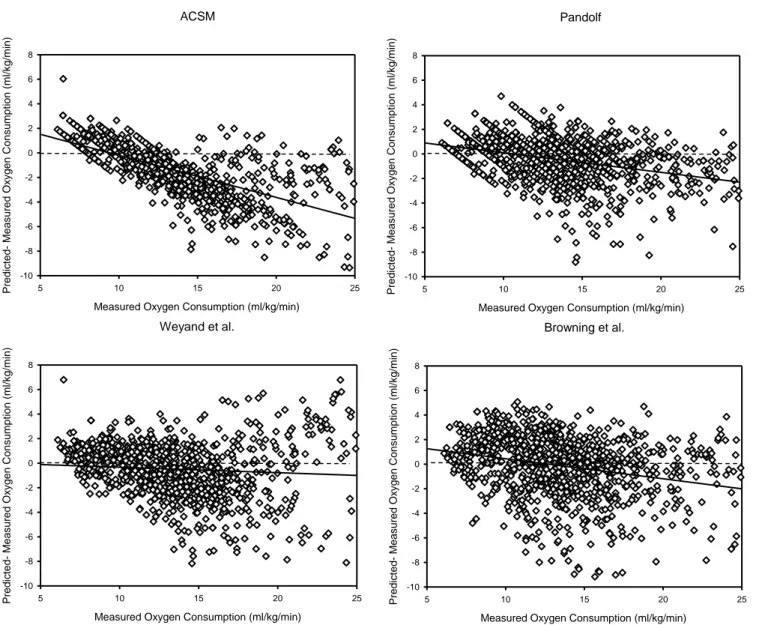
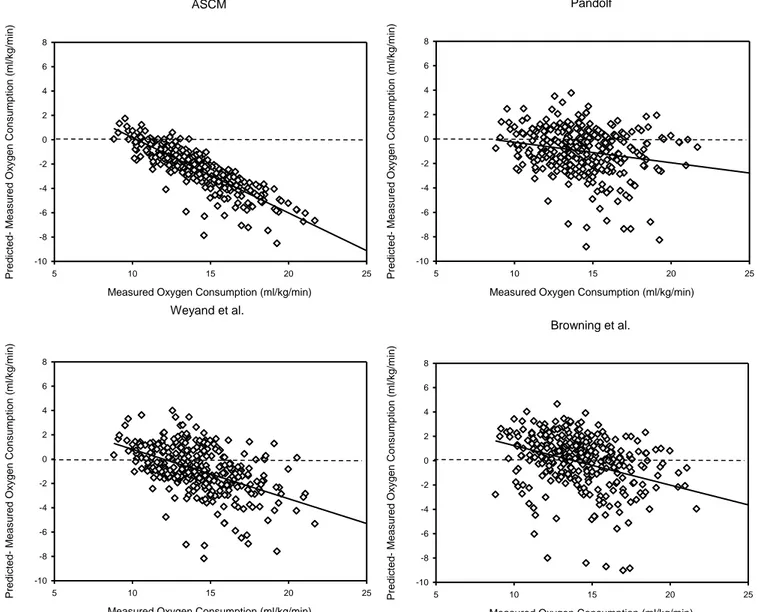
Mean prediction errors and confidence intervals, root mean square errors, fixed bias, proportional bias, and R2 for each equation are listed in Table 4-6. Figures 1-5 illustrate the predictive ability of each equation using modified Bland Altman plots for all participants (Figure 1), as well as for normal weight and overweight/obese participants (Figures 2-5). For Level Walking, all MPD were statistically different from zero (P ≤ 0.05) except for the Browning et al., equation for normal weight individuals and the Pandolf equation for overweight and obese individuals (Table 5). In addition, all prediction equations demonstrated significant (P ≤ 0.05) fixed and proportional bias (Table 4-6). All prediction equations demonstrated large absolute MPE and RMSE that were generally similar across predictive models. All prediction equations had greater errors as measured walking metabolic rate values increased.
Table 4. Prediction accuracy of metabolic rate predictions during walking using data from all trials (all participants and walking speed/grades).
(Trials = 1,078)
Mean VO2= 13.09 ml/kg/min
Mean Prediction Difference (MPD)
|MPD| RMSE RMSE % Y-Intercept Slope R2
ACSM -1.46* (0.11) 2.06 2.63 20.1% 3.23* -0.34* 0.46 Pandolf -0.50* (0.16) 1.44 1.93 14.7% 1.69* -0.16* 0.14 Weyand -0.50* (0.14) 1.84 2.37 18.1% 0.11* -0.04* 0.01 Browning -0.16* (0.16) 1.96 2.58 19.7% 2.07* -0.16* 0.08 MPD are shown as mean (confidence interval)
27 Table 5.
Prediction accuracy of metabolic rate predictions during walking using data from level walking trials.
Normal Weight Participants (Trials = 333) Mean VO2 = 14.29 ml/kg/min
Overweight and Obese Participants (Trials = 604) Mean VO2 = 11.81 ml/kg/min Mean Prediction Error |MPE| RMSE % RMSE Y-Intercept Slope R2 Mean Prediction Error |MPE| RMSE % RMSE Y-Intercept Slope R2 ACSM -2.48* (0.21) 1.37 3.12 21.8% 6.38 -0.62 0.76 ACSM -0.86* (0.18) 1.74 2.37 20.1% 6.03 -0.58 0.82 Pandolf -0.98* (0.21) 1.58 2.14 14.9% 1.41 -0.17 0.06 Pandolf -0.06 (0.14) 1.35 1.82 15.4% 2.16 -0.19 0.13 Weyand -0.94* (0.22) 1.68 2.23 15.6% 4.88 -0.41 0.29 Weyand -0.82* (0.17) 1.72 2.29 19.4% 4.29 -0.43 0.48 Browning -0.15 (0.27) 1.74 2.50 17.5% 4.49 -0.32 0.12 Browning -0.31* (0.22) 2.18 2.78 23.5% 4.76 -0.43 0.29 Table 6.
Prediction accuracy of metabolic rate predictions during walking using data from gradient walking trials.
Normal Weight Participants (Trials = 97) Mean VO2 = 22.30 ml/kg/min
Overweight and Obese Participants (Trials = 36) Mean VO2 = 18.34 ml/kg/min Mean Prediction Error |MPE| RMSE % RMSE Y-Intercept Slope R2 Mean Prediction Error |MPE| RMSE % RMSE Y-Intercept Slope R2 ACSM -1.92* (0.23) 2.32 2.52 11.3% 0.43 -0.11 0.05 ACSM -1.67* (0.29) 1.50 1.95 20.7% 0.79 -0.09 0.03 Pandolf -1.50* (0.31) 1.93 2.15 9.7% -0.81 -0.11 0.06 Pandolf -0.65* (0.49) 1.19 1.56 8.5% -0.26 -0.02 0.01 Weyand 2.24* (0.30) 2.77 3.09 13.8% -3.04 0.24 0.16 Weyand 2.06* (0.38) 2.25 2.82 15.4% -3.75 0.29 0.14 Browning 0.45* (0.24) 1.45 1.73 7.8% 4.39 -0.18 0.15 Browning 0.49* (0.29) 1.34 1.70 9.3% 2.63 -0.11 0.04
* P ≤ 0.05 are significantly different than zero
28 ACSM
Measured Oxygen Consumption (ml/kg/min)
5 10 15 20 25 Pr edic ted- M eas ur ed Ox y g en Cons umpt ion (ml/k g /m in) -10 -8 -6 -4 -2 0 2 4 6 8 Pandolf
Measured Oxygen Consumption (ml/kg/min)
5 10 15 20 25 Pr edic ted- M eas ur ed Ox y g en Cons umpt ion (ml/k g /m in) -10 -8 -6 -4 -2 0 2 4 6 8 Weyand et al.
Measured Oxygen Consumption (ml/kg/min)
5 10 15 20 25 Pr edic ted- M eas ur ed Ox y g en Cons umpt ion (ml/k g /m in) -10 -8 -6 -4 -2 0 2 4 6 8 Browning et al.
Measured Oxygen Consumption (ml/kg/min)
5 10 15 20 25 Pr edic ted- M eas ur ed Ox y g en Cons umpt ion (ml/k g /m in) -10 -8 -6 -4 -2 0 2 4 6 8
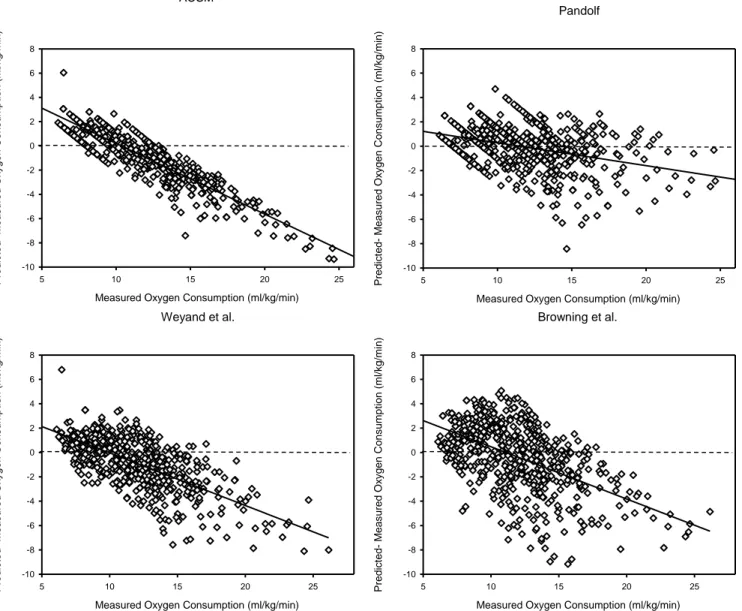
Figure 1. Comparison of mean prediction difference and measured oxygen consumption across all subjects and all walking conditions for the ACSM, Pandolf, Weyand, and Browning Prediction equation using the modified Bland Altman Technique. Open diamonds represent a single walking trial, and the solid line is the linear regression for each equation.
29 ASCM
Measured Oxygen Consumption (ml/kg/min)
5 10 15 20 25 Predic ted- M easur ed Ox y g en C onsum pt ion (m l/ k g /m in) -10 -8 -6 -4 -2 0 2 4 6 8 Pandolf
Measured Oxygen Consumption (ml/kg/min)
5 10 15 20 25 Predic ted- M easur ed Ox y g en C onsum pt ion (m l/ k g /m in) -10 -8 -6 -4 -2 0 2 4 6 8 Weyand et al.
Measured Oxygen Consumption (ml/kg/min)
5 10 15 20 25 P red icte d- M ea sur ed Ox y g en Consum pt ion ( m l/ kg /m in) -10 -8 -6 -4 -2 0 2 4 6 8 Browning et al.
Measured Oxygen Consumption (ml/kg/min)
5 10 15 20 25 Predic ted- M easur ed Ox y g en C onsum pt ion (m l/ k g /m in) -10 -8 -6 -4 -2 0 2 4 6 8
Figure 2. Comparison of mean prediction difference and measured oxygen consumption for normal weight participants walking at 0% grade for the ACSM, Pandolf, Weyand, and Browning Prediction equation using the modified Bland Altman Technique. Open diamonds represent a single walking trial, and the solid line is the linear regression for each equation.
30 ACSM
Measured Oxygen Consumption (ml/kg/min)
5 10 15 20 25 P red icte d- M ea sur ed Ox y g en Consum pt ion ( m l/ kg /m in) -10 -8 -6 -4 -2 0 2 4 6 8 Pandolf
Measured Oxygen Consumption (ml/kg/min)
5 10 15 20 25 Predic ted- M easur ed Ox y g en C onsum pt ion (m l/ k g /m in) -10 -8 -6 -4 -2 0 2 4 6 8 Weyand et al.
Measured Oxygen Consumption (ml/kg/min)
5 10 15 20 25 Predic ted- M easur ed Ox y g en C onsum pt ion (m l/ k g /m in) -10 -8 -6 -4 -2 0 2 4 6 8 Browning et al.
Measured Oxygen Consumption (ml/kg/min)
5 10 15 20 25 Predic ted- M easur ed Ox y g en C onsum pt ion (m l/ k g /m in) -10 -8 -6 -4 -2 0 2 4 6 8
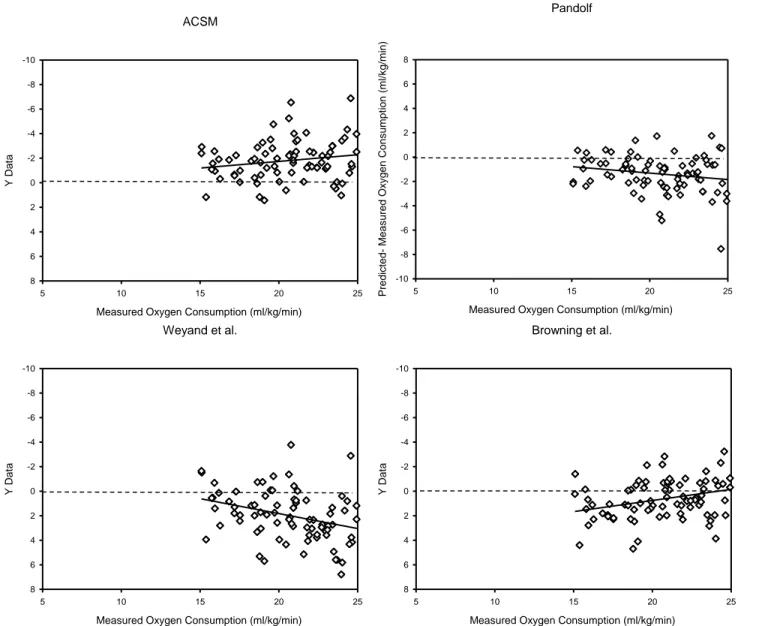
Figure 3. Comparison of mean prediction difference and measured oxygen consumption for overweight and obese participants walking at 0% grade for the ACSM, Pandolf, Weyand, and Browning Prediction equation using the modified Bland Altman Technique. Open diamonds represent a single walking trial, and the solid line is the linear regression for each equation.
31 ACSM
Measured Oxygen Consumption (ml/kg/min)
5 10 15 20 25 Y D at a -10 -8 -6 -4 -2 0 2 4 6 8 Pandolf
Measured Oxygen Consumption (ml/kg/min)
5 10 15 20 25 P red icte d- M ea sur ed Ox y g en Consum pt ion ( m l/ kg /m in) -10 -8 -6 -4 -2 0 2 4 6 8 Weyand et al.
Measured Oxygen Consumption (ml/kg/min)
5 10 15 20 25 Y D at a -10 -8 -6 -4 -2 0 2 4 6 8 Browning et al.
Measured Oxygen Consumption (ml/kg/min)
5 10 15 20 25 Y D at a -10 -8 -6 -4 -2 0 2 4 6 8
Figure 4. Comparison of mean prediction difference and measured oxygen consumption for normal weight participants walking at uphill for the ACSM, Pandolf, Weyand, and Browning Prediction equation using the modified Bland Altman Technique. Open diamonds represent a single walking trial, and the solid line is the linear regression for each equation.
32 ACSM
Measured Oxygen Consumption (ml/kg/min)
5 10 15 20 25 P red icte d- M ea sur ed Ox y g en Consum pt ion ( m l/ kg /m in) -10 -8 -6 -4 -2 0 2 4 6 8 Pandolf
Measured Oxygen Consumption (ml/kg/min)
5 10 15 20 25 Predic ted- M easur ed Ox y g en C onsum pt ion (m l/ k g /m in) -10 -8 -6 -4 -2 0 2 4 6 8 Weyand et al.
Measured Oxygen Consumption (ml/kg/min)
5 10 15 20 25 P red icte d- M ea sur ed Ox y g en Consum pt ion ( m l/ kg /m in) -10 -8 -6 -4 -2 0 2 4 6 8 Browning et al.
Measured Oxygen Consumption (ml/kg/min)
5 10 15 20 25 P red icte d- M ea sur ed Ox y g en Consum pt ion ( m l/ kg /m in) -10 -8 -6 -4 -2 0 2 4 6 8
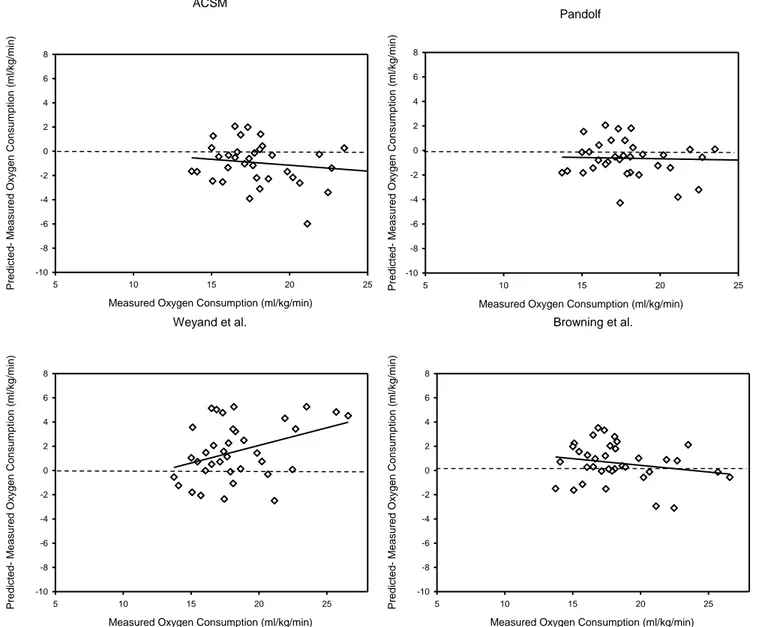
Figure 5. Comparison of mean prediction difference and measured oxygen consumption for overweight and obese participants walking uphill for the ACSM, Pandolf, Weyand, and Browning Prediction equation using the modified Bland Altman Technique. Open diamonds represent a single walking trial, and the solid line is the linear regression for each equation.
33 CHAPTER V DISCUSSION
The prediction equations evaluated in this study have mean prediction errors that are, with only two exceptions, significantly different than zero. In addition, all root mean square errors were relatively large, and homogeneous regardless of the model. Based on our results, we reject our hypothesis that the Browning et al., equation would best predict oxygen uptake in a large, diverse sample. Our results suggests that there are other variables/models not accounted for in common equations that may better predict oxygen consumption, or that the variability between subjects cannot be accounted for using a population based metabolic prediction equation. We also reject our hypothesis that the ACSM equation would be least accurate for obese adults. All metabolic equations predicted oxygen uptake with a RMSE of 7.8-23.5%, which is surprising given the vast differences in the populations in which each equation was created and validated. This suggests that the predictive ability of these metabolic equations are insensitive to the population in which they were created, and that individual variability makes it difficult to accurately predict walking metabolic rate, particularly at faster walking speeds.
The ACSM equation is the metabolic prediction equation most often used by exercise specialists, although the origin of the equation is difficult to determine. To our knowledge, the ACSM equation was developed by Dill in 1965 using a single, elite athlete (13). Many have described the ACSM prediction equation as being inaccurate, raising concern about its accuracy given its extensive use by exercise physiologists (28). Browning et al., found that the ACSM equation only accounted for 50% of the variance in mass-specific oxygen consumption in their data set, where the Browning equation accounted for 77% of the variance in mass specific
34
walking metabolic rate (8). Weyand et al., found that the ACSM walking equation
underpredicted the metabolic rate of shorter subjects, resulting in predictive errors twice as large as those of their equation (76). Others have compared the predictive ability of the ACSM
equation in a population of athletes and found that it predicts metabolic rate better than others (e.g. Pandolf), which is not surprising given that the equation was being implemented in a similar population to that in which it was created (28, 34). When the ACSM equation is extrapolated to this data set, RMSE was 20.1% of measured metabolic rate, and the RMSE was consistent with the other predictive equations (30, 76). Despite the similarities in RMSE, the ACSM equation had the highest R2 value in level walking, indicating that the predicted values were more
clustered along the regression line. Despite the high R2 values, the ACSM equation also has the highest proportional bias (slope), meaning that the ACSM equation most poorly predicts oxygen consumption when measured oxygen consumption is large (e.g. at faster walking speeds). As walking metabolic rate increases, predicted oxygen consumption decreases, meaning that the predicted energy expenditure is smaller than actual energy expenditure. This means that individuals seeking weight loss will have physiologically greater energy expenditure than what they had predicted, which may unintentionally place them at an even greater negative energy balance, thus promoting weight loss. Given the high R2, and similar RMSE, it is possible that a correction factor can be applied to the ACSM metabolic prediction equation to correct for the proportional bias, resulting in a more accurate predictive method. Future studies should attempt to find a correction factor for the ACSM equation that would correct the errors in proportional bias, creating a smaller slope and reducing RMSE values.
The Pandolf equation was the best predictor of metabolic rate in obese individuals during level walking based on its low mean prediction error, yet the RMSE was similar to the other
35
prediction equations. Because the Pandolf equation was created using external load carriage, this suggests that walking with external load may by similar to walking with excess adiposity, as is the case with obese individuals. Others have found that load carriage results in decreased step length and increased step width, characteristics also associated with obese individuals walking (36). It is possible that the inclusion of external load carriage in the development of the Pandolf metabolic prediction equation better allows for the prediction of walking metabolic rate in obese individuals. Despite being a good predictor of metabolic rate of obese individuals during level walking, the Pandolf equation significantly underestimated oxygen uptake during in obese participants walking uphill, suggesting that an equation developed using load carriage did not wholly account for metabolic differences in obese locomotion.
The recently developed equation by Weyand, et al., utilized a height-weight-speed model for predicting oxygen uptake using a group of children and adults to maximize differences in height and weight. Despite the two-fold range in statures and the seven-fold range in body mass, only four of the 78 subjects used to develop their equation were obese. The wide range in
heights and weights primarily came from the inclusion of children in their subject population. To our knowledge, children have not been included in the creation or validation of any other metabolic prediction equation. Because of the vast differences in leg length, the Weyand equation claims that height is a crucial part of any metabolic prediction equation. Of the
equations tested here, the equation by Weyand et al., is the only predictive method that includes height as an independent variable. The authors incorporated height because the speed induced increase in walking metabolic rate is dependent on stature, where an individual with shorter leg length would walk with shorter steps than a taller person at a given speed, resulting in a higher energy expenditure (75, 76). Despite being the only method to include stature as a predictive
36
variable, the RMSE associated with the Weyand equation suggests that it is not representative of a one size fit all equation for predicting oxygen uptake during walking. In a population of adults where there is not as large of a difference in statures, height is likely not a significant predictor of walking metabolic rate. No other prediction equation included height as a variable, and the amount of prediction error was similar across equations. Furthermore, when Browning et al., utilized a stepwise linear regression to determine which variables were predictive of walking metabolic rate, height was not a significant predictor in the model.
The Weyand et al., equation did not initially include a gradient component, which significantly limits its ability to be used in field or clinical settings. To compare the Weyand et al., equation with others during uphill walking, we added a gradient component to the predictive model. We computed the cost of vertical metabolic work given that mechanical work is the work done to increase gravitation potential energy, converting this value from watts to ml/kg/min and adding it to the existing height, weight, speed model. The Weyand equation poorly
predicted oxygen uptake in gradient walking, not surprising considering no graded trials were used in the development of the equation, and the inherent limitations of our gradient variable. Future work should be dedicated to creating and testing a vertical component for the Weyand equation to better account for gradient walking.
The equation by Browning, et al., was created using 32 obese and 19 nonobese
participants walking at 11 speed/grade combinations (8). To our knowledge, this is the largest and most diverse adult population used to create a metabolic prediction equation. Because of this, we expected the Browning equation to predict oxygen consumption significantly better than other equations across walking speeds, grades, and adiposities. While the Browning equation did result in a mean prediction error that was not significantly different than zero (i.e. it was not
37
different from measured metabolic rate) during level walking in normal weight adults, the equation had an RMSE that was similar to other equations. Given that mean VO2 was 13.09 ml/kg/min for all participants in all walking trials, and the RMSE was 2.50, the Browning et al., equation resulted in 17.5% error compared to measured.
The results from this study indicate that there may be other variables more predictive of oxygen consumption that are not captured in these popular predictive methods. Other predictive methods have used mechanical variables to predict oxygen consumption. In 2011, Kramer et al., compared the ACSM walking equation with mechanical equations based on force production, ground reaction forces (GRF), segment lengths, the motion of the sacrum, internal work, and external work (34). Kramer found that while all methods were good at predicting within subject variation, few methods explained between subject variations. The addition of a subject specific variable (e.g. sex, height, weight, segment length) increased predictive abilities by 52-83% (34). The predictive abilities of all equations improved with the addition of either crural index (the ratio of the length of the lower leg compared to the thigh) or body mass (34). While body mass is a significant predictor of energy expenditure in humans, gait characteristics may explain why equations are not universally applicable across populations (76). Mechanical variables like crural index or step length are not quickly and easily assessed, which may prevent exercise specialists from using such formulas when creating exercise prescriptions. Furthermore, these variables would not be usable in the epidemiology community should scientists choose to compare population based oxygen uptake in large data sets of limited anthropometric characteristics.
There is a need for new metabolic prediction equations developed with easy to measure variables that result in the relatively small RMSE values (<10%). It is possible that certain
38
variables (e.g. sex, weight, segment length), or combinations of those variables would better predict oxygen consumption in some populations compared to others, and the possibility of population specific metabolic prediction equations should be pursued. In this case, exercise specialists could select the predictive method that is best suited to their patient or client based on age, sex, or adiposity, to create the most precise exercise prescriptions. All predictive methods exhibit a negative slope when prediction error is plotted vs. measured oxygen consumption. The negative slope indicates that as measured oxygen consumption increases (i.e. the speed increases for level walking) metabolic equations further underestimate walking metabolic rate. Because greater measured VO2 is associated with greater prediction error regardless of the predictive method, it is possible that a better approach would be to create equations based on exercise intensity (e.g. speed and grade in the case of walking). It may be that different equations for slow walking, vs. fast walking, as well as level vs. gradient walking may result in better predictive abilities. During typical walking speeds (e.g. 1.15 m/s), most metabolic prediction equations estimate walking metabolic rate with greater accuracy, given that zero MPD occurs at approximately 12 ml/kg/min. Walking is an economical mode of transportation below
approximately 4 mph (1.75 m/s), above this speed running has a smaller metabolic rate than walking. This suggests that 1.75 m/s may be the upper limit for estimating walking metabolic rate, as evidence by the negative slopes of the Bland Altman plots.
Metabolic prediction equations that underestimate walking metabolic rate will result in estimates of EE that are lower than the actual EE. If measured oxygen consumption in a 100 kg individual is 15 ml/kg/min (1.5 l/min), and the ACSM prediction equation under predicts by 20%, the predicted walking metabolic rate would be 12 ml/kg/min (1.2 l/min). Given that there are approximately five kcals expended per liter of oxygen consumed, the energy expenditure for
39
a 45-minute bout of steady state exercise would be 338 kcals at 1.5 l/min, and 270 kcals at 1.2 l/min. This difference in predicted vs. measured energy expenditure may be beneficial for weight loss participants closely monitoring their energy expenditure and energy intake. If physiological energy expenditure is greater than predicted, individuals may find themselves in an even greater negative energy expenditure, which may promote greater or faster weight loss.
All prediction equations resulted in 17-20% error compared to measured VO2. After more than a century of work and hundreds of studies investigating the walking energetics of humans and other species, one could conclude that the metabolic energy required to walk is too complex to be predict using simple and/or easy to measure variables (15, 35, 59, 76). Metabolic prediction equations may be able to account for individual variation (e.g. changes with speed and grade), but are unable to account for between-subject variation. This does not mean that
predictive methods should not be used, but rather that exercise specialists should accept that this error exists, and offer more flexibility in their exercise prescriptions. This may be particularly difficult in the clinical environment as prescriptions (e.g. walking speed and grade) are
specifically tailored to a given percentage of VO2 Max. Exercise professionals should rely on multiple tools in exercise prescription, such as Rating of Perceived Exertion (RPE) and heart rate to ensure that patients and clients are exercising at an optimal range while upholding their
cardiorespiratory safety. Additionally, exercise specialists could adjust estimated VO2 given the errors associated with each equation. Adjusting for the fixed and proportional biases in metabolic prediction equations would reduce some of the error associated with prediction equations,
resulting in a more accurate prediction. To eliminate the effects of mass, models that predict absolute VO2 (l/min) may result in lower errors than those in relative terms (ml/kg/min). Other methods for reducing the effects of mass on predictive methods may include allometric scaling,