Faculty of Technology and Society Computer Engineering
Bachelor thesis
Key Platform Features for Trustworthy A/B-testing
Plattformsegenskaper för trovärdig A/B-testning
Olle Caspersson
Exam: Bachelor of Science in Engineering Subject Area: Computer Engineering Date of final seminar: 30/5-2018
Examiner: Magnus Krampell Supervisor: Marie Gustafsson Friberger Co-supervisor: Aleksander Fabijan
Abstract
Web-based controlled experiments are increasingly becoming the norm for software development companies who want to become data-driven. One of the most common experiments today is A/B-tests. While it is easy to get results from A/B-tests, getting trustworthy results is harder. Although the research field of A/B-testing is active, there is no agreed definition of the necessary conditions for running trustworthy test. This thesis presents a set of trustworthy conditions and connect these with A/B-testing platform features. The results show what features to look for in platforms in order to achieve trustworthy results. The thesis also presents an evaluation of two common A/B-testing platforms available today. During the platform evaluation other features were found that could have the opposite impact on the trustworthiness of the results and this is also discussed in this thesis.
Sammanfattning
Webbaserade kontrollerade experiment håller alltmer på att bli normen för mjuk-varuföretag som vill bli data-drivna. Ett av de vanligaste experimenten idag är A/B-tester. Att få resultat från A/B-tester är enkelt, att få trovärdiga resultat är svårare. Även om forskningsområdet gällande A/B-testning är aktivt så finns det ännu ingen överenskommen definition av nödvändiga förutsättningar för trovärdig A/B-testning. Denna uppsats presenterar en uppsättning förutsättningar och kopplar samman dessa med egenskaper för A/B-testningsplattformar. Resultaten visar vilka egenskaper en plattform ska inneha för att uppnå trovärdiga resultat. Uppsatsen presenterar också en utvärdering av två vanliga A/B-testningsplattformar. Under denna utvärdering up-ptäcktes egenskaper som kan ha motsatt effekt på trovärdigheten av resultaten vilket också diskuteras i uppsatsen.
Keywords: Web Analytics, Online Controlled Experimentation, Plat-form Features, A/B-testing
Acknowledgements
I would like to thank my co-supervisor Aleksander Fabijan for the thesis suggestion and for his invaluable inputs throughout the thesis.
I would also like to thank my supervisor Marie Gustafsson Friberger for the support and feedback during the work of this thesis.
Finally, i would like to express my gratitude to Pete and Jimmy at Optimizely for partici-pating in the interview.
Contents
1 Introduction 1 1.1 Background . . . 1 1.2 Research Questions . . . 2 1.3 Limitations . . . 2 2 Theoretical Background 3 2.1 Controlled Experiments and A/B-tests . . . 32.2 Logging . . . 3
2.3 Metrics . . . 3
2.3.1 Overall Evaluation Criterion . . . 4
2.3.2 Key Performance Indicator . . . 4
2.3.3 Other Metrics . . . 4 2.4 Statistical Methods . . . 5 2.4.1 Null Hypothesis . . . 5 2.4.2 P-value . . . 5 2.4.3 Confidence Level . . . 5 2.5 A/B-tesing . . . 5 2.5.1 Users . . . 5 2.5.2 Sample Size . . . 6 2.5.3 Randomization algorithm . . . 6 2.5.4 A/A-tests . . . 6 2.6 A/B-testing Risks . . . 6 2.6.1 Peeking . . . 6
2.6.2 Primacy and Novelty Effects . . . 6
2.6.3 Carryover Effect . . . 7
3 Related Work 8 3.1 A Dirty Dozen: Twelve Common Metric Interpretation Pitfalls in Online Controlled Experiments . . . 8
3.2 The Evolution of Continuous Experimentation in Software Product Devel-opment . . . 9
3.3 Controlled experiments on the web: survey and practical guide . . . 9
3.4 Peeking at A/B Tests . . . 10
3.5 Trustworthy Online Controlled Experiments: Five Puzzling Outcomes Ex-plained . . . 10
4 Method 11 4.1 Literature review . . . 12
4.1.1 Defining Trustworthy Principles . . . 12
4.1.2 Selecting Platform Features . . . 12
4.1.3 Mapping Platform Features to Principles . . . 12
4.2 Intermediate Validation . . . 13
4.3 Platform selection . . . 13
4.4 Documentation Study . . . 13
4.4.1 Evaluation Through Documents . . . 13
4.5 Interview . . . 13
5 Trustworthy Principles and Platform Features 15
5.1 Trustworthy Principles . . . 15
5.1.1 Trustworthy Principles for the Experimentation Design Phase . . . . 15
5.1.2 Trustworthy Principles for the Experimentation Execution Phase . . 16
5.1.3 Trustworthy Principles for the Experimentation Analysis Phase . . . 17
5.2 Platform Features . . . 19
5.3 Mapping of Trustworthy Principles to Platform Features . . . 22
5.3.1 Features in the Experimentation Design Phase . . . 22
5.3.2 Features in the Experimentation Execution Phase . . . 22
5.3.3 Features in the Experimentation Analysis Phase . . . 23
5.4 Intermediate Validation . . . 24
6 Platform Evaluation 25 6.1 Evaluation Through Documentation Study . . . 25
6.1.1 Optimizely . . . 25
6.1.2 Visual Website Optimizer . . . 25
6.2 Evaluation Through Interview . . . 27
7 Discussion 29 7.1 General Discussion . . . 29
7.2 Method Discussion . . . 29
8 Conclusions 31 8.1 Answering the Research Questions . . . 31
8.2 Future Work . . . 31
8.3 Contributions . . . 32
Appendices 35
A Search Criteria 35
Glossary
A/B-test
A controlled experiment that tests two variations (A and B) in order to determine which variation is the most effective based on a statistical test. i, iv, 1–3, 5, 6, 8–10, 12, 13, 15, 19, 25, 29, 31, 32
ACM
Association for Computing Machinery. 8, 12 CE
Controlled experiment. An experiment in which an observer tests a hypothesis by looking for changes brought on by alterations to a variable. 3, 4, 9
CTR
Click-through rate. The ratio of users who click on a specific link or button to the number of users who visit the page. 3, 5, 7
DAU
Daily Active Users. 4 IEEE
Institute of Electrical and Electronics Engineers. 8, 12 KPI
Key Performance Indicator. 4 MVT
Multivariate testing. Similar to A/B-testing but tests more than two variations. 9, 25 OEC
Overall evaluation criterion. A quantitative measure of a controlled experiment’s objective. 4–6, 8, 9, 15–18, 23
OTT
Over the top. Video, sound and other media that bypasses the traditional distributor of such content (i.e. cable companies, telecommunications or broadcast television. 2, 25 PLT
Page Load Time. 5, 8, 23 SRM
tvOS
Operating system developed by Apple Inc.. 25 UI
User Interface. 9 VWO
1
Introduction
This chapter introduces the background of the thesis as well as the research question with its limitations.
1.1 Background
Many software development companies today are trying to become data-driven [1], meaning that the decisions on how a product should be developed is based on data rather than the intuition of the developer. This intuition can often be wrong [2]. According to Kohavi et al. about one-third of the experiments executed at Microsoft are successful [3].
In web analytics, conducting online controlled experiments is one method of evaluating ideas by collecting customer and product data to be analyzed and its benefits has been displayed in research as well as in industry by several software companies [2] [4]. One ben-efit of running online controlled experiments is purely financial. Companies like Google, Amazon, eBay, LinkedIn, Facebook and Microsoft are continuously running tens of thou-sands of online controlled experiments each year in order to make data-driven decisions that increases their revenue [5]. For instance, the annual revenue for Microsoft has increased with hundreds of millions of dollars since scaling the experimentation platform across the company [6]. But the financial benefit is not the only reason why companies run online controlled experiments. Even more benefits are found on the product level. Here, the experimentation has been proved to both improve the product quality as well as ensuring the quality of the product. It has also been shown that online controlled experiments sta-bilizes and lowers the complexity of the product. The experimentation can also benefit the development team by improving their planning and their ability to decide realistic goals [2].
One of the most common online controlled experiment software companies run today is called A/B-testing. A typical A/B-test consists of two different variations of a variable, usually called control and treatment [7]. The purpose is to determine the best variation of the two. This is done by collecting and evaluating data on the different variations. For example, a website wants to know what colour of a certain button will generate more clicks, making the two variations the same button but with different colours. The visitors of the website are then shown one of the two variations and the results are analyzed. The most effective variation is the one that generated most clicks.
A/B-testing is an active area of research and several articles mention the trustworthy results in the context of testing but there is no known definition of trustworthy A/B-testing. This thesis aims to define trustworthy A/B-testing by compiling information by the previously mentioned articles and by identifying A/B-testing features that relate to the definition. In addition to that, this thesis aims to identify these features in existing A/B-testing platforms. Some companies have developed their own in-house experimentation platform for running their A/B-tests [8] and features for these platforms are mentioned in the related literature [6] [1]. However, these in-house platforms are not available to everyone. Thus, this thesis will focus on some of the most common commercial platforms available today and the features that these platforms include.
1.2 Research Questions
Online controlled experiments are increasingly being used by companies to make deci-sions based on customer preferences. In order to run an online controlled experiment (for example an A/B-test) a testing platform is needed. There are many different platforms available for conducting these experiments, each with their own set of features and capabil-ities. However, A/B-tests are sensitive to small errors and lost data and thus it is unclear whether all of these platforms offer trustworthy results. This thesis aims to examine the possibilities of determining to what extent an A/B-testing platform provides trustworthy results by answering the following research questions:
RQ 1 Which are the key features an A/B-testing platform need in order to provide trust-worthy results?
RQ 2 To what extent do common A/B-testing platforms include the features identified in RQ 1?
1.3 Limitations
There are lots of different areas of use for A/B-testing. They can be run in many different types of software products like over the top (OTT)-players, mobile applications and game consoles just to mention a few. For this reason, the thesis will be limited to online controlled experimentation conducted on websites which is a common area of use.
Since there are many platforms available for conducting online controlled experiments (A/B-testing), this thesis is limited to investigate some of the most common platforms on the market. The selection of platforms can be seen in Section 4.3.
2
Theoretical Background
This section presents a theoretical background relevant to this thesis. It covers the basic terminology of controlled experiments and statistics. The aim is to provide information that is necessary in order to understand the problem domain of the thesis.
2.1 Controlled Experiments and A/B-tests
While the theory of controlled experiment (CE)s originate from the 1920s, the use of online controlled experiments started in the 1990s and increased with the growth of the Internet [6]. In the simplest form of a CE, users are randomly split between two different variations (e.g. two different layouts of a website or a back-end change of a search engine), usually called control (A) and treatment (B). The control is usually the variation that is currently used while the treatment is a modification with aims to improve the control. The user is exposed to the same variation if visiting multiple times [6]. A CE with two different variations are called A/B-tests. First of all, a new feature is introduced in the treatment variation. Then data on user interactions with certain key variables are collected. These variables differ depending on the purpose of the test and in the case of testing a website it could be click-through rate (CTR) or dwell time (the time user spends at a website after clicking a link on a search engine). The data is then analyzed and the key metrics (e.g. user engagement) are calculated. Any differences (i.e changes in user behaviour) in these key metrics are the effect of the new feature in the treatment variation since any external factors (e.g seasonality and the impact of other product changes) are evenly distributed between the control and the treatment [9].
2.2 Logging
In order to evaluate the results of an experiment, raw data must be collected, e.g. clicks and session times. When a user performs an action, e.g. clicks a button, a data point is generated and the code that generates these data points is referred to as logging. This raw data is then computed to metrics that can be used to analyze and evaluate the outcome of the experiment [4].
2.3 Metrics
A metric is something that can quantitatively measure the impact of a new feature [10] in the treatment variation in an A/B-test and in order for the test to be successful, a set of metrics has to be decided. When an experiment is running, the metrics indicate how the treatment variation differs from the control variation and when the experiment is over the metrics show if the experiment was successful or not. In other words, they play an important part in every stage of experimentation (i.e. experiment design, experiment execution and experiment analysis). However, having a good set of metrics is not enough if the interpretation of the metrics is incorrect [9].
2.3.1 Overall Evaluation Criterion
The Overall evaluation criterion (OEC) is a quantitative measure of the CEs’ objective [1] (i.e. an objective that is measurable). For instance it could be metrics such as Daily Active Users (DAU), revenue, number of units purchased, number of conversions, the conversion rate or a combination of multiple objectives [4]. On a website, a conversion is counted when a user completes a certain goal. Depending on the website, this could be anything from filling out a form to completing a purchase [11]. The conversion rate is the ratio between completed goals and visitors:
Conversion rate = Number of completed goals
Number of visitors (1)
The OEC is used to determine whether an experiment is successful or not. Large organiza-tions can have multiple OECs, i.e. multiple key metrics that are measured. [12]. Coming up with a good OEC takes time and thoughtful consideration but many agree that it should be focused on long-term goals and that the OEC is adjusted continuously [4] [13]. Although it is important that the long-term goals are in focus, the OEC consists of metrics that is measurable in the short-term (i.e. the OEC should be predictive of the long-term goals of the company, that is the key performance indicator (KPI)) [14] [12].
2.3.2 Key Performance Indicator
In contrast to the OEC a KPI is something that is measurable over a long period of time. The OEC is called a leading indicator since it is used to predict the long-term goals of experimentation. Correspondingly, the KPI is called a lagging indicator since it only show the results of past experimentation and does not predict future results [15].
2.3.3 Other Metrics
Although only a few metrics are used to make a shipping decision (i.e. whether a change is to be launched to all users or not) there are often many other metrics monitored in the experiment to ensure the right decision is being made and these can be divided into four different categories [9].
Data Quality Metrics Data Quality Metrics are used to ensure that the result of the experiment is reliable and trustworthy. An example of such a metric is the Sample Ratio Mismatch (SRM). This metric is used to control if the ratio between the control variation and the treatment variation is divided correctly. If the SRM shows signs of a selection bias, the validity of the experiment should be questioned.
OEC Metrics If the Data Quality Metrics show that the results can be trusted, the OEC Metrics shows the actual result. These metrics are used to spot the differences between the treatment variation and the control variation. It is recommended to have but one OEC Metric since this gives clear directions of the experiment purpose [4]. Number of clicks could be an OEC Metric although more long-term focused metrics, such as repeat visits to a site, are to prefer.
Guardrail Metrics Guardrail Metrics are metrics "which are not clearly indicative of success of the feature being tested, but which we do not want to significantly harm when making a ship decision" [9]. Some change in these metrics can be expected and also accepted but a larger negative effect of the implemented feature are generally not allowed. For example, when adding a new feature to a website the Page Load Time (PLT) is expected to be longer but too big a change will surely affect the user experience.
Local Feature and Diagnostic Metrics Local Feature and Diagnostic Metrics are used to measure individual features of a product. These metrics are also used to determine why the OEC Metrics changes or not. For example, the CTR on a page can be increased but this can be accompanied by negative effects on other related metrics.
2.4 Statistical Methods
2.4.1 Null Hypothesis
The null hypothesis, often referred to as H0, is the hypothesis that any difference in the
OECs in the control and treatment variation are due to random fluctuations [4] meaning that the treatment variation offers no improvement. An A/B-test’s aim is to disprove or reject the null hypothesis.
2.4.2 P-value
The p-value, or probability value, is a value used when testing a hypothesis using statistics. It can be explained as "the probability under the null hypothesis of finding data at least as extreme as the observed test statistic" [7] meaning the probability, when the null hypothesis is true, of getting the actual test result (or a result of greater magnitude). A low p-value means that the results are unlikely and that there is enough evidence from the experiment that the null hypothesis can be rejected.
2.4.3 Confidence Level
According to Kohavi et al. [5] the confidence level can be explained as "the probability of failing to reject (i.e. retaining) the null hypothesis when it is true". It is common to use a confidence level of 95% when evaluating the test results. What this means is that if the test were to run over and over again, the results from the sample size would match the one from the actual population 95% of the time [16].
2.5 A/B-tesing
2.5.1 Users
In A/B-testing a user is the object that is exposed to the test. For instance, on the web a common user is the visitor of the website. An A/B-test often consist of thousands of users divided between the two variations [5].
2.5.2 Sample Size
The sample size is the number of users will participate in the experimentation. In online controlled experimentation it is common that the sample size increases as the experiment is running. A larger sample size can provide better statistical background and higher statistical power for many different metrics but this is not the case for all metrics. Therefore it is important to consider which the OEC metrics are before increasing the sample size (i.e. running the experiment longer).
2.5.3 Randomization algorithm
When dividing users between the control and treatment variation it is important to use a randomization algorithm. It is crucial that the randomization algorithm is truly random when mapping users to variations, meaning that the users should have the same probability of experiencing the control and the treatment variation (in the case of an equal split between control and treatment) [4]. The algorithm should also make sure that if a user visits multiple times, the same variation should be shown.
2.5.4 A/A-tests
An A/A-test divides users in two different groups but unlike an A/B-test the different groups are shown the same variation. The A/A-test is used both to collect and evaluate data and also test the experimentation platform [4] [5]. There should be no imbalance between the two groups since the same variation is shown. When an A/A-test shows no signs of imbalance, the sample size can be considered non biased and one of the variations can be configured as a treatment [1].
2.6 A/B-testing Risks
2.6.1 Peeking
In A/B-testing, it is common for the company running the experiment to continuously monitor it (i.e. monitoring the important metrics and values) in order to detect effects of the experimentation as soon as possible [7]. This behaviour is called peeking. Although it can be useful to see if there is any direct effect of the implemented change there is also a risk following this. Peeking at an ongoing experiment were no direct impact of a new feature can be detected, many experimenters tend to jump to conclusions and abort the experiment in order to test something else before the sample size is reached [7]. Also, if the experimenter notices early that a new feature is having a positive impact it is easy to be biased and ship the change too early, since the change just might be a false positive.
2.6.2 Primacy and Novelty Effects
When a new feature is introduced there is a risk that the feature causes a novelty or a primacy effect. These effects can affect experimentation, especially when continuously monitoring the experiments. For example, if the added feature is a new way to navigate a website it takes time for the users to get used to this new way. Therefore the early results
might indicate a negative user experience but this result might not be the same later on in the experiment. This is called a primacy effect [5]. Using the same example, this can also generate a novelty effect as the users might be clicking everywhere in order to learn the new way. This affects metrics such as the CTR and can indicate that this new feature makes the users more engaged than they actually are.
2.6.3 Carryover Effect
Depending on how the sample size is split between variations there is a risk of a so called carryover effect. Some experimentation platforms use the "bucket system" which randomly divides the experimental users in different "buckets" which are then assigned to one of the variations. These buckets can easily be reused in consecutive experimentation meaning that the same users can be exposed for follow-on experiments which often affects the early results of the experiment [5]. This is called the carryover effect.
3
Related Work
This section introduces articles that in some way are relevant for this thesis. The content of the articles are summarized and their relevance to this thesis is explained. Since there is no similar comparative review of online controlled experimentation platforms the articles are mostly relevant to RQ1. Multiple databases, including Institute of Electrical and Electronics Engineers (IEEE), Association for Computing Machinery (ACM) and Google Scholar, were used with different combinations of key words. The search criteria can be found in Appendix A.
3.1 A Dirty Dozen: Twelve Common Metric Interpretation Pitfalls in Online Controlled Experiments
In this article, Dmitriev et al. [9] present common metric interpretation pitfalls. The aim of the article is to inform other experimenters on what the consequences of misinterpreted metrics are and how this can be avoided. The author’s start with a short explanation of A/B-testing and why these tests are becoming "the gold standard for evaluating im-provements to web sites, mobile applications, desktop applications, services and operating systems" [9]. They also introduce different important metrics that often are misinterpreted and divide these into four groups: Data Quality Metrics, OEC Metrics, Guardrail Metrics and Local Feature and Diagnostic Metrics. Twelve examples of when these metrics are misinterpreted are then presented. The examples are some of the most common metric interpretation pitfalls observed by the Analysis and Experimentation Team at Microsoft. One example is taken from a test performed on the MSN.com homepage. When users clicked on a link, some opened the link in a new tab and some in the same tab. The PLT of the control and treatment variations were then measured. The results showed a considerable increase in the PLT for the treatment variation. The experimentation team wondered how this change of one line of code could cause such a performance degradation. The explanation was that when the users wanted to come back to the homepage they could use the back button in the browser which has a faster PLT than the first page load (due to browser caching). This resulted in the average PLT being faster for the control variation. The authors call this metric SRM (see Section 2.3.3) and there is a variety of causes for this. In the given example, it is caused by a change in user behavior. The proposed solution for avoiding these mismatches is to run the experimentation on platforms that can detect and warn the experimenters about them.
The article is relevant to this thesis because it introduces important metrics and how these are misinterpreted. These metrics are important for the definition of trustworthy experimentation and can also be mapped to the different platform features that can ensure the trustworthiness of the metrics.
3.2 The Evolution of Continuous Experimentation in Software Product Development
In this article, Fabijan et al. [1] targets software development companies that in some way struggle with scaling their experimentation. It aims to function as a guide for each phase in the process of scaling by answering the research question: “How to evolve con-trolled experimentation in software-intensive companies in order to become data-driven at scale?”. The authors describe the process that Microsoft went through in order to become a data-driven company at scale. The authors provide several examples on different exper-iments conducted at different departments of Microsoft. Furthermore the authors present a model called "The Experimentation Evolution Model", based on the previous examples. The model contains "three dimensions of evolution: technical, organizational and busi-ness evolution" [1] and each dimension has four phases: crawl, walk, run and fly (crawl being the first phase of scaling, walk being the second phase and so on). Every dimen-sion has different focuses and development activities which are thoroughly described. The chosen method is an inductive case review which is based on data collected during a two year period, resulting in the previously mentioned model which aims to help companies to establish and scale their experimentation.
While other articles have provided step-by-step guides on how to implement experiments, this article’s aim is instead on how to scale the experimentation by, for instance, empha-sizing the importance of the OEC. The article also provides background information about online controlled experimentation as well as examples on real-life implementation of such experiments.
3.3 Controlled experiments on the web: survey and practical guide
In this article, Kohavi et al. [4] provides a practical guide on how to conduct online con-trolled experiments, both multivariate testing (MVT) and A/B-testing. The authors start by providing four different examples of experiments including smaller User Interface(ui)-changes to Interface(ui)-changes in back-end algorithms and the results of these experiments. The first example being a small UI-change in a webshop was that just by adding a text field with the caption "Enter Coupon Code" the company lost 90% of their revenue. The authors give the following explanation to the result: "people started to think twice about whether they were paying too much because there are discount coupons out there that they do not have" [4]. Further, the authors explain terminology, review statistical power and sample size in the context of CEs as well as how to reduce variance within them. According to the authors, the article provides key lessons and important insights in how to run trustworthy CE. In addition to that the authors, who have run a large number of online controlled experiments [4] share some practical lessons in three different areas: analysis, trust and execution, culture and business in order to help others avoid the pitfalls of CEs.
Even though the article contains information and techniques beyond the scope of this thesis (i.e. MVTs) it contains an extensive terminology chapter which goes beyond explaining just the basics of A/B-testing. It also provides lessons and examples from real-life experiments which can aid in finding key features of trustworthy experimentation.
3.4 Peeking at A/B Tests
In this article, Johari et al. [7] discuss the importance of continuously monitoring values, such as p-values and confidence interval. According to the authors there is an issue that continuous monitoring of p-values and confidence intervals during experiments give unre-liable inference. The authors aim with this article is to "provide always valid p-values and confidence intervals that are provably robust" [7]. The authors begin by explaining the pre-viously mentioned issue of A/B-testing. Further, the authors propose their own definition of always valid p-values and confidence intervals which they claim provide valid inference even when the experiments are continuously monitored. In order to back their claims, the authors run simulations and provide numerical studies based on data from Optimizely’s platform. The results show that the authors’ definition of always valid p-values and confi-dence intervals improve the reliability of the inference drawn from experiments.
The article provides an in depth explanation to p-values and confidence intervals and the problem that occur with these values when continuously monitored during experiments. It also explains that most A/B-testing-platforms offer the possibility of continuously mon-itoring experiments and the previously mentioned problem with this is important to un-derstand.
3.5 Trustworthy Online Controlled Experiments: Five Puzzling Out-comes Explained
In "Trustworthy Online Controlled Experiments: Five Puzzling Outcomes Explained" Ko-havi et al. [5] share learnings and discoveries from real-life experiments ran at Microsoft. They have identified that it is easy to misinterpret collected data and that not all data can be trusted, "generating numbers is easy; generating numbers you should trust is hard!" [5]. The aim of the article is to explain how collected data should not always be trusted and how to mitigate some of the issues that can occur when performing experimentation in order to increase trustworthiness of online controlled experimentation. The authors do this by presenting examples from experimentation ran at Microsoft which are general and useful not only to the specific example. The authors also provide background information, expla-nations and either a mitigation or just the lesson that they learned from the experiment for each example. For instance, one example explains the importance of randomization when distributing experimental units (i.e. users, visitors to a website etc) to the different variations. First, the carryover effect (explained in chapter 2) and why it can occur when experimentation use the "bucket system" when assigning users to experiments is explained. Second, the authors explain how to mitigate this problem by local randomization.
In order to answer the research questions of this thesis it is important to understand common pitfalls and problems of online controlled experimentation and this article presents several such examples. Some of the problems is due to platform features which has even more relevance to this thesis.
4
Method
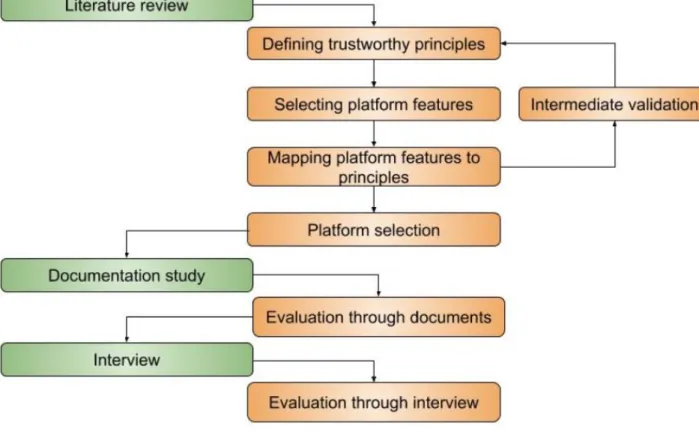
This chapter presents the chosen methodology for the thesis. It can be seen as a mix-ture of three different methodologies, a literamix-ture review, a documentation study and an interview. The three methodologies were considered to be the most suitable in order to answer the research questions. The literature review was chosen in order to give a basic understanding for the subject and also to provide material needed in order to answer RQ 1. The documentation study was conducted in order to answer RQ 2 and was chosen because documentation on the platforms were easy to access. Finally, an interview was conducted in order to validate the results from the documentation study.
Figure 1 presents the thesis workflow. The literature review, the documentation study and the interview can be seen as the main steps of the methodology and these step are necessary to conduct before the sub-steps in the methodology.
4.1 Literature review
According to Oates [17], a literature review can be broken down into seven steps; searching, obtaining, assessing, reading, critically evaluating and writing a critical review. The first step of the literature consisted of searching for literature in several databases, such as IEEE, ACM and Google Scholar. Different keywords were used in different combinations in order to find relevant articles. See Appendix A for the keywords used. Next, the articles that consisted of the keywords used when searching in the databases were obtained. The articles were then read and evaluated. Those who had no relevance to this thesis (despite matching keywords) were rejected. The next step of the literature review was to write a review of the articles. Since the literature search resulted in a large number of articles, only a few with particular relevance to this thesis were selected for this step. These can be found in Chapter 3. The literature review provided enough material in order to continue with the next steps.
4.1.1 Defining Trustworthy Principles
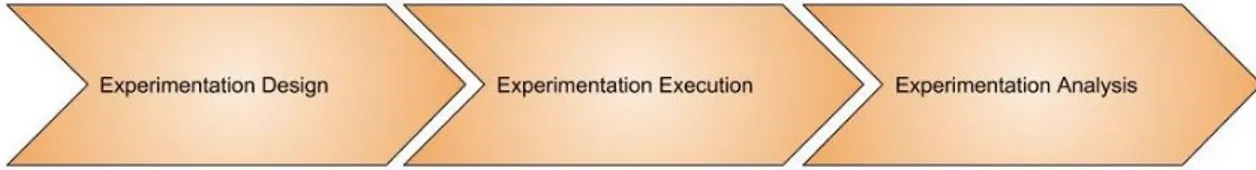
Next, a definition of the word trustworthy in the context of A/B-testing had to be deter-mined. This definition were based on the material from the literature review. First, three different phases of experimentation was identified as seen in Figure 2.
Figure 2: Experimentation phases
In each of the phases three different conditions for trustworthy A/B-testing were identified, referred to as trustworthy principles. One way of finding these principles are to look for real-life examples and the pitfalls described in the literature. By examining these pitfalls, and why the experiments led to non-trustworthy results it is possible to identify different conditions that can be considered a necessity for trustworthy A/B-testing. The principles are described in section 5.1.1, 5.1.2 and 5.1.3.
4.1.2 Selecting Platform Features
The next step was to identify common platform features. This was done by further studies of the material provided by the literature review. This step resulted in seventeen different platform features, see section 5.2 for a description of the platform features.
4.1.3 Mapping Platform Features to Principles
In order to compare the different A/B-testing-platforms in the context of trustworthiness this definition had to be concretized, meaning that the determined definition and identified
features needed to be connected. This was done by mapping the identified features to the trustworthy principles that was found in the collected material. Different features had impact on several of the trustworthy principles and some features had impact on the same principles. Section 5.3 presents the results of this mapping.
4.2 Intermediate Validation
This step of the methodology can be seen as an iterative validation of the current results (Chapter 5. In four different sessions the author of this thesis met with a subject matter expert in the area of A/B-testing with three years of experience from working at the Analysis and Experimentation (A&E) team at Microsoft.
4.3 Platform selection
The next step was to select several platforms that the results of the previous steps were going to be evaluated on. The selection were based on different websites ranking the most common and popular platforms, both commercial and open source [18] [19] [20]. The selected platforms were Optimizely and Visual Website Optimizer. The platforms are described more thoroughly in Section 6.1.1 and 6.1.2 and the identified features can be found in Table 4.
4.4 Documentation Study
In order to generate material for the platform evaluation a documentation study was con-ducted. According to Oates [17], there are two types of documents: found documents and researcher-generated documents. This document study consisted of found documents, i.e. documents that "exist prior to the research" [17]. These documents were exclusively from the developers of the platforms. Section 6.1.1 and 6.1.2 presents the documents used to perform the platform evaluation.
4.4.1 Evaluation Through Documents
The documentation study provided the material for this next step of the methodology, the platform evaluation through documentation study. The purpose of this step was to evaluate the trustworthiness of different A/B-testing platforms by identifying the features from section 5.2 in the selected platforms and therefore see to what extent the platforms included the trustworthy principles from Table 1. The features identified in the selected platforms can be found in Chapter 6.
4.5 Interview
In addition to the evaluation through documents another method was used in order to further evaluate the Optimizely platform. A semi-structured interview was conducted. In a semi-structured interview there is an agenda with themes to be covered but at the same time the order of this agenda can be changed due the flow of the conversation [17].
interview was carried out between 18.00 and 18.30 CET on the 17th of May 2018 in an online meeting room using the Zoom Video Conference platform. The interview consisted of four participants: the thesis author, the thesis co-supervisor, the co-founder of Optimizely and a statistician at Optimizely. The day before the interview the participants received a draft version of the evaluation generated by the documentation study, see Appendix B. During the interview, the draft was used as the basis for discussion.
4.5.1 Evaluation Through Interview
The previously conducted interview provided material for the final step of the methodology. The purpose of this step was to further evaluate Optimizely and to compare and validate the results from the evaluation based on documents. During the interview, the draft (Appendix B, and especially the column with our initial evaluation were discussed. The results can be found in Section 6.2.
5
Trustworthy Principles and Platform Features
5.1 Trustworthy Principles
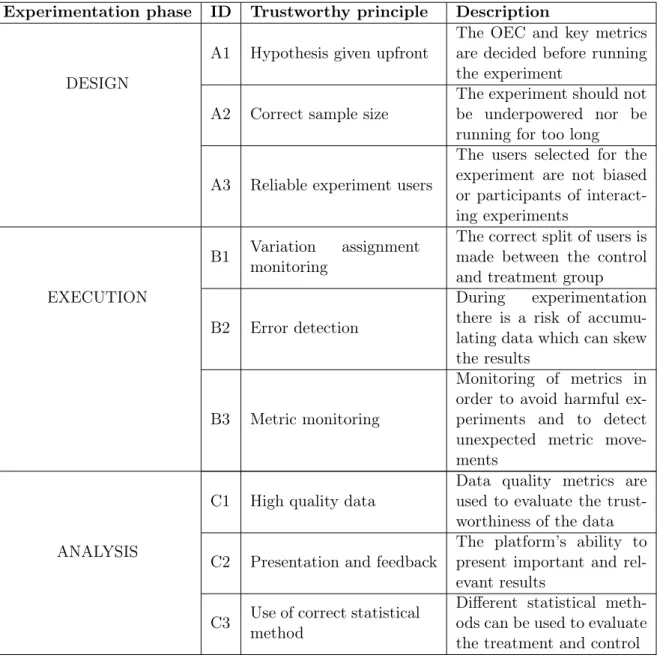
From the literature study three different phases of experimentation were established. The design phase, the execution phase and the analysis phase [4]. In each phase a number of key conditions for trustworthy A/B-testing were identified, referred to as trustworthy principles. These are described in the following sections and also summarized in Table 1. The table is divided in the three different phases and each trustworthy principle has been given an ID: A for the design phase, B for the execution phase and C for the analysis phase.
5.1.1 Trustworthy Principles for the Experimentation Design Phase
The first phase of experimentation identified was the experimentation design phase. In this stage the treatment variation is designed, i.e. the feature that will be tested in the experiment. Further, the sample size is decided and a hypothesis for the feature is given [4]. In some cases a feature is more relevant in a certain geographical area and this is also decided in the experimentation phase. An OEC for the control and treatment variation is established and other important metrics is decided upon, these will be monitored and analyzed in the next phases of experimentation.
Below follows the key trustworthy principles of the experimentation design phase that were identified through studies of the material provided by the literature review (see Section 4.1.1.
Hypothesis given upfront It is important to decide what will be tested and which met-rics that are important for the tested feature, i.e. the OEC metmet-rics [4]. If the hypothesis is not given upfront, the risk of finding what seems to be significant results by chance increases and this yields untrustworthy results.
Correct sample size As mentioned in Chapter 2, a larger sample size can improve the statistical power of an experiment for some metrics. Correspondingly, an experiment is underpowered when the sample size is too small [4]. Thus it is important for the trust-worthiness of the experiment that a correct sample size is used so that the experiment is executed as long as required. For some metrics, the statistical power decreases as the sample size increases and for these metrics the correct sample size is of great importance [4].
Reliable experiment users As previously mentioned, some experiment platforms uses the "bucket systems" that divides users in to different "buckets" which are reused in follow-on experiments which can cause a carryover effect [5]. There is a risk in using the same users in consecutive experiments. Some users might participate in simultaneous experiments and it is important that these experiments are not conflicting in any way [12].
5.1.2 Trustworthy Principles for the Experimentation Execution Phase In the second phase of experimentation the OEC and other key metrics have already been decided and the experiment is running. Now the user interactions on the control and treatment variation are instrumented and logged [5]. The OEC metrics and other relevant metrics are observed [14]. The experimenter can at this phase monitor the difference between the variations and if necessary abort a bad experiment.
Below follows the key trustworthy principles of the experiment execution phase that were identified in the literature (see Section 4.1.1.
Variation assignment monitoring Depending on the split between the control and treatment variation (e.g. 50/50, 70/30 etc.) the platform should divide this accordingly [4], i.e. if the split is set to be 50/50 between A and B in the design phase this should also be the case during the experiment. However, this is not always the case. To get trustworthy results it is crucial that this split is made right and that the correct number of users are divided to the different variations, there should be no bias towards any of the variations. This assignment should be monitored by the experimenters and adjusted if any variation is over- or underrepresented.
Error detection During the experimentation execution phase lots of data on metrics and variables are collected. Not all of this data is useful and some can cause inaccurate results. There is also a risk of losing data points. Users might lose connection or the website might crash before the data points can be returned to the server and cause missing values [9]. Therefore it is important to have mechanisms that can identify missing values and other data that can skew results.
Metric monitoring It is important that the experimentation is continuously monitored. Not only because some experiments can be harmful but also because when unexpected metric movements occur, both positive and negative, it usually means that there are some sort of issue with the experiment [9]. Thus it is important that the experimentation platforms aid in discovering such metric movements.
5.1.3 Trustworthy Principles for the Experimentation Analysis Phase
In the third and final phase of experimentation, called experimentation analysis, key met-rics have been logged, the decided sample size has been reached and the experiment is stopped [4]. What remains in this phase is to analyze and evaluate the result. If the null hypothesis has been rejected, i.e. the treatment offered an improvement of the OEC metrics, the experiment is counted as successful [5]. Then a ship/no-ship decision is taken, meaning that it is decided if the feature should be launched or not.
The following key trustworthy principles of the experimentation analysis phase that were identified in the material provided by the literature review (see Section 4.1.1.
High quality data This principle is crucial to the trustworthiness of an experiment. In order to ensure that the experimentation has resulted in high quality data, data quality metrics are used [9]. Common data quality metrics are ratio metrics. One example of such a metric is the user ratio between the treatment and control variations. A mismatch in the assignment of users (SRM) can lead to untrustworthy results [9].
Presentation and feedback When the experimentation is done, i.e. the decided sample size has been reached, the results need to be evaluated and analyzed. The experimentation platform should present the relevant data and if there were any issues during the experi-mentation execution phase. For instance, if there was an issue concerning the data quality metrics this should be given as feedback to the experimenter [5].
Use of correct statistical method Depending on which metrics that are measured sta-tistical methods can be used to compute the difference between treatment and control. Since there are different statistical methods to evaluate if the treatment were different from the control (e.g. the t-test and the delta method) it is important that the correct statistical method is used [4].
Table 1: Trustworthy principles
Experimentation phase ID Trustworthy principle Description
DESIGN
A1 Hypothesis given upfront
The OEC and key metrics are decided before running the experiment
A2 Correct sample size
The experiment should not be underpowered nor be running for too long
A3 Reliable experiment users
The users selected for the experiment are not biased or participants of interact-ing experiments
EXECUTION
B1 Variation assignment monitoring
The correct split of users is made between the control and treatment group
B2 Error detection
During experimentation there is a risk of accumu-lating data which can skew the results
B3 Metric monitoring
Monitoring of metrics in order to avoid harmful ex-periments and to detect unexpected metric move-ments
ANALYSIS
C1 High quality data
Data quality metrics are used to evaluate the trust-worthiness of the data C2 Presentation and feedback
The platform’s ability to present important and rel-evant results
C3 Use of correct statistical method
Different statistical meth-ods can be used to evaluate the treatment and control
5.2 Platform Features
In the previous section, a set of trustworthy principles were introduced. This section presents a description of the identified A/B-testing platform features. The features were found when studying the material from the literature review and this section presents a selection of these features which has an impact on the trustworthiness of experimentation. It is common that the different platforms have different names for the same feature and a more general term has been chosen when presented in this thesis.
Below follows the platform features identified in the literature together with a description of the feature. They are also summarized and given an ID in Table 2.
A/A-test One common platform feature is the ability to run an A/A-test. This test is usually performed in order to test the instrumentation of the experimentation platform, e.g. logging and metric computation. It is also used to ensure that there are no carryover effects from previous experimentation since this affects the results [5]. In other words, it is a feature that can help experimenters validate both the platform and the users. It can also be used to spot errors with user assignment to variations so that the correct split is carried out. Furthermore it can validate that the key metrics are collected without any issues.
Power analysis The power analysis is a feature used for determining the minimal sample size needed to detect a change in an experiment and therefore also the duration of the experiment [1]. It is also used to determine the ratio between users in the control and treatment groups.
SRM-test One of the most important data quality metrics is the SRM. It occurs when the expected ratio of the user assignment is not satisfied, i.e. the split between the control and treatment variation is incorrect which causes results to be invalid [9]. The SRM-test is used to detect if the ratio is correct and therefore if the results are trustworthy or not. Outlier filtering When a metric is at an extreme value compared to the normal one it becomes an outlier. Outliers can skew metrics and thus making it harder to interpret the result [9]. For example, Amazon noticed that one user made a massive book order. This turned out to be from a library account [13]. These types of outliers can skew a whole test making the result invalid. It is therefore important to have a feature that can filter outliers which makes for a more trustworthy result since outliers otherwise skew the result. Randomization algorithm The randomization algorithm of the experimentation plat-form is an important feature. In order to provide trustworthy results the randomization algorithm should divide the users properly between control and treatment and consistently show recurrent users the same variation [4].
Alerting After the experiment is finished the alerting feature informs the experimenter if there were any notable metric movements [21].
Near real-time alerting If an important metric is experiencing a significant negative movement this feature makes the experimentation platform alert the experimenter on this movement [1]. Any feature that noticeably decreases the user experience should be aborted immediately and the near real-time alerting feature can help detect these harmful experi-ments.
move-shuts down the experiment [1].
Accurate peeking Peeking on experiments, described in Section 2.6.1, can be problem-atic. Especially for someone who is a novice since it can be hard to interpret the early results of an experiment [7]. Therefore it is important that the platform guides the exper-imenter to not take a hasty decision.
Interaction detection Sometimes users participate in multiple experiments at the same time. If the users participate in two (or more) experiments that have a correlation the experimentation can be affected since some experiment combinations can cause bugs and therefore harm the users and also skew the results [12]. This platform feature detects these types of interactions and alerts the experimenter.
Ship recommendation After an experiment is finished, this feature analyze the result and suggests if the treatment that was tested should be shipped or not [21].
Analytics presentation Some platforms have their own features to analyze the results while others integrate their platforms with other analytic tools such as Google Analytics. If a platform automatically can analyze and pinpoint changes in important metrics and present these, this eliminates the human factor.
Conditional triggering The data collected from online controlled experiments are often of great variability. Therefore a feature that can separate the useful data from "noise", i.e. only use the data from users that are affected by the tested feature. Conditional triggering starts the experiment when certain conditions have been met [4].
Missing data detection There is always a risk of losing data when it is transmitted through, for example, WiFi. If the loss is the same for both the control and the treatment this is no problem but when one of the variations loses more data then the other this can make the results invalid [9].
Novelty and primacy effect detection As explained in Section 2.6.2 the novelty and primacy effect can affect the decisions taken by the experimenter. A positive metric move-ment can cause an incorrect shipping decision while a negative movemove-ment can cause the experimenter to shut down an experiment which later might have turned out good [5]. Use correct statistical test Depending on which the key metrics are for the experiment, this feature recommends the use of the correct statistical test when evaluating the difference between the control and treatment variations.
Heterogeneous treatment effect detection A heterogeneous treatment effect occurs when the results are different between certain user groups. For example, an added feature can have positive effects on users using web browser A while it can be negative for the ones using browser B. The end result might still be good but when the feature is shipped it affects the users using browser B negatively. This platform feature detects the heterogeneous treatment effects and informs the experimenter about it [9].
Table 2: Platform features
ID Platform feature Description
F1 A/A-test Conducted in order to validate both sample size
and collected data
F2 Power analysis Performed in order to determine the sample size of an experiment
F3 SRM-test A test that validates that the users are divided
correctly in the treatment and control variation. F4 Outlier filtering The ability of the platform to automatically
fil-ter outliers
F5 Randomization algorithm The randomization algorithm divides users be-tween different variations
F6 Alerting Alerts the experimenter about negative metric
movements after the experiment is done
F7 Near real-time alerting The platform alerts on negative metric move-ments during the experimentation
F8 Auto-shutdown The platform can automatically identify and
shut down a bad experiment
F9 Accurate peeking This feature concerns early peeking and how the platform presents the current results
F10 Interaction detection This platform feature detects users that partici-pate in multiple conflicting experiments
F11 Ship recommendation The feature gives a ship / no-ship recommenda-tion after the experiment is finished
F12 Analytic presentation
The platform shows all the necessary experiment statistics, or it can be easily integrated with an-other analytic tool
F13 Conditional triggering Only the data from affected users are collected and evaluated
F14 Missing data detection This feature detects if there are data points miss-ing
F15 Novelty and primacy effect detection Detects if there are any novelty or primacy ef-fects in the experiment
F16 Use correct statistical test When analysing the results, this feature recom-mends the correct statistical method
F17 Heterogeneous treatment effect detection This feature detects if the experiment has any heterogeneous treatment effects
5.3 Mapping of Trustworthy Principles to Platform Features
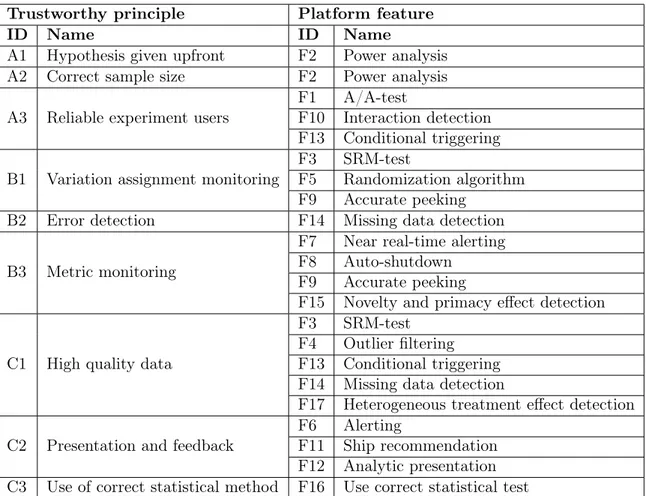
In Section 5.1 and 5.2, the important trustworthy principles and platform features have been explained. This section shows how these trustworthy principles and platform features relate to each other. Beneath follows the trustworthy principles and the features related to them. These are also summarized in Table 3.
5.3.1 Features in the Experimentation Design Phase
A1 - Hypothesis given upfront It is important that it is decided what the purpose of the experiment is beforehand, e.g. which metrics are key for the feature being tested and which sample size should be used. If this principle is fulfilled depends a lot on the experimenter but if a power analysis is performed the hypothesis has to be decided beforehand.
A2 - Correct sample size Having the correct sample size is an important part of trust-worthy online controlled experiments. The sample size needs to be big enough to have statistical power for the particular experiment but at the same time it should not be too big since this can decrease the statistical power of some metrics. Performing a power analysis before experimentation helps to ensure that the correct sample size is used. A3 - Reliable experiment users In addition to having the correct sample size it is equally important that the experiment users are reliable. There should be no carryover effects on the users which the A/A-test can ensure. Also the users should not be part of conflicting experiments at the same time and the interaction detection feature can detect this. If the experiment has a certain group that is affected by an added feature the conditional triggering feature ensures that only the data from the affected users are collected.
5.3.2 Features in the Experimentation Execution Phase
B1 - Variation assignment monitoring Dividing the users correctly between the vari-ations is crucial for the trustworthiness of an experiment since an incorrect split often causes the results to be invalid. The randomization algorithm feature ensures that the correct split is being made. This can be monitored if the platform allows for accurate peeking and by running a SRM-test the experimenter can verify that the correct split really was carried out.
B2 - Error detection Online controlled experimentation is sensitive to lost data and small errors and it is important that there are features in place, such as the missing data detection feature, to identify the errors and alert the experimenter when such issues occur.
B3 - Metric monitoring During experimentation it is important to monitor important metrics in order to notice unexpected metric movements and identify harmful experiments. The accurate peeking feature allows the experimenter to monitor the important metrics of the experiment. If an added feature for example causes huge PLT for the users, the near real-time alerting feature will inform the experimenter about it and if an auto-shutdown feature is in place this will abort the experiment. It is also important to have a feature for novelty and primacy effect detection that can identify if a positive or negative metric movement is a novelty or a primacy effect so that no experiment is shutdown prematurely.
5.3.3 Features in the Experimentation Analysis Phase
C1 - High quality data When analyzing the results there are several features that can ensure that the data is of high quality and if the results are statistically significant or not. The outlier filtering feature ensures that single extreme values do not effect the results. Another feature that improves the data quality is the missing data detection since missing data points in one of the variations can make the results invalid. Having a feature that can detect heterogeneous treatment effects also increases the data quality since it identifies big differences in the results between different groups of users. The conditional triggering feature also helps improving the data quality since it separates useful data from "noise". Finally, the collected data is often invalid if there is a SRM, thus it is important to have the SRM-test feature.
C2 - Presentation and feedback In the analysis phase the platform presents the re-sults. The analytic presentation should highlight changes in important metrics and only present relevant information about the experiment. If there is some issue with the result or if there were problems during the experiment the platform should alert the exper-imenter about it, which is the function of the alerting feature. The ship recommenda-tion feature informs if the differences between the control and treatment were statistically significant and if the tested feature should be shipped or not.
C3 - Use of correct statistical method There are different statistical methods for com-puting if the results are statistically significant or not. Since there might be several OEC metrics the platform should recommend the correct statistical method to the specific metric. For example, a t-test is ok when the metric is calculated per randomization user, e.g. click per user.
Table 3: Mapping of trustworthy principles and platform features Trustworthy principle Platform feature
ID Name ID Name
A1 Hypothesis given upfront F2 Power analysis A2 Correct sample size F2 Power analysis A3 Reliable experiment users
F1 A/A-test
F10 Interaction detection F13 Conditional triggering B1 Variation assignment monitoring
F3 SRM-test
F5 Randomization algorithm F9 Accurate peeking
B2 Error detection F14 Missing data detection
B3 Metric monitoring
F7 Near real-time alerting F8 Auto-shutdown
F9 Accurate peeking
F15 Novelty and primacy effect detection
C1 High quality data
F3 SRM-test F4 Outlier filtering F13 Conditional triggering F14 Missing data detection
F17 Heterogeneous treatment effect detection C2 Presentation and feedback
F6 Alerting
F11 Ship recommendation F12 Analytic presentation C3 Use of correct statistical method F16 Use correct statistical test
5.4 Intermediate Validation
This section presents the method used in order to validate the results. Before proceeding with the platform evaluation a validation of the results were needed. In four different one hour sessions the thesis author met with a subject matter expert in the field of research of online controlled experiments. In each session the current progress of sections 5.1 - 5.3.3 were presented to the expert. The results were revised in accordance with the feedback given. The results were considered to be validated when the last of the four sessions was concluded.
6
Platform Evaluation
Although many companies have developed their own experimentation platform there are many platforms available for A/B-testing, both commercial and open source. This section presents information about the selected platforms, Optimizely and Visual Website Optimizer, and which of the features from Table 2 that they include. The identified features are summarized in Table 4. In order to evaluate to what extent the features were included in the platform the following scale was used: the l means that the feature is available, 6 means that the feature is not available and w means that the feature is partially available.
6.1 Evaluation Through Documentation Study
6.1.1 Optimizely
Optimizely is a company that develops large-scale commercial experimentation software available for other companies. Their experimentation platform, which is one of the most popular A/B-testing-platform on the market [19], is called Optimizely X. The platform includes tools for both A/B-testing and MVT (i.e. more than two variations) on mobile applications for iOS and Android, OTT players (e.g. tvOS and Android ) and web ex-perimentation [22]. The platform also offers Optimizely’s Stats Engine for analyzing and interpreting experimentation results.
In order to identify the features from Table 2 in the Optimizely platform documentation were examined in the form of the platform feature matrix, (downloadable from [23]), the "Optimizely Knowledge Base" [24] and other documentation related to the Optimizely platform [25]. The results can be found in Table 4.
6.1.2 Visual Website Optimizer
Visual Website Optimizer (VWO) is a product from the software development company Wingify. They offer two different platforms for A/B-testing, the VWO Conversion Opti-mization Platform and the VWO Testing Platform [26]. Much like Optimizelys’ platform VWO offers experimentation in the form of A/B-testing and MVT on the web as well as on mobile devices.
In order to identify the features from Table 2 in the VWO Conversion Optimization Plat-form a documentation study was conducted. The documents used were the "Plan Types and Features" table [26] and the "VWO Knowledge Base" [27]. The results can be found in Table 4
Table 4: Features in the selected platforms
Optimizely VWO
ID Platform feature Comment Comment
F1 A/A-test l Also has the ability to identify
in-conclusive A/A-tests [24] l Feature included F2 Power analysis w A "sample size calculator" is
avail-able on the Optimizely website [24] l
VWO SmartStats calculates how long the experiment need to run [27]
F3 SRM-test 6 Not supported 6 Not supported
F4 Outlier filtering w A result page where outliers quickly
can be identified [24] is available 6 Not supported F5 Randomization
algorithm l
Divides users into buckets with unique IDs ensuring consistent vari-ation exposure [24].
l Feature included
F6 Alerting 6 Not supported 6 Not supported
F7 Near real-time
alerting 6 Not supported w
Not available for metrics but for other aspects that concerns trust-worthiness such as outages [27] [26]
F8 Auto-shutdown 6 Not supported 6 Not supported
F9 Accurate peeking l
Allows for accurate peeking by com-bining sequential testing and false discovery rate controls [28]
l
SmartStats calculates the potential loss in order to decide when a test should end [27]
F10 Interaction
detec-tion l
The audience builder can prevent users from participating in conflict-ing experiments [24]
6 Not supported
F11 Ship
recommen-dation l
Declares if there is a winner based on statistical significance [24] l
SmartStats declares a winning vari-ation [27]
F12 Analytic
presen-tation l
Has its own stats engine. Can be integrated with other tools [24] l
Shows the necessary statistics, can also be integrated with other tools [27]
F13 Conditional
trig-gering l
Included in the platform as
condi-tional activation [23] l
The platform offers triggering on several different conditions [26] F14 Missing data
de-tection 6 Not supported 6 Not supported
F15
Novelty and pri-macy effect detec-tion
6 Not supported 6 Not supported
F16 Use correct
statis-tical test l
The stats engine is used instead of "traditional fixed hypothesis test-ing" when declaring a winner [28]
l
Uses Bayesian statistics to ensure that the results neither are overes-timated nor underesoveres-timated [27] F17
Heterogeneous treatment effect detection
6 Not supported 6 Not supported
l = Feature included
w = Feature partially included 6 = Feature not included
6.2 Evaluation Through Interview
During an interview that was conducted with the Optimizely co-founder and a statisti-cian at Optimizely the results from the previous evaluation (see the initial evaluation in Appendix B) were discussed. The purpose was to get input and feedback on the initial evaluation and to see whether the co-founder and the statistician agreed with the presented results.
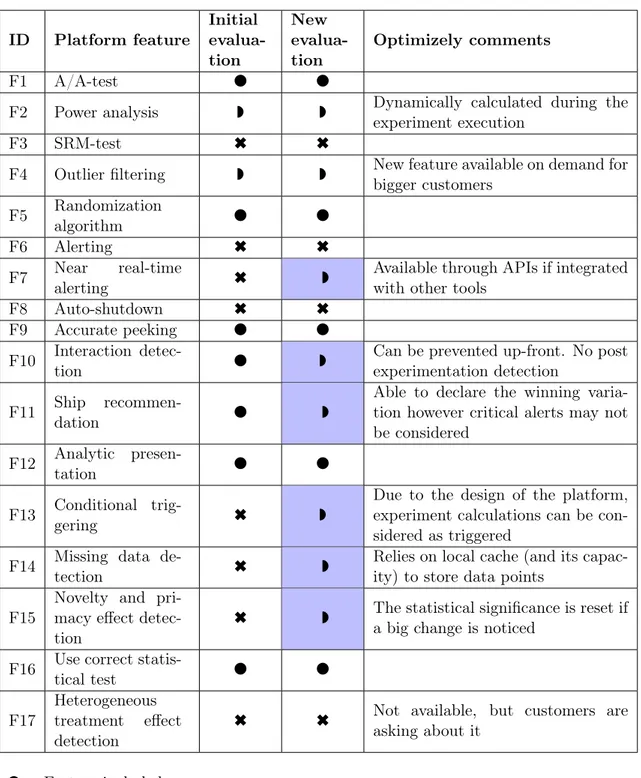
This section presents the new evaluation along with quotes and comments from Optimizely on the features were the results were altered from the initial evaluation or were clarification from Optimizely where needed. The scale used is the same as in Section 6, i.e. l = the feature is available,w = the feature is partially available and 6 = the feature is not available. An overview of the differences between the different evaluations along with comments from Optimizely is available in Table 5. Were the initial evaluation differs from the new evaluation the results are highlighted.
l : A/A-test, Randomization algorithm, Accurate peeking, Analytic presentation, Use correct statistical test.
6 : SRM-test, Alerting, Auto-shutdown, Heterogeneous treatment effect detection. w : Power analysis, Outlier filtering, Near real-time alerting, Interaction detection, Ship recommendation, Conditional triggering, Missing data detection, Novelty and primacy effect detection.
"Optimizely uses a sequential test that guarantees full power out of the box. So we don’t actually require users to make a power calculation at all. For convenience, we do give a running "samples remaining" estimate to provide some feedback to the user about how long the experiment should take."
– Statistician on power analysis
"In the sequential framework, the numbers we display on the results page are valid at all times, so there is no notion of "early alerting" since, on Optimizely, all numbers are current. Another way to put it is that users can act on the infor-mation flowing to the page at any point during the experiment, so the distinction between "early" and "valid" is moot."
Table 5: Results of evaluation through interview ID Platform feature Initial evalua-tion New evalua-tion Optimizely comments F1 A/A-test l l
F2 Power analysis w w Dynamically calculated during the
experiment execution
F3 SRM-test 6 6
F4 Outlier filtering w w New feature available on demand for bigger customers F5 Randomization algorithm l l F6 Alerting 6 6 F7 Near real-time alerting 6 w
Available through APIs if integrated with other tools
F8 Auto-shutdown 6 6
F9 Accurate peeking l l
F10 Interaction
detec-tion l w
Can be prevented up-front. No post experimentation detection
F11 Ship
recommen-dation l w
Able to declare the winning varia-tion however critical alerts may not be considered
F12 Analytic
presen-tation l l
F13 Conditional
trig-gering 6 w
Due to the design of the platform, experiment calculations can be con-sidered as triggered
F14 Missing data
de-tection 6 w
Relies on local cache (and its capac-ity) to store data points
F15
Novelty and pri-macy effect detec-tion
6 w The statistical significance is reset ifa big change is noticed
F16 Use correct
statis-tical test l l
F17
Heterogeneous treatment effect detection
6 6 Not available, but customers are asking about it
l = Feature included
w = Feature partially included 6 = Feature not included
7
Discussion
7.1 General Discussion
The concept of trustworthy A/B-testing is often discussed in the research field of online controlled experiments but there is no agreed definition of the word. In this thesis we have studied articles and found several principles that the authors of the articles consider to be a necessity for trustworthy A/B-testing. Since online controlled experiments or A/B-testing are an active field of research there are probably many more principles to be identified. This thesis gives an overview of some of the most important trustworthy principles that are often mentioned in articles today.
Much like the trustworthy principles, the platform features were gathered from literature in the research field. Some of these features are developed by companies that have their own in-house experimentation platform which might explain the lack of some features in the commercial platforms evaluated in this thesis.
When examining the platforms, new features were discovered. One of these features, such as the "Stats Accelerator" from Optimizely, could have a negative impact on the trustwor-thiness of the results. The "Stats Accelerator" automatically adjusts traffic distribution between the variations. If the treatment variation is improving, the conversion rate the feature distributes more users to this variation in order to declare a winner quicker. How-ever, results might just be a false positive which can lead to a premature decision. This was considered as a topic for the interview but we had not enough time and how our initial evaluation was compared to the new evaluation was considered to be of greater importance for the results.
When performing the platform evaluation through the document study, circumstances were not optimal. Quality information about what features the platforms include were lacking. In addition to that, there are no definite naming standards for the platform features which made it difficult to identify the features. The interview led to several changes of the initial evaluation which shows that the features can be hard to discover in the documentation available for the Optimizely platform. One feature however, was new and had therefore not been documented yet.
7.2 Method Discussion
The literature review [17] proved to be a good choice of methodology for this thesis. Since there were a lot of material to go through, a structured way for processing this material was needed and this was provided by the literature review.
The documentation study that was chosen for the next step in the methodology did not quite provide the result I expected. As Oates mentions, much documentation can be obtained both quickly and conveniently [17] since it often is available without cost on the Internet, and this proved to be correct when the methodology was applied. However, the quality of this information was not good enough to provide an accurate result which is shown when comparing the results from the documentation evaluation and the interview evaluation.